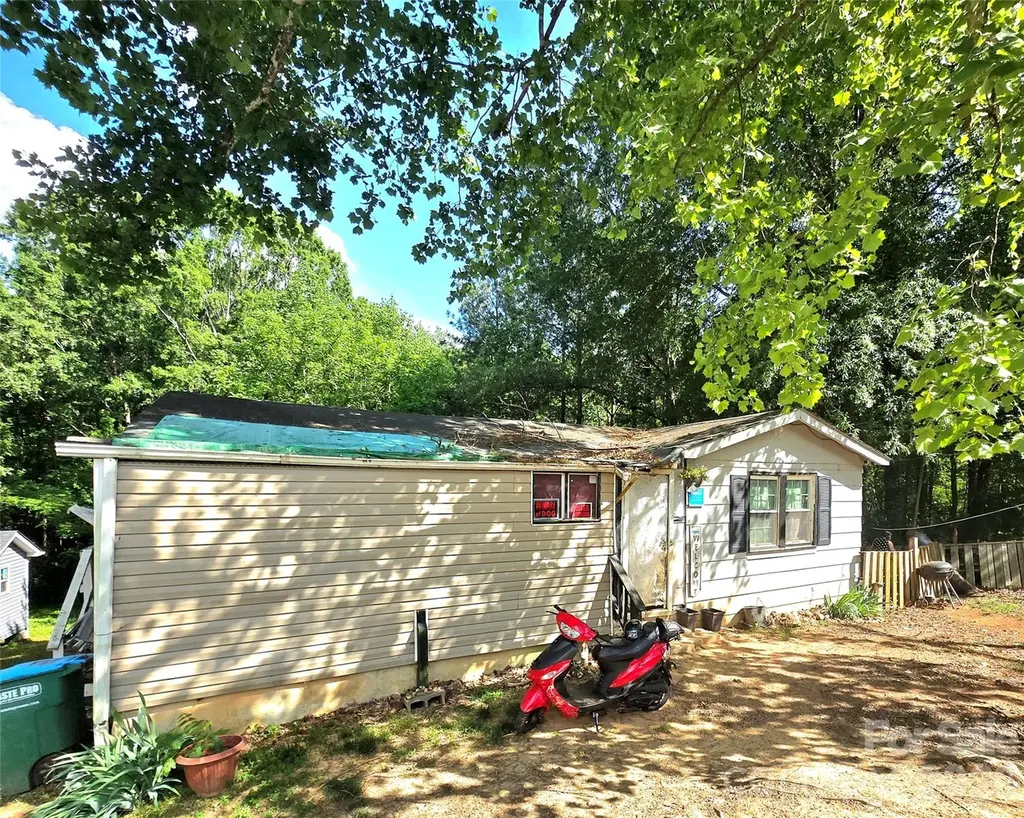
413 S Pinchback Ave · Bessemer City, NC
Flood risk 1/10 · Minimal
- FEMA flood zone
- X (unshaded)
- Chance of flooding over 30 yrs
- 0.0%
- Est. flood insurance / yr
- $473 – $860
Fire risk 4/10 · Minor
- Est. fire insurance / yr
- $906 – $1,684
Heat risk 5/10 · Moderate
- Hot days now (above 103°F)
- 7 days/yr
- Hot days in 30 yrs
- 17 days/yr
Wind risk 4/10 · Minor
- Chance of severe wind over 30 yrs
- 14.0%
Air-quality risk 3/10 · Minor
- Unhealthy air days now
- 2 days/yr
- Unhealthy air days in 30 yrs
- 4 days/yr
Risk factors via First Street. Map © Google.
Why this score? — see what drove the B- grade
The composite is a weighted blend of 9 inputs, each scored 0–100. Each bar is that input's sub-score; the figure is the points it added to the 100-point composite (weight × sub-score).
- Cash flow +30.0/30.0
- 1% rule +10.0/10.0
- DSCR +10.0/10.0
- ARV discount +7.5/15.0
- Schools +3.6/10.0
- Livability +2.9/5.0
- Rent growth +2.5/5.0
- Condition / age +2.5/5.0
- Appreciation +0.0/10.0
$49,900
🖨 Deal sheet 📄 Offer letter ✓ Due diligence
Listing remarks MLS
This property is being sold at a lower price due only to cosmetic reasons. This smaller home is in the ideal location for anyone looking to be close to the charlotte area without actually living there. The property does need a substantial amount of cosmetic work and would make for a great flip project.
Key facts
- 7,840 sq ft lot
- Built 1967
- Listed 51 days
Property features AI
Finance
- Other: Property is listed as residential single-family; Auction status: marked as auction
- HOA & community: No HOA; Not subject to HOA dues
Exterior
- Parking: No garage; No designated parking features listed
- Utilities: Public water; Public sewer
- Home design: Single-family residence; One story; Site-built home; R-1 zoning
- Construction: Wood construction; Crawl space foundation
- Exterior features: Lot includes both dirt and paved road frontage; Publicly maintained road
Interior
- Kitchen: No appliances specified
- Bedrooms: 2 bedrooms on the main level
- Bathrooms: 1 full bathroom on the main level
- Heating & cooling: Central heating; Central air conditioning
- Interior features: 4 total rooms; No built-in appliances listed
- Laundry & utility: In-unit laundry
Neighborhood map
What this means for you Summary
Snapshot
- This is a 2-bed/1.0-bath single-family listed at $50k.
Deal economics
- At list price, monthly cash flow is $565 ($7k/yr) — positive.
- The deal already cash-flows at list — no discount required.
- Meets the 1% rule at list price ($1k rent vs $50k).
- Recommended offer: $48k (3.0% below list) — sets the bar for market timing.
- Cap rate 19.9% vs local median 3.0% in Bessemer City — top-decile yield for the area; either an underpriced asset or a hidden risk that comps aren't pricing in. Stress-test before assuming the spread holds.
Location & tenants
- Location reads 57/100 on livability (#596 in NC) — a working-class tenant base; expect higher turnover. Strengths: cost of living A+, housing A+; Watch: crime D, schools F, amenities F.
- Gaston County Schools (suburban): math 44% / reading 42% proficiency, ranked #93 of 178 in NC (top 52%) — families likely to look elsewhere, expect single-tenant / working-renter base with shorter leases.
- Market conditions: 159 active listings in the ZIP; 2,069 units permitted in Gaston County in 2024 (142 in 5+ unit buildings).
Forward outlook
- Local home prices are declining (-3.0%/yr); year-one equity from $345 of loan paydown is wiped out by about $1k of value loss. Plan a longer hold.
- Gaston County population projected at +12% by 2050 — modest demand growth; plan on rents tracking national, not racing it.
- At projected returns (-3.0% appreciation + 3.0% rent growth), your $14k cash investment doubles in ~3 years — after that, you're playing with house money.
Negotiation context
- It's been on market 51 days — a 3% lower offer ($48k) is reasonable based on typical stale-listing flexibility.
- 3 sale attempts since 5y ago; this cycle's ask has dropped $28k (36%) from the opening price — seller is motivated, your offer sets the floor, not the list.
Risks & watch-outs
- Climate carrying-cost: extreme-heat days projected 7→17/yr by 2055 (HVAC capex compounding) — expect insurance premiums to compound above CPI over the hold.
Questions for the listing agent
- It's been on market 51 days. Have you received any prior offers? Is the seller open to a 3% concession, seller financing, or rate buy-down credit?
- Built in 1967 — when were the roof, HVAC, electrical panel, plumbing, and water heater last replaced?
- Is there a deadline driving the sale (1031 exchange, divorce, estate, relocation)? That informs how much negotiation room exists.
- Schools are F-rated, which usually means shorter tenancies and higher turnover. Who's the typical renter profile here, and what's been the actual vacancy rate?
- Crime grade is D in this area — have there been break-ins, vandalism, or insurance claims at this property in the last 3 years? What carrier currently insures it and at what premium?
- What's the average days-on-market for RENTAL listings here right now (not sales)? A rising rental-DOM trend means longer vacancies and softer asking-rent achievability than the comps imply.
- What's the recent tenant-quality profile in this submarket — average credit score on applications, eviction rate, late-payment / NSF rate, and stable-employment percentage? A property-management company in the area should have these aggregated.
- How much new for-sale + rental construction is in the pipeline within 1–3 miles? Heavy new supply typically softens prices + rents 12–24 months out; constrained supply supports both.
Investment metrics
- 1% rule
- 2.26% ✓
- Cap rate
- 19.87%
- Cash-on-cash
- 48.49%
- DSCR
- 3.16
- GRM
- 3.7
CMA / ARV
- ARV (on-the-fly)
- $112,412
- Comps found
- 1
Show comp detail 1 sale within ~0.75 mi
| Address | Dist | Beds/Ba | Sqft | Sold | Price | $/sf | Match |
|---|---|---|---|---|---|---|---|
| 914 W Virginia Ave | 0.49mi | 2/1.0 | 616 (-2%) | 14mo | $110,000 | $179 | 62 |
Match score weights: distance 35% · size 25% · config 20% · recency 20%. Top-matched comps best support the ARV.
Projected returns pro-forma
-3.0% appreciation · 3.0% rent growth · sell at horizon
- IRR
- 46.0%
- Equity multiple
- 3.00×
- Total profit
- $27,878
- Equity at exit
- $7,440
- IRR
- 51.8%
- Equity multiple
- 6.05×
- Total profit
- $70,600
- Equity at exit
- $4,314
Cash invested: $13,972 (down + closing). Projections, not guarantees.
Landlord ↔ Tenant lean methodology
- Overall (STATE)
- 85 Strongly Landlord-Friendly
- State North Carolina
- 85 Strongly Landlord-Friendly · R+3
- County
- — inherits STATE
- City
- — inherits STATE
ZIP-level market 28016
- Home prices YoY
- -22.1%
- Active inventory
- 159
- Price-to-rent
- 3.7×
Monthly cashflow live
- Estimated rent
- $1,127 medium interval (Pro) →
- Mortgage (P&I)
- −$262
- Tax from tax record
- −$43 /mo · $518/yr
- Insurance
- −$21
- HOA
- −$0
- Vacancy / Maint / Mgmt
- −$237
- Net cashflow
- $565
Break-even live
UW: 25.0% down · 7.5% · 30yr · 1.5% tax · 5.0% vac · 8.0% maint · 8.0% mgmt
Financing live
Cash to close
- Down payment
- $12,475
- Closing costs
- $1,497
- Reserves months
- —
- Total cash needed
- —
Loan-product check · same deal, 3 products live
Conventional
25% down · 7.5% · 30yr
- Down + closing
- —
- Monthly P&I
- —
- Monthly cashflow
- —
- DSCR
- —
- Eligible?
- —
Personal DTI + credit; lowest rate.
DSCR
20% down · 8.5% · 30yr
- Down + closing
- —
- Monthly P&I
- —
- Monthly cashflow
- —
- DSCR
- —
- Eligible?
- —
No personal income docs; deal must DSCR.
Hard money
10% down · 12.0% · 12mo
- Down + closing
- —
- Monthly P&I
- —
- Monthly cashflow
- —
- DSCR
- —
- Eligible?
- —
Short-term bridge; refi at stabilization.
Listing history 25 events
-
2026-06-18days on market $49,900 Active 51 DOM
-
2026-06-17days on market $49,900 Active 50 DOM
-
2026-06-16days on market $49,900 Active 49 DOM
-
2026-06-15days on market $49,900 Active 48 DOM
-
2026-06-13days on market $49,900 Active 46 DOM
-
2026-06-09days on market $49,900 Active 42 DOM
-
2026-06-08days on market $49,900 Active 41 DOM
-
2026-06-08price $49,900 Active 40 DOM
-
2026-06-07days on market $58,000 Active 40 DOM
-
2026-06-04days on market $58,000 Active 37 DOM
-
2026-06-03days on market $58,000 Active 36 DOM
-
2026-06-02days on market $58,000 Active 35 DOM
-
2026-06-01days on market $58,000 Active 34 DOM
-
2026-05-31days on market $58,000 Active 33 DOM
-
2026-05-18price $58,000
-
2026-05-14price $72,000
-
2026-04-28$78,000 Active
-
2022-04-11soldstatus $45,000 Closed 303-char remark
Show marketing remark (303 chars)
This property is being sold at a lower price due only to cosmetic reasons. This smaller home is in the ideal location for anyone looking to be close to the charlotte area without actually living there. The property does need a substantial amount of cosmetic work and would make for a great flip project.
-
2022-04-11soldstatus $45,000
Show marketing remark (303 chars)
This property is being sold at a lower price due only to cosmetic reasons. This smaller home is in the ideal location for anyone looking to be close to the charlotte area without actually living there. The property does need a substantial amount of cosmetic work and would make for a great flip project.
-
2022-03-25status Pending 303-char remark
Show marketing remark (303 chars)
This property is being sold at a lower price due only to cosmetic reasons. This smaller home is in the ideal location for anyone looking to be close to the charlotte area without actually living there. The property does need a substantial amount of cosmetic work and would make for a great flip project.
-
2022-03-16price $54,000 303-char remark
Show marketing remark (303 chars)
This property is being sold at a lower price due only to cosmetic reasons. This smaller home is in the ideal location for anyone looking to be close to the charlotte area without actually living there. The property does need a substantial amount of cosmetic work and would make for a great flip project.
-
2022-03-14$59,000 Active 303-char remark
Show marketing remark (303 chars)
This property is being sold at a lower price due only to cosmetic reasons. This smaller home is in the ideal location for anyone looking to be close to the charlotte area without actually living there. The property does need a substantial amount of cosmetic work and would make for a great flip project.
-
2021-12-30$57,000 Active
-
2006-03-01soldstatus $34,000
-
1993-04-01soldstatus $14,000
ⓘ Source: listings_history table (triggers on properties + properties_extension) + one-shot
backfill from property_details.listing_events for pre-trigger history.
Tax reassessment forecast NC · Resets to sale price
- Current annual tax
- $518 · $43/mo
- Projected year-2 tax
- $518 · $43/mo
- Expected delta
- $0/yr ($0/mo · 0.0%)
ⓘ Screening estimate from a state-policy table — verify with the county assessor before closing.
Climate risk First Street
- Flood 1/10 Low FEMA zone X (unshaded) · 0% chance over 30 yrs
- Wildfire 4/10 Moderate
- Heat 5/10 Major 7 d/yr ≥103°F today · 17 d/yr by 30 yrs out
- Wind 4/10 Moderate 14% chance of damaging wind over 30 yrs
- Air quality 3/10 Moderate 2 unhealthy d/yr today · 4 by 30 yrs out
Nearby sold comps map
Loading sold comps map…
Walkable amenities ~0.75 mi
Loading nearby amenities…
Taxation est. · year 1
- Rental income
- $13,522
- − Mortgage interest
- −$2,795
- − Property taxes
- −$518
- − Insurance
- −$250
- − Repairs & maintenance
- −$1,082
- − Management
- −$1,082
- − Depreciation
- −$1,452
- Taxable income
- $6,345
- Est. tax owed @ 24.0%
- −$1,523
- After-tax cash flow
- $5,252/yr
For passive investors: Depreciation is non-cash, so a rental often shows a tax loss while cash-flowing — sheltering income. Rental losses are passive: they offset passive income freely, and up to $25,000/yr can offset ordinary (W-2) income if you actively participate and your MAGI is under $100k (phasing out to $0 by $150k); unused losses carry forward. On sale, claimed depreciation is recaptured at up to 25%, and gains may owe capital-gains tax (a 1031 exchange can defer both). Figures are a year-1 estimate at your 24.0% rate — not tax advice; consult a CPA.
Schools (NCES district)
- District
- Gaston County Schools
- NCES district ID
- 3701620
- Math proficiency
- 44% ▲ 4.00%
- Reading proficiency
- 42% ▲ 1.00%
- Median HH income
- $43,644
- Composite
- 36.39/100
- National rank
- #4680
- State rank
- #93 of 178 in NC
Livability — Bessemer City
- Score
- 57/100
- State rank
- #596
- US rank
- #21724
Category grades
Schools grade is shown separately in the Schools card above.
Census & demographics
- Census place
- Bessemer City, NC
- County
- Gaston County · 201,497 people
- City population
- 13,109
- Metro
- Charlotte-Concord-Gastonia, NC-SC
- Population (ZIP)
- 13,109
- Household income
- $57,147
- Rent vs Own
- Severe rent burden
- 310.0
Population outlook (Gaston County) Hauer SSP2
- Today (2025)
- 230,027 people
- By 2030
- 237,300 · +3.2%
- By 2040
- 249,659 · +8.5%
- By 2050
- 257,806 · +12.1%
- By 2075
- 272,163 · +18.3%
- By 2100
- 268,652 · +16.8%
Race, ethnicity, and origin ACS 2023
- Neighborhood character
- Predominantly White (83%)
- Race & ethnicity
- White 83% Black 7% Hispanic / Latino 6% Two or more races 5%
- Hispanic origin (detail)
- Mexican 2% Puerto Rican 1%
- Common ancestry
- Serbian 3% Slovak 2% Italian 1%
- Foreign-born
- 3% · Canada
- Languages at home
- 94% English-only · Spanish 5%
Political lean MEDSL · Gaston
- 2024 margin
- Strong R (+25.0) · D 37.0% · R 62.1%
- 2008→2024 swing
- 0.0pp no change · 2008: -25.0pp · 2024: -25.0pp
- All cycles
- 2024: R+25.0 2020: R+27.8 2016: R+32.1 2012: R+25.6 2008: R+25.0
Not yet ingested
- Civics
- —
Market trends
- HPI YoY
- ▼ -68.47%
- Current HPI
- 241.2689
- Rent YoY
- —
- Metro
- Charlotte-Concord-Gastonia, NC-SC
- State GDP YoY
- ▲ 3.28%
- F500 in state
- 26
Industry mix (Fortune 500 HQ in NC)
| Industry | F500 HQs | Revenue |
|---|---|---|
| Financial Services | 2 | $213B |
|
||
| Retail | 2 | $95B |
|
||
| Industrial Conglomerate | 1 | $38B |
|
||
| Metals / Steel | 1 | $35B |
|
||
| Utilities | 1 | $30B |
|
||
| Industrial Machinery | 1 | $19B |
|
||
Price history
+314.3% since first listed11 events — show timeline
- 2026-05-18 Price Changed $58,000 CANOPYMLS as Distributed by MLS Grid
- 2026-05-14 Price Changed $72,000 CANOPYMLS as Distributed by MLS Grid
- 2026-04-28 Listed $78,000 CANOPYMLS as Distributed by MLS Grid
- 2022-04-11 Sold (Public Records) $45,000 Public Records
- 2022-04-11 Sold (MLS) $45,000 CANOPYMLS as Distributed by MLS Grid
- 2022-03-25 Pending — CANOPYMLS as Distributed by MLS Grid
- 2022-03-16 Price Changed $54,000 CANOPYMLS as Distributed by MLS Grid
- 2022-03-14 Listed $59,000 CANOPYMLS as Distributed by MLS Grid
- 2021-12-30 Listed $57,000 CANOPYMLS as Distributed by MLS Grid
- 2006-03-01 Sold (Public Records) $34,000 Public Records
- 1993-04-01 Sold (Public Records) $14,000 Public Records
Property tax history
+0.7%/yrLatest (2025): $518 · +0.0% YoY. Source: county tax records.
Cash-flow waterfall
monthlySold comps — $/sqft
last 12 mo · ≤1 miLoading sold comps…