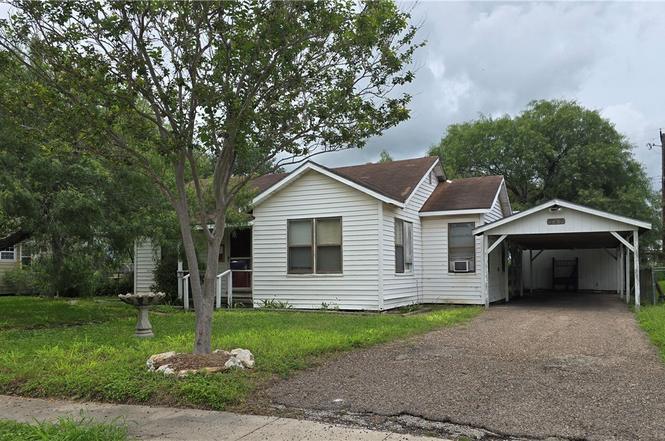
721 E Lewis St · Sinton, TX
Flood risk 4/10 · Minor
- FEMA flood zone
- X (shaded)
- Chance of flooding over 30 yrs
- 0.24%
- Est. flood insurance / yr
- $507 – $1,088
Fire risk 4/10 · Minor
- Est. fire insurance / yr
- $1,222 – $2,270
Heat risk 9/10 · Severe
- Hot days now (above 109°F)
- 7 days/yr
- Hot days in 30 yrs
- 24 days/yr
Wind risk 9/10 · Severe
- Chance of severe wind over 30 yrs
- 99.0%
Air-quality risk 1/10 · Minimal
- Unhealthy air days now
- 0 days/yr
- Unhealthy air days in 30 yrs
- 0 days/yr
Risk factors via First Street. Map © Google.
Why this score? — see what drove the B grade
The composite is a weighted blend of 9 inputs, each scored 0–100. Each bar is that input's sub-score; the figure is the points it added to the 100-point composite (weight × sub-score).
- Cash flow +27.9/30.0
- ARV discount +15.0/15.0
- 1% rule +9.9/10.0
- DSCR +9.9/10.0
- Livability +3.2/5.0
- Schools +2.6/10.0
- Rent growth +2.5/5.0
- Condition / age +2.5/5.0
- Appreciation +0.0/10.0
$115,000
🖨 Deal sheet 📄 Offer letter ✓ Due diligence
Listing remarks
Attention first-time homebuyers, investors, and handy buyers! This 3-bedroom, 2-bath home offers endless potential and features covered parking plus guest quarters for added flexibility. Centrally located in Sinton, you'll enjoy convenient access to schools, including the future new high school, and quick access to major highways. Don't miss this opportunity to own in one of South Texas' fastest-growing communities. With the arrival of Steel Dynamics and ongoing development throughout the area, Sinton continues to experience significant growth and investment. Whether you're looking for a starter home, rental property, or renovation project, this property is full of possibilities. Property i
Key facts
- Guest quarters
- Covered parking
- 9,188 sq ft lot
Tags
Property features AI
Finance
- HOA & community: Short-term rentals allowed
Exterior
- Parking: Covered carport; Front entry and rear/side off-street parking; On-street parking
- Utilities: Natural gas available; Phone service available; Public water; Public sewer
- Home design: Single-story property; Pillar/post/pier foundation; Shingle roof; Vinyl and wood siding
- Construction: Built with vinyl and wood siding; Shingle roof; Pillar/post/pier foundation
- Exterior features: Storage; Workshop; Chain link fence; Landscaped, interior lot
Interior
- Kitchen: Electric oven; Electric range; Refrigerator
- Flooring: Carpet; Hardwood; Laminate
- Bathrooms: 2 full bathrooms
- Heating & cooling: Gas heating; Window unit heating; Gas cooling; Window unit cooling
- Interior features: Cable TV; Additional living quarters
- Laundry & utility: Washer hookup; Dryer hookup
Neighborhood map
What this means for you Summary
Snapshot
- This is a 3-bed/2.0-bath single-family listed at $115k.
Deal economics
- At list price, monthly cash flow is $356 ($4k/yr) — positive.
- The deal already cash-flows at list — no discount required.
- Meets the 1% rule at list price ($2k rent vs $115k).
- Cap rate 10.0% vs local median 3.8% in Sinton — top-decile yield for the area; either an underpriced asset or a hidden risk that comps aren't pricing in. Stress-test before assuming the spread holds.
Location & tenants
- Location reads 65/100 on livability (#667 in TX) — a middle-class / working-renter tenant base. Strengths: cost of living A+, health & safety A+, housing A-; Watch: schools F, amenities F, commute F.
- Sinton ISD (town): math 27% / reading 35% proficiency, ranked #601 of 826 in TX (top 73%) — families likely to look elsewhere, expect single-tenant / working-renter base with shorter leases; 67% free/reduced lunch — lower-income household profile, screen leases tightly.
- Market conditions: 159 active listings in the ZIP; 2 comparable units currently listed for rent nearby; 344 units permitted in San Patricio County in 2024 (0 in 5+ unit buildings).
Forward outlook
- Local home prices are declining (-3.0%/yr); year-one equity from $795 of loan paydown is wiped out by about $3k of value loss. Plan a longer hold.
- San Patricio County population projected at +27% by 2050 — long-run rental-demand tailwind backs the buy-and-hold thesis.
- At projected returns (-3.0% appreciation + 3.0% rent growth), your $32k cash investment doubles in ~9 years — after that, you're playing with house money.
Negotiation context
- Only 4 days on market — expect competitive offers; lowballing is unlikely to land.
Risks & watch-outs
- Watch-outs: property tax is 3.6% of price; built in 1950 — expect roof / HVAC / electrical / plumbing capex.
- Climate carrying-cost: severe wind risk, 99% chance of damaging wind over 30y; extreme-heat days projected 7→24/yr by 2055 (HVAC capex compounding) — expect insurance premiums to compound above CPI over the hold.
Questions for the listing agent
- Built in 1950 — when were the roof, HVAC, electrical panel, plumbing, and water heater last replaced?
- Property tax is high relative to price — has the assessment been appealed recently, and will the sale trigger a re-assessment?
- Is there a deadline driving the sale (1031 exchange, divorce, estate, relocation)? That informs how much negotiation room exists.
- Schools are F-rated, which usually means shorter tenancies and higher turnover. Who's the typical renter profile here, and what's been the actual vacancy rate?
- What's the average days-on-market for RENTAL listings here right now (not sales)? A rising rental-DOM trend means longer vacancies and softer asking-rent achievability than the comps imply.
- What's the recent tenant-quality profile in this submarket — average credit score on applications, eviction rate, late-payment / NSF rate, and stable-employment percentage? A property-management company in the area should have these aggregated.
- How much new for-sale + rental construction is in the pipeline within 1–3 miles? Heavy new supply typically softens prices + rents 12–24 months out; constrained supply supports both.
Investment metrics
- 1% rule
- 1.49% ✓
- Cap rate
- 10.01%
- Cash-on-cash
- 13.27%
- DSCR
- 1.59
- GRM
- 5.6
CMA / ARV
- ARV (on-the-fly)
- $186,304
- Comps found
- 9
Show comp detail 9 sales within ~0.75 mi
| Address | Dist | Beds/Ba | Sqft | Sold | Price | $/sf | Match |
|---|---|---|---|---|---|---|---|
| 812 Hamilton St | 0.06mi | 3/2.0 | 1,120 (-1%) | 7mo | $195,500 | $175 | 89 |
| 800 Hamilton St | 0.09mi | 2/1.0 (-1) | 1,139 (+0%) | 6mo | $135,000 | $119 | 82 |
| 621 E Merriman St | 0.43mi | 3/2.0 | 1,170 (+3%) | 13mo | $165,750 | $142 | 64 |
| 113 W Welder St | 0.54mi | 3/2.0 | 1,152 (+1%) | 11mo | $225,000 | $195 | 63 |
| 606 Avenue F | 0.70mi | 4/2.0 (+1) | 1,148 (+1%) | 10mo | $199,900 | $174 | 53 |
| 600 E Merriman St | 0.48mi | 3/2.0 | 1,301 (+14%) | 2mo | $60,000 | $46 | 52 |
| 400 Avenue B | 0.66mi | 3/2.0 | 1,096 (-4%) | 14mo | $179,999 | $164 | 52 |
| 408 Avenue D | 0.60mi | 3/1.0 | 1,005 (-12%) | 2mo | $185,500 | $185 | 47 |
| 509 Avenue B | 0.71mi | 3/2.0 | 1,202 (+6%) | 20mo | $165,000 | $137 | 41 |
Match score weights: distance 35% · size 25% · config 20% · recency 20%. Top-matched comps best support the ARV.
Projected returns pro-forma
-3.0% appreciation · 3.0% rent growth · sell at horizon
- IRR
- 3.4%
- Equity multiple
- 1.13×
- Total profit
- $4,185
- Equity at exit
- $17,147
- IRR
- 13.0%
- Equity multiple
- 2.04×
- Total profit
- $33,443
- Equity at exit
- $9,943
Cash invested: $32,200 (down + closing). Projections, not guarantees.
Landlord ↔ Tenant lean methodology
- Overall (STATE)
- 87 Strongly Landlord-Friendly
- State Texas
- 87 Strongly Landlord-Friendly · R+5
- County
- — inherits STATE
- City
- — inherits STATE
ZIP-level market 78387
- Active inventory
- 159
- Price-to-rent
- 5.6×
Monthly cashflow live
- Estimated rent
- $1,711 medium interval (Pro) →
- Mortgage (P&I)
- −$603
- Tax from tax record
- −$344 /mo · $4,134/yr
- Insurance
- −$48
- HOA
- −$0
- Vacancy / Maint / Mgmt
- −$359
- Net cashflow
- $356
Break-even live
UW: 25.0% down · 7.5% · 30yr · 1.5% tax · 5.0% vac · 8.0% maint · 8.0% mgmt
Financing live
Cash to close
- Down payment
- $28,750
- Closing costs
- $3,450
- Reserves months
- —
- Total cash needed
- —
Loan-product check · same deal, 3 products live
Conventional
25% down · 7.5% · 30yr
- Down + closing
- —
- Monthly P&I
- —
- Monthly cashflow
- —
- DSCR
- —
- Eligible?
- —
Personal DTI + credit; lowest rate.
DSCR
20% down · 8.5% · 30yr
- Down + closing
- —
- Monthly P&I
- —
- Monthly cashflow
- —
- DSCR
- —
- Eligible?
- —
No personal income docs; deal must DSCR.
Hard money
10% down · 12.0% · 12mo
- Down + closing
- —
- Monthly P&I
- —
- Monthly cashflow
- —
- DSCR
- —
- Eligible?
- —
Short-term bridge; refi at stabilization.
Rent comps 2 comps
| Address | Beds | Baths | Sqft | Rent | $/sqft | DOM | Units | Dist |
|---|---|---|---|---|---|---|---|---|
| 1005 E Fulton St Sinton, TX | 2.0 | 2.0 | 1326 | $1,700 | $1.28 | 13d | 1 | 0.22mi |
| 804 Avenue B St Unit B Sinton, TX | 3.0 | 2.0 | 1092 | $1,750 | $1.60 | 21d | 1 | 0.92mi |
Listing history 5 events
-
2026-06-18days on market $115,000 Active 4 DOM
-
2026-06-17days on market $115,000 Active 3 DOM
-
2026-06-16days on market $115,000 Active 2 DOM
-
2026-06-15remarks 699-char remark
-
2026-06-15$115,000 Active 1 DOM
ⓘ Source: listings_history table (triggers on properties + properties_extension) + one-shot
backfill from property_details.listing_events for pre-trigger history.
Tax reassessment forecast TX · Resets to sale price
- Current annual tax
- $4,134 · $344/mo
- Projected year-2 tax
- $4,134 · $344/mo
- Expected delta
- $0/yr ($0/mo · 0.0%)
ⓘ Screening estimate from a state-policy table — verify with the county assessor before closing.
Climate risk First Street
- Flood 4/10 Moderate FEMA zone X (shaded) · 24% chance over 30 yrs
- Wildfire 4/10 Moderate
- Heat 9/10 Extreme 7 d/yr ≥109°F today · 24 d/yr by 30 yrs out
- Wind 9/10 Extreme 99% chance of damaging wind over 30 yrs
- Air quality 1/10 Low 0 unhealthy d/yr today · 0 by 30 yrs out
Nearby sold comps map
Loading sold comps map…
Walkable amenities ~0.75 mi
Loading nearby amenities…
Taxation est. · year 1
- Rental income
- $20,528
- − Mortgage interest
- −$6,442
- − Property taxes
- −$4,134
- − Insurance
- −$575
- − Repairs & maintenance
- −$1,642
- − Management
- −$1,642
- − Depreciation
- −$3,345
- Taxable income
- $2,747
- Est. tax owed @ 24.0%
- −$659
- After-tax cash flow
- $3,612/yr
For passive investors: Depreciation is non-cash, so a rental often shows a tax loss while cash-flowing — sheltering income. Rental losses are passive: they offset passive income freely, and up to $25,000/yr can offset ordinary (W-2) income if you actively participate and your MAGI is under $100k (phasing out to $0 by $150k); unused losses carry forward. On sale, claimed depreciation is recaptured at up to 25%, and gains may owe capital-gains tax (a 1031 exchange can defer both). Figures are a year-1 estimate at your 24.0% rate — not tax advice; consult a CPA.
Schools (NCES district)
- District
- Sinton ISD
- NCES district ID
- 4840350
- Math proficiency
- 27% ▼ -19.00%
- Reading proficiency
- 35% ▼ -3.00%
- Median HH income
- $44,618
- Composite
- 26.49/100
- National rank
- #7208
- State rank
- #601 of 826 in TX
Livability — Sinton
- Score
- 65/100
- State rank
- #667
- US rank
- #12510
Category grades
Schools grade is shown separately in the Schools card above.
Census & demographics
- Census place
- Sinton, TX
- Population (ZIP)
- 9,604
Population outlook (San Patricio County) Hauer SSP2
- Today (2025)
- 75,538 people
- By 2030
- 79,575 · +5.3%
- By 2040
- 87,670 · +16.1%
- By 2050
- 96,107 · +27.2%
- By 2075
- 117,984 · +56.2%
- By 2100
- 130,010 · +72.1%
Race, ethnicity, and origin ACS 2023
- Neighborhood character
- Predominantly Hispanic (71%)
- Race & ethnicity
- Hispanic / Latino 71% Two or more races 33% White 25% Black 2%
- Hispanic origin (detail)
- Mexican 64%
- Common ancestry
- Lithuanian 1%
- Foreign-born
- 2% · Canada
- Languages at home
- 62% English-only · Spanish 38%
Political lean MEDSL · San Patricio
- 2024 margin
- Solid R (+36.4) · D 31.4% · R 67.8%
- 2008→2024 swing
- -19.8pp toward R · 2008: -16.6pp · 2024: -36.4pp
- All cycles
- 2024: R+36.4 2020: R+29.1 2016: R+24.1 2012: R+20.6 2008: R+16.6
Not yet ingested
- Civics
- —
Market trends
- HPI YoY
- ▼ -81.32%
- Current HPI
- 149.9517
- Rent YoY
- —
- Metro
- —
- State GDP YoY
- ▲ 3.95%
- F500 in state
- 110
Industry mix (Fortune 500 HQ in TX)
| Industry | F500 HQs | Revenue |
|---|---|---|
| Energy | 16 | $1,198B |
|
||
| Technology | 5 | $198B |
|
||
| Engineering / Construction | 4 | $72B |
|
||
| Energy Services | 3 | $60B |
|
||
| Utilities | 3 | $41B |
|
||
| Healthcare | 2 | $330B |
|
||
Price history
1 event — show timeline
- 2026-06-10 Listed $115,000 CBMLS
Property tax history
+9.0%/yrLatest (2025): $4,134 · -6.9% YoY. Source: county tax records.
Cash-flow waterfall
monthlySold comps — $/sqft
last 12 mo · ≤1 miLoading sold comps…