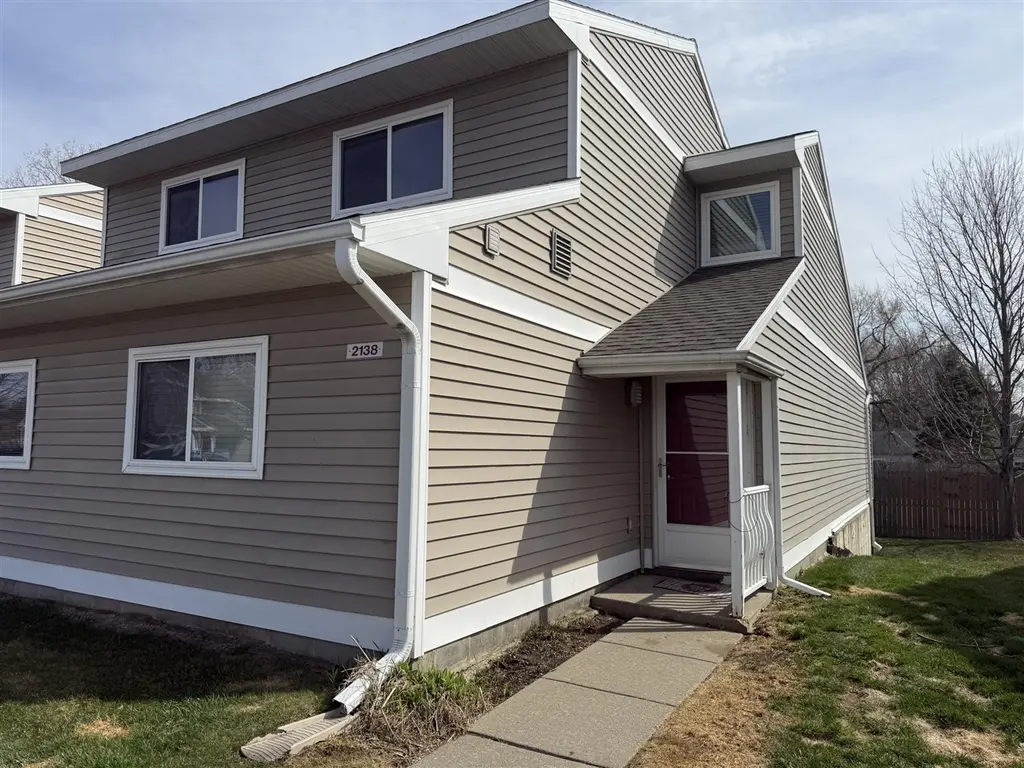
2138 Stone School Cir · Ann Arbor, MI
Flood risk 1/10 · Minimal
- FEMA flood zone
- X (unshaded)
- Chance of flooding over 30 yrs
- 0.0%
- Est. flood insurance / yr
- $507 – $1,088
Fire risk 1/10 · Minimal
- Est. fire insurance / yr
- $784 – $1,456
Heat risk 3/10 · Minor
- Hot days now (above 100°F)
- 7 days/yr
- Hot days in 30 yrs
- 15 days/yr
Wind risk 2/10 · Minimal
- Chance of severe wind over 30 yrs
- —
Air-quality risk 2/10 · Minimal
- Unhealthy air days now
- 1 days/yr
- Unhealthy air days in 30 yrs
- 3 days/yr
Risk factors via First Street. Map © Google.
Why this score? — see what drove the C grade
The composite is a weighted blend of 9 inputs, each scored 0–100. Each bar is that input's sub-score; the figure is the points it added to the 100-point composite (weight × sub-score).
- ARV discount +15.0/15.0
- Cash flow +13.9/30.0
- Schools +6.5/10.0
- 1% rule +5.7/10.0
- Livability +4.4/5.0
- DSCR +4.2/10.0
- Rent growth +3.9/5.0
- Condition / age +2.5/5.0
- Appreciation +0.0/10.0
$181,300
🖨 Deal sheet 📄 Offer letter ✓ Due diligence
Listing remarks MLS
Affordable Housing in Ann Arbor! This clean 3 bedroom, 2 bath townhouse condo is a rare end unit in Stone School. Enjoy ample living space with a vaulted ceiling, breakfast bar, spacious loft master suite and fully finished lower level with egress window. New decks 2023, balcony offers additional outdoor living space overlooking peaceful green fields. Newer appliances (2017) and water heater (2018). HOA fees include water, exterior maintenance, lawn care and trash removal. This condominium is listed in accordance with the city of Ann Arbor Affordable Housing Covenant. Income and affordable housing limits apply. Close to everything Ann Arbor; restaurants, shopping, busline, etc. Applicant has to be approved by Washtenaw County Affordable Living income restrictions. Herd score of 8, http://a2gov.org/herdmap
Key facts
- Vaulted ceiling
- Balcony
- New decks
Tags
Neighborhood map
What this means for you Summary
Snapshot
- This is a 3-bed/2.0-bath condo listed at $181k.
Deal economics
- At list price, monthly cash flow is $19 ($228/yr) — positive.
- The deal already cash-flows at list — no discount required.
- Meets the 1% rule at list price ($2k rent vs $181k).
- Recommended offer: $170k (6.0% below list) — sets the bar for market timing.
- Cap rate 6.4% vs local median 2.5% in Ann Arbor — top-decile yield for the area; either an underpriced asset or a hidden risk that comps aren't pricing in. Stress-test before assuming the spread holds.
Location & tenants
- Location reads 88/100 on livability (#10 in MI, #155 nationally) — a professional / high-income tenant draw. Strengths: schools A+, amenities A+, commute A+; Watch: cost of living D.
- Ann Arbor Public Schools (urban): math 71% / reading 81% proficiency, ranked #6 of 540 in MI (top 1%) — strong family-tenant draw, lease renewals of 3-5y typical.
- Market conditions: Rents rising fast (+5.7%/yr); 151 active listings in the ZIP; 12 comparable units currently listed for rent nearby; rentals lingering (median 44d on market — plan ~5-8 weeks vacancy on turnover, expect pricing pressure); 50% of comp listings sitting > 30 days — soft ceiling on asking rent; solid renter incomes; 996 units permitted in Washtenaw County in 2024 (492 in 5+ unit buildings).
Forward outlook
- Local home prices are declining (-3.0%/yr); year-one equity from $1k of loan paydown is wiped out by about $5k of value loss. Plan a longer hold.
- Washtenaw County population projected at +25% by 2050 — long-run rental-demand tailwind backs the buy-and-hold thesis.
Negotiation context
- It's been on market 68 days — a 6% lower offer ($170k) is reasonable based on typical stale-listing flexibility.
- 8 sale attempts since 6y ago with the ask held roughly flat each time — persistent listings suggest the price (not the market) is what's stuck; bring a comps-based counter.
- Current owner paid $141k; 28% above their basis — modest negotiation headroom, anchor on the comps not their cost.
Questions for the listing agent
- It's been on market 68 days. Have you received any prior offers? Is the seller open to a 6% concession, seller financing, or rate buy-down credit?
- What does the HOA fee cover, when was the last increase, and are there any pending special assessments or reserve-fund shortfalls?
- Any open or pending special assessments — roof, HVAC, plumbing, elevator, façade? What's the per-unit balance and payoff schedule, and is the seller paying it off at close or rolling it to the buyer?
- Why hasn't it sold? Are there any deal-killer items the seller is aware of (foundation, flood, title, zoning, code violations)?
- Is there a deadline driving the sale (1031 exchange, divorce, estate, relocation)? That informs how much negotiation room exists.
- Schools are A-rated — typically a magnet for longer-tenancy family renters. What's the average tenant stay here, and is there a school-zone premium baked into asking?
- What's the average days-on-market for RENTAL listings here right now (not sales)? A rising rental-DOM trend means longer vacancies and softer asking-rent achievability than the comps imply.
- What's the recent tenant-quality profile in this submarket — average credit score on applications, eviction rate, late-payment / NSF rate, and stable-employment percentage? A property-management company in the area should have these aggregated.
- How much new apartment / multifamily construction is in the pipeline within 1–3 miles? Heavy new supply (>2% of stock underway) typically softens rents 12–24 months out; light construction supports rent growth.
Investment metrics
- 1% rule
- 1.07% ✓
- Cap rate
- 6.42%
- Cash-on-cash
- 0.45%
- DSCR
- 1.02
- GRM
- 7.8
CMA / ARV
- ARV (median comp)
- $244,693
- List price
- $181,300
- Delta
- -25.91%
- Verdict
- UNDERPRICED
- Comps
- 20 within 1.0 mi
Projected returns pro-forma
-3.0% appreciation · 5.72% rent growth · sell at horizon
- IRR
- -11.9%
- Equity multiple
- 0.56×
- Total profit
- $-22,505
- Equity at exit
- $27,032
- IRR
- 1.6%
- Equity multiple
- 1.13×
- Total profit
- $6,492
- Equity at exit
- $15,676
Cash invested: $50,764 (down + closing). Projections, not guarantees.
Landlord ↔ Tenant lean methodology
- Overall (STATE)
- 62 Landlord-Friendly
- State Michigan
- 62 Landlord-Friendly · EVEN
- County
- — inherits STATE
- City
- — inherits STATE
ZIP-level market 48108
- Rents YoY
- 5.7%
- Active inventory
- 151
- Price-to-rent
- 7.8×
Monthly cashflow live
- Estimated rent
- $1,947 high interval (Pro) →
- Mortgage (P&I)
- −$951
- Tax from tax record
- −$279 /mo · $3,347/yr
- Insurance
- −$76
- HOA
- −$214
- Vacancy / Maint / Mgmt
- −$409
- Net cashflow
- $19
Break-even live
UW: 25.0% down · 7.5% · 30yr · 1.5% tax · 5.0% vac · 8.0% maint · 8.0% mgmt
Financing live
Cash to close
- Down payment
- $45,325
- Closing costs
- $5,439
- Reserves months
- —
- Total cash needed
- —
Loan-product check · same deal, 3 products live
Conventional
25% down · 7.5% · 30yr
- Down + closing
- —
- Monthly P&I
- —
- Monthly cashflow
- —
- DSCR
- —
- Eligible?
- —
Personal DTI + credit; lowest rate.
DSCR
20% down · 8.5% · 30yr
- Down + closing
- —
- Monthly P&I
- —
- Monthly cashflow
- —
- DSCR
- —
- Eligible?
- —
No personal income docs; deal must DSCR.
Hard money
10% down · 12.0% · 12mo
- Down + closing
- —
- Monthly P&I
- —
- Monthly cashflow
- —
- DSCR
- —
- Eligible?
- —
Short-term bridge; refi at stabilization.
Rent comps 12 comps
| Address | Beds | Baths | Sqft | Rent | $/sqft | DOM | Units | Dist |
|---|---|---|---|---|---|---|---|---|
| 2040 Cloverly Ln Ann Arbor, MI | 2.0 | 2.5 | 1555 | $2,292 | $1.47 | 13d | 2 | 0.18mi |
| 3510 Pheasant Run Cir Ann Arbor, MI | 1.0–2.0 | 1.0 | 825 | $1,445 | $1.75 | 43d | 13 | 0.25mi |
| 3510 Pheasant Run Cir Ann Arbor, MI | 1.0–2.0 | 1.0 | 825 | $1,405 | $1.70 | 13d | 10 | 0.25mi |
| 2960 Birch Hollow Dr Ann Arbor, MI | 1.0–2.0 | 1.0 | 718 | $1,299 | $1.81 | 13d | 3 | 0.35mi |
| 3032 Forest Creek Ct Ann Arbor, MI | 2.0 | 2.0 | 966 | $1,750 | $1.81 | 43d | 1 | 0.37mi |
| 2716 Packard St Ann Arbor, MI | 1.0–2.0 | 1.0 | 862 | $1,350 | $1.57 | 43d | 1 | 0.66mi |
| 799 Addington Ln Ann Arbor, MI | 2.0 | 2.0 | 1299 | $2,150 | $1.66 | 13d | 1 | 0.90mi |
| 3238 Platt Rd Ann Arbor, MI | 3.0 | 1.5 | 1488 | $2,500 | $1.68 | 43d | 1 | 1.04mi |
| 2511 Packard St Ann Arbor, MI | 2.0–3.0 | 2.0 | 1200 | $2,539 | $2.12 | 13d | 7 | 1.11mi |
| 1533 Pine Valley Blvd Ann Arbor, MI | 1.0–2.0 | 1.0–1.5 | 827 | $1,725 | $2.09 | 43d | 1 | 1.27mi |
| 2315 Packard St Ann Arbor, MI | 2.0 | 1.0 | 848 | $1,500 | $1.77 | 13d | 1 | 1.43mi |
| 2315 Packard St Ann Arbor, MI | 2.0 | 1.0 | 869 | $1,500 | $1.73 | 43d | 2 | 1.43mi |
HOA detail condo
- Monthly dues
- $214 · $2,568/yr
- Likely covers
- watertrashlandscapingexterior maint.
- Assessments
- None detected in remarks — confirm with the listing agent.
Listing history 35 events
-
2026-06-18days on market $181,300 Active 68 DOM
-
2026-06-17days on market $181,300 Active 67 DOM
-
2026-06-16days on market $181,300 Active 66 DOM
-
2026-06-15days on market $181,300 Active 65 DOM
-
2026-06-14days on market $181,300 Active 63 DOM
-
2026-06-10days on market $181,300 Active 60 DOM
-
2026-06-09days on market $181,300 Active 59 DOM
-
2026-06-08days on market $181,300 Active 58 DOM
-
2026-06-07days on market $181,300 Active 57 DOM
-
2026-06-03days on market $181,300 Active 53 DOM
-
2026-06-02days on market $181,300 Active 52 DOM
-
2026-06-01days on market $181,300 Active 51 DOM
-
2026-05-31days on market $181,300 Active 50 DOM
-
2026-05-30days on market $181,300 Active 49 DOM
-
2026-03-18$181,300 Active 816-char remark
Show marketing remark (816 chars)
Affordable Housing in Ann Arbor! This clean 3 bedroom, 2 bath townhouse condo is a rare end unit in Stone School. Enjoy ample living space with a vaulted ceiling, breakfast bar, spacious loft master suite and fully finished lower level with egress window. New decks 2023, balcony offers additional outdoor living space overlooking peaceful green fields. Newer appliances (2017) and water heater (2018). HOA fees include water, exterior maintenance, lawn care and trash removal. This condominium is listed in accordance with the city of Ann Arbor Affordable Housing Covenant. Income and affordable housing limits apply. Close to everything Ann Arbor; restaurants, shopping, busline, etc. Applicant has to be approved by Washtenaw County Affordable Living income restrictions. Herd score of 8, http://a2gov.org/herdmap
-
2026-03-18$181,300 Active
Show marketing remark (816 chars)
Affordable Housing in Ann Arbor! This clean 3 bedroom, 2 bath townhouse condo is a rare end unit in Stone School. Enjoy ample living space with a vaulted ceiling, breakfast bar, spacious loft master suite and fully finished lower level with egress window. New decks 2023, balcony offers additional outdoor living space overlooking peaceful green fields. Newer appliances (2017) and water heater (2018). HOA fees include water, exterior maintenance, lawn care and trash removal. This condominium is listed in accordance with the city of Ann Arbor Affordable Housing Covenant. Income and affordable housing limits apply. Close to everything Ann Arbor; restaurants, shopping, busline, etc. Applicant has to be approved by Washtenaw County Affordable Living income restrictions. Herd score of 8, http://a2gov.org/herdmap
-
2020-08-20soldstatus $141,300
-
2020-08-05historical
-
2020-08-04soldstatus $141,300 Sold
-
2020-08-04soldstatus $141,300 Closed
-
2020-08-04soldstatus $141,300
-
2020-08-04soldstatus $141,300
-
2020-08-04soldstatus $141,300
-
2020-07-14status Pending
-
2020-07-14status Pending
-
2020-06-11historical Keep Showing-Contgcy Appl
-
2020-06-11historical Active - Contingent
-
2020-05-19$141,300 Active
-
2020-05-18historical $141,300
-
2020-05-16$141,300 Active
-
2020-05-16$141,300
-
2020-05-16$141,300
-
2020-05-16$141,300
-
2006-01-03soldstatus $107,000
ⓘ Source: listings_history table (triggers on properties + properties_extension) + one-shot
backfill from property_details.listing_events for pre-trigger history.
Tax reassessment forecast MI · Partial reset (capped growth)
- Current annual tax
- $3,347 · $279/mo
- Projected year-2 tax
- $3,347 · $279/mo
- Expected delta
- $0/yr ($0/mo · 0.0%)
ⓘ Screening estimate from a state-policy table — verify with the county assessor before closing.
Climate risk First Street
- Flood 1/10 Low FEMA zone X (unshaded) · 0% chance over 30 yrs
- Wildfire 1/10 Low
- Heat 3/10 Moderate 7 d/yr ≥100°F today · 15 d/yr by 30 yrs out
- Wind 2/10 Low
- Air quality 2/10 Low 1 unhealthy d/yr today · 3 by 30 yrs out
Nearby sold comps map
Loading sold comps map…
Walkable amenities ~0.75 mi
Loading nearby amenities…
Taxation est. · year 1
- Rental income
- $23,364
- − Mortgage interest
- −$10,156
- − Property taxes
- −$3,347
- − Insurance
- −$906
- − Repairs & maintenance
- −$1,869
- − Management
- −$1,869
- − HOA
- −$2,568
- − Depreciation
- −$5,274
- Taxable loss
- −$2,625
- Est. tax savings @ 24.0%
- +$630
- After-tax cash flow
- $858/yr
For passive investors: Depreciation is non-cash, so a rental often shows a tax loss while cash-flowing — sheltering income. Rental losses are passive: they offset passive income freely, and up to $25,000/yr can offset ordinary (W-2) income if you actively participate and your MAGI is under $100k (phasing out to $0 by $150k); unused losses carry forward. On sale, claimed depreciation is recaptured at up to 25%, and gains may owe capital-gains tax (a 1031 exchange can defer both). Figures are a year-1 estimate at your 24.0% rate — not tax advice; consult a CPA.
Schools (NCES district)
- District
- Ann Arbor Public Schools
- NCES district ID
- 2602820
- Math proficiency
- 71% ▲ 5.00%
- Reading proficiency
- 81% ▲ 11.00%
- Median HH income
- $60,768
- Composite
- 65.34/100
- National rank
- #487
- State rank
- #6 of 540 in MI
Livability — Ann Arbor
- Score
- 88/100
- State rank
- #10
- US rank
- #155
Category grades
Schools grade is shown separately in the Schools card above.
Census & demographics
- Census place
- Ann Arbor, MI
- County
- Washtenaw County · 306,860 people
- City population
- 163,747
- Metro
- Ann Arbor, MI
- Population (ZIP)
- 27,666
- Household income
- $89,355
- Rent vs Own
- Severe rent burden
- 1390.0
Population outlook (Washtenaw County) Hauer SSP2
- Today (2025)
- 402,878 people
- By 2030
- 424,104 · +5.3%
- By 2040
- 464,633 · +15.3%
- By 2050
- 504,728 · +25.3%
- By 2075
- 614,463 · +52.5%
- By 2100
- 676,181 · +67.8%
Race, ethnicity, and origin ACS 2023
- Neighborhood character
- Diverse neighborhood (Simpson 0.62)
- Race & ethnicity
- White 58% Black 16% Asian 14% Two or more races 8% Hispanic / Latino 6%
- Hispanic origin (detail)
- Mexican 4%
- Common ancestry
- Romanian 5% Italian 2% Slovak 2%
- Foreign-born
- 23% · China, Canada, South Korea
- Languages at home
- 72% English-only · Arabic 5% Other Indo-European 5% Chinese 5%
Political lean MEDSL · Washtenaw
- 2024 margin
- Solid D (+44.4) · D 71.0% · R 26.6% · Other 2.4%
- 2008→2024 swing
- +3.5pp toward D · 2008: 41.0pp · 2024: 44.4pp
- All cycles
- 2024: D+44.4 2020: D+46.6 2016: D+41.5 2012: D+36.0 2008: D+41.0
Not yet ingested
- Civics
- —
Market trends
- HPI YoY
- ▼ -221.96%
- Current HPI
- 216.8067
- Rent YoY
- ▲ 5.72%
- Metro
- Ann Arbor, MI
- State GDP YoY
- ▲ 1.37%
- F500 in state
- 28
Industry mix (Fortune 500 HQ in MI)
| Industry | F500 HQs | Revenue |
|---|---|---|
| Automotive Parts | 3 | $48B |
|
||
| Automotive | 2 | $372B |
|
||
| Chemicals | 1 | $45B |
|
||
| Automotive Retail | 1 | $29B |
|
||
| Healthcare / Medical Devices | 1 | $23B |
|
||
| Automotive Technology | 1 | $20B |
|
||
Price history
+69.4% since first listed21 events — show timeline
- 2026-03-18 Listed $181,300 SW Michigan MLS
- 2026-03-18 Listed $181,300 REALCOMP
- 2026-03-18 Listed $181,300 MiRealSource-MiMLS
- 2020-08-20 Sold (Public Records) $141,300 Public Records
- 2020-08-05 Delisted — AAMLS
- 2020-08-04 Sold (MLS) $141,300 REALCOMP
- 2020-08-04 Sold (MLS) $141,300 MiRealSource-MiMLS
- 2020-08-04 Sold (MLS) $141,300 SW Michigan MLS
- 2020-08-04 Sold (MLS) $141,300 MiRealSource-MiMLS
- 2020-08-04 Sold (MLS) $141,300 AAMLS
- 2020-07-14 Pending — MiRealSource-MiMLS
- 2020-07-14 Pending — AAMLS
- 2020-06-11 Contingent — MiRealSource-MiMLS
- 2020-06-11 Contingent — AAMLS
- 2020-05-19 Listed $141,300 AAMLS
- 2020-05-18 Coming Soon $141,300 AAMLS
- 2020-05-16 Listed $141,300 REALCOMP
- 2020-05-16 Listed $141,300 MiRealSource-MiMLS
- 2020-05-16 Listed $141,300 SW Michigan MLS
- 2020-05-16 Listed $141,300 MiRealSource-MiMLS
- 2006-01-03 Sold (Public Records) $107,000 Public Records
Property tax history
+6.7%/yrLatest (2025): $3,347 · -12.2% YoY. Source: county tax records.
Cash-flow waterfall
monthlySold comps — $/sqft
last 12 mo · ≤1 miLoading sold comps…