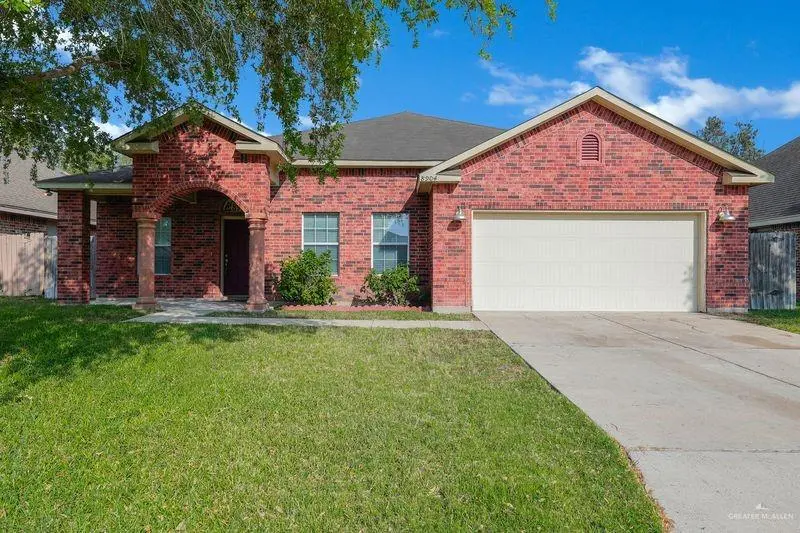
8904 N 21st St · McAllen, TX
Flood risk 1/10 · Minimal
- FEMA flood zone
- X
- Chance of flooding over 30 yrs
- 0.0%
- Est. flood insurance / yr
- $507 – $1,088
Fire risk 4/10 · Minor
- Est. fire insurance / yr
- $1,222 – $2,270
Heat risk 9/10 · Severe
- Hot days now (above 111°F)
- 7 days/yr
- Hot days in 30 yrs
- 23 days/yr
Wind risk 8/10 · Major
- Chance of severe wind over 30 yrs
- 99.0%
Air-quality risk 2/10 · Minimal
- Unhealthy air days now
- 0 days/yr
- Unhealthy air days in 30 yrs
- 1 days/yr
Risk factors via First Street. Map © Google.
Why this score? — see what drove the D+ grade
The composite is a weighted blend of 9 inputs, each scored 0–100. Each bar is that input's sub-score; the figure is the points it added to the 100-point composite (weight × sub-score).
- ARV discount +15.0/15.0
- Cash flow +12.9/30.0
- 1% rule +4.1/10.0
- DSCR +3.9/10.0
- Livability +3.8/5.0
- Schools +3.3/10.0
- Rent growth +3.1/5.0
- Condition / age +2.5/5.0
- Appreciation +0.0/10.0
$259,000
🖨 Deal sheet (PDF) 📄 Offer letter ✓ Due diligence
Listing remarks MLS
NICE & COZY 3bedroom 2bath with 2car garage, Nice layout design with comfortable size bedrooms that have carpet. House is located in highly sought location that is close to major shopping areas, schools and University, some repairs needed. Will NOT qualify for VA or FHA Financing.
Key facts
- Close to schools
- Quartz countertops
- New stove
Tags
Neighborhood map
What this means for you Summary
Snapshot
- This is a 3-bed/2.0-bath single-family listed at $259k.
Deal economics
- At list price, monthly cash flow is $-19 ($-232/yr) — negative.
- To cash-flow at today's rent, offer at most $256k (1.3% below list).
- To meet the 1% rule (rent ≥ 1% of price), the offer needs to be $235k (9.4% below list).
- Recommended offer: $235k (9.4% below list) — sets the bar for 1% rule.
- Cap rate 6.2% vs local median 3.7% in McAllen — top-decile yield for the area; either an underpriced asset or a hidden risk that comps aren't pricing in. Stress-test before assuming the spread holds.
Location & tenants
- Location reads 76/100 on livability (#119 in TX, #3,771 nationally) — a middle-class / working-renter tenant base. Strengths: cost of living A+, housing A+, health & safety A+; Watch: employment D, amenities F, commute F.
- Mcallen ISD (urban): math 34% / reading 45% proficiency, ranked #440 of 826 in TX (top 53%) — families likely to look elsewhere, expect single-tenant / working-renter base with shorter leases.
- Zoned schools: Dr Pablo Perez (math 52% / reading 57%, grade C, #621 of 4,322 statewide, top 15%, 560 students, 50% FRL); Morris Middle (math 59% / reading 61%, grade B, #158 of 1,662 statewide, top 10%, 1,016 students, 52% FRL); Mcallen H S (math 30% / reading 57%, grade F, #704 of 1,632 statewide, top 43%, 2,133 students, 63% FRL) — zoned schools at 55% FRL track the district average.
- Zoned-school proficiency averages 53% at this address vs 40% district-wide (+13 pts) — the actual schools serving this property are materially stronger than the Mcallen ISD average implies; a family-tenant draw the district grade alone would hide.
- Market conditions: Rents rising (+2.6%/yr); 898 active listings in the ZIP; 36 comparable units currently listed for rent nearby; rentals lingering (median 46d on market — plan ~5-8 weeks vacancy on turnover, expect pricing pressure); 53% of comp listings sitting > 30 days — soft ceiling on asking rent; solid renter incomes; 7,378 units permitted in Hidalgo County in 2024 (641 in 5+ unit buildings).
- This rent runs 34% of the median local income ($82k/yr) — at the standard rent-burdened threshold; future hikes will face affordability resistance.
Forward outlook
- Local home prices are declining (-3.0%/yr); year-one equity from $2k of loan paydown is wiped out by about $8k of value loss. Plan a longer hold.
- Hidalgo County population projected at +28% by 2050 — long-run rental-demand tailwind backs the buy-and-hold thesis.
Negotiation context
- It's been on market 24 days — a 2% lower offer ($255k) is reasonable based on typical stale-listing flexibility.
- 4 sale attempts since 13y ago; this cycle's ask is 13532% above the opening price — seller raised mid-cycle; expect resistance to lowballs.
Risks & watch-outs
- Climate carrying-cost: severe wind risk, 99% chance of damaging wind over 30y; extreme-heat days projected 7→23/yr by 2055 (HVAC capex compounding) — expect insurance premiums to compound above CPI over the hold.
Questions for the listing agent
- What do current leases actually rent for vs. the listed asking? Can we see a recent rent roll and the last 12 months of T-12 income?
- Is there a deadline driving the sale (1031 exchange, divorce, estate, relocation)? That informs how much negotiation room exists.
- Schools are B-rated — typically a magnet for longer-tenancy family renters. What's the average tenant stay here, and is there a school-zone premium baked into asking?
- The area grade is low — what's the realistic commute time and amenity access for the typical tenant pool here? Any planned neighborhood developments (good or bad) we should know about?
- What's the average days-on-market for RENTAL listings here right now (not sales)? A rising rental-DOM trend means longer vacancies and softer asking-rent achievability than the comps imply.
- What's the recent tenant-quality profile in this submarket — average credit score on applications, eviction rate, late-payment / NSF rate, and stable-employment percentage? A property-management company in the area should have these aggregated.
- How much new for-sale + rental construction is in the pipeline within 1–3 miles? Heavy new supply typically softens prices + rents 12–24 months out; constrained supply supports both.
Investment metrics
- 1% rule
- 0.91% ✗
- Cap rate
- 6.20%
- Cash-on-cash
- -0.32%
- DSCR
- 0.99
- GRM
- 9.2
CMA / ARV
- ARV (on-the-fly)
- $332,340
- Comps found
- 12
Show comp detail 12 sales within ~0.75 mi
| Address | Dist | Beds/Ba | Sqft | Sold | Price | $/sf | Match |
|---|---|---|---|---|---|---|---|
| 1804 Ozark Ave | 0.41mi | 3/2.5 | 1,872 (-2%) | 1mo | $325,000 | $174 | 75 |
| 2005 Queens Ave | 0.43mi | 3/2.5 | 1,846 (-3%) | 2mo | $285,000 | $154 | 70 |
| 9102 N 25th Ln | 0.41mi | 4/2.5 (+1) | 1,920 (+0%) | 4mo | $354,000 | $184 | 70 |
| 2020 Queens Ave | 0.46mi | 3/2.0 | 1,812 (-5%) | 1mo | $310,000 | $171 | 69 |
| 1821 Stanford Ave | 0.56mi | 3/2.0 | 1,869 (-2%) | 2mo | $280,000 | $150 | 69 |
| 2208 Providence Ave | 0.41mi | 3/2.5 | 1,804 (-6%) | 3mo | $289,000 | $160 | 68 |
| 9106 N 25th Ln | 0.42mi | 3/2.5 | 1,785 (-6%) | 1mo | $319,000 | $179 | 67 |
| 9119 N 25th St | 0.41mi | 3/2.5 | 1,768 (-7%) | 0mo | $315,000 | $178 | 66 |
| 9101 N 28th St | 0.64mi | 3/2.0 | 1,954 (+2%) | 1mo | $255,000 | $131 | 65 |
| 9114 N 25th St | 0.38mi | 3/2.0 | 1,715 (-10%) | 4mo | $330,000 | $192 | 62 |
| 2905 Northgate Ln | 0.73mi | 4/2.0 (+1) | 1,978 (+4%) | 4mo | $310,000 | $157 | 52 |
| 9904 N 24th St | 0.74mi | 3/2.5 | 2,012 (+5%) | 4mo | $422,500 | $210 | 51 |
Match score weights: distance 35% · size 25% · config 20% · recency 20%. Top-matched comps best support the ARV.
Projected returns pro-forma
-3.0% appreciation · 2.57% rent growth · sell at horizon
- IRR
- -17.3%
- Equity multiple
- 0.39×
- Total profit
- $-44,125
- Equity at exit
- $38,618
- IRR
- -10.1%
- Equity multiple
- 0.40×
- Total profit
- $-43,770
- Equity at exit
- $22,394
Cash invested: $72,520 (down + closing). Projections, not guarantees.
Landlord ↔ Tenant lean methodology
- Overall (STATE)
- 87 Strongly Landlord-Friendly
- State Texas
- 87 Strongly Landlord-Friendly · R+5
- County
- — inherits STATE
- City
- — inherits STATE
ZIP-level market 78504
- Home prices YoY
- -29.4%
- Rents YoY
- 2.6%
- Active inventory
- 898
- Price-to-rent
- 9.2×
Monthly cashflow live
- Estimated rent
- $2,347 high interval (Pro) →
- Mortgage (P&I)
- −$1,358
- Tax from tax record
- −$408 /mo · $4,891/yr
- Insurance
- −$108
- HOA
- −$0
- Vacancy / Maint / Mgmt
- −$493
- Net cashflow
- $-19
Break-even live
Sensitivity live
| Price | -10% $127 | -5% $54 | +0% $-19 | +5% $-93 | +10% $-166 |
|---|---|---|---|---|---|
| Rent | -10% $-205 | -5% $-112 | +0% $-19 | +5% $73 | +10% $166 |
| Rate | -1.0pp $111 | -0.5pp $47 | base $-19 | +0.5pp $-86 | +1.0pp $-155 |
UW: 25.0% down · 7.5% · 30yr · 1.5% tax · 5.0% vac · 8.0% maint · 8.0% mgmt
Financing live
Cash to close
- Down payment
- $64,750
- Closing costs
- $7,770
- Reserves months
- —
- Total cash needed
- —
Loan-product check · same deal, 3 products live
Conventional
25% down · 7.5% · 30yr
- Down + closing
- —
- Monthly P&I
- —
- Monthly cashflow
- —
- DSCR
- —
- Eligible?
- —
Personal DTI + credit; lowest rate.
DSCR
20% down · 8.5% · 30yr
- Down + closing
- —
- Monthly P&I
- —
- Monthly cashflow
- —
- DSCR
- —
- Eligible?
- —
No personal income docs; deal must DSCR.
Hard money
10% down · 12.0% · 12mo
- Down + closing
- —
- Monthly P&I
- —
- Monthly cashflow
- —
- DSCR
- —
- Eligible?
- —
Short-term bridge; refi at stabilization.
Rent comps 36 comps
| Address | Beds | Baths | Sqft | Rent | $/sqft | DOM | Units | Dist |
|---|---|---|---|---|---|---|---|---|
| 1800 Kingsborough Ave McAllen, TX | 3.0 | 2.0 | 2027 | $2,200 | $1.09 | 25d | 1 | 0.22mi |
| 8101 N 23rd St Unit 27 McAllen, TX | 3.0 | 2.5 | 1600 | $1,900 | $1.19 | 25d | 1 | 0.54mi |
| 8101 N 23rd St Unit 29 McAllen, TX | 3.0 | 2.5 | 1600 | $1,900 | $1.19 | 45d | 1 | 0.54mi |
| 9104 N 28th St McAllen, TX | 3.0 | 2.0 | 1747 | $1,900 | $1.09 | 16d | 1 | 0.61mi |
| 2613 Fairmont Ave McAllen, TX | 3.0 | 2.0 | 1735 | $2,000 | $1.15 | 45d | 1 | 0.63mi |
| 9806 N 24th Ln McAllen, TX | 4.0 | 3.5 | 2300 | $3,700 | $1.61 | 45d | 1 | 0.69mi |
| 2809 Grambling Ave McAllen, TX | 3.0 | 2.5 | 2152 | $2,500 | $1.16 | 45d | 1 | 0.69mi |
| 9807 N 24th Ln McAllen, TX | 4.0 | 3.5 | 2300 | $3,700 | $1.61 | 16d | 1 | 0.69mi |
| 9809 N 24th St McAllen, TX | 4.0 | 3.5 | 2300 | $4,500 | $1.96 | 45d | 1 | 0.69mi |
| 9805 N 24th St McAllen, TX | 4.0 | 3.5 | 2300 | $3,700 | $1.61 | 45d | 1 | 0.69mi |
| 1304 Providence Ave McAllen, TX | 3.0 | 2.5 | 2029 | $3,750 | $1.85 | 45d | 1 | 0.70mi |
| 9813 N 24th St McAllen, TX | 4.0 | 3.5 | 2300 | $3,700 | $1.61 | 45d | 1 | 0.70mi |
| 1205 Ozark Ave McAllen, TX | 3.0 | 3.0 | 1955 | $2,800 | $1.43 | 25d | 1 | 0.71mi |
| 7601 N 21st St McAllen, TX | 3.0 | 2.5 | 1888 | $2,600 | $1.38 | 45d | 1 | 0.76mi |
| 7504 N 21st St McAllen, TX | 3.0 | 2.0 | 1746 | $1,800 | $1.03 | 16d | 1 | 0.78mi |
| 2908 Providence Ave McAllen, TX | 3.0 | 2.5 | 1646 | $1,750 | $1.06 | 45d | 1 | 0.79mi |
| 2920 Providence Ave McAllen, TX | 3.0 | 2.5 | 1848 | $1,600 | $0.87 | 25d | 1 | 0.83mi |
| 3213 Princeton Ave McAllen, TX | 3.0 | 2.5 | 1868 | $1,850 | $0.99 | 16d | 1 | 0.96mi |
| 8406 N 33rd Ln McAllen, TX | 3.0 | 2.0 | 1448 | $2,000 | $1.38 | 16d | 1 | 1.00mi |
| 2629 Warbler Ave McAllen, TX | 3.0 | 2.5 | 1420 | $2,100 | $1.48 | 45d | 1 | 1.00mi |
| 10201 N 14th St McAllen, TX | 2.0 | 2.0 | 1249 | $2,300 | $1.84 | 45d | 1 | 1.01mi |
| 10221 N 15th St McAllen, TX | 3.0 | 2.0 | 1418 | $2,200 | $1.55 | 45d | 1 | 1.03mi |
| 10218 N 15th St McAllen, TX | 3.0 | 2.5 | 1768 | $3,150 | $1.78 | 45d | 1 | 1.04mi |
| 8330 N 34th Ln McAllen, TX | 2.0 | 3.0 | 1458 | $2,250 | $1.54 | 25d | 1 | 1.05mi |
| 10315 N 26th Ln McAllen, TX | 3.0 | 2.5 | 2124 | $2,300 | $1.08 | 16d | 1 | 1.07mi |
| 10338 N 23rd Ln McAllen, TX | 4.0 | 3.5 | 2563 | $2,700 | $1.05 | 46d | 1 | 1.07mi |
| 10321 N 15th St McAllen, TX | 3.0 | 2.0 | 1502 | $2,000 | $1.33 | 16d | 1 | 1.10mi |
| 10321 N 15th St McAllen, TX | 3.0 | 2.0 | 1502 | $2,200 | $1.46 | 45d | 1 | 1.10mi |
| 10333 N 15th St McAllen, TX | 3.0 | 2.0 | 1414 | $2,100 | $1.49 | 16d | 1 | 1.11mi |
| 2717 Umbrellabird Ave McAllen, TX | 3.0 | 2.0 | 1521 | $1,695 | $1.11 | 45d | 1 | 1.15mi |
| 4923 N 35th Ln McAllen, TX | 2.0–4.0 | 2.0–2.5 | 1373 | $2,062 | $1.50 | 16d | 11 | 1.16mi |
| 10328 N 13th St McAllen, TX | 3.0 | 2.0 | 1963 | $2,100 | $1.07 | 20d | 1 | 1.18mi |
| 7008 N 23rd St Unit 117 McAllen, TX | 2.0 | 2.0 | 1327 | $1,275 | $0.96 | 46d | 1 | 1.19mi |
| 1216 Quail Ave McAllen, TX | 3.0 | 2.0 | 1842 | $1,700 | $0.92 | 45d | 1 | 1.39mi |
| 3132 Zurich Ave McAllen, TX | 3.0 | 2.0 | 1400 | $1,900 | $1.36 | 20d | 1 | 1.42mi |
| 3601 Warbler Ave McAllen, TX | 3.0 | 2.0 | 1568 | $1,500 | $0.96 | 25d | 1 | 1.46mi |
Listing history 12 events
-
2026-04-18historical $1,900
-
2026-04-18status Pending
-
2026-04-18historical Option
-
2026-03-25$1,900
-
2026-03-24$259,000 Active
-
2022-10-10price $254,900
-
2022-09-04$259,900 Active
-
2018-06-05price $110,900 285-char remark
Show marketing remark (285 chars)
NICE & COZY 3bedroom 2bath with 2car garage, Nice layout design with comfortable size bedrooms that have carpet. House is located in highly sought location that is close to major shopping areas, schools and University, some repairs needed. Will NOT qualify for VA or FHA Financing.
-
2013-10-25soldstatus 285-char remark
Show marketing remark (285 chars)
NICE & COZY 3bedroom 2bath with 2car garage, Nice layout design with comfortable size bedrooms that have carpet. House is located in highly sought location that is close to major shopping areas, schools and University, some repairs needed. Will NOT qualify for VA or FHA Financing.
-
2013-08-30price $119,900 285-char remark
Show marketing remark (285 chars)
NICE & COZY 3bedroom 2bath with 2car garage, Nice layout design with comfortable size bedrooms that have carpet. House is located in highly sought location that is close to major shopping areas, schools and University, some repairs needed. Will NOT qualify for VA or FHA Financing.
-
2013-08-30historical 285-char remark
Show marketing remark (285 chars)
NICE & COZY 3bedroom 2bath with 2car garage, Nice layout design with comfortable size bedrooms that have carpet. House is located in highly sought location that is close to major shopping areas, schools and University, some repairs needed. Will NOT qualify for VA or FHA Financing.
-
2013-08-12$119,900 285-char remark
Show marketing remark (285 chars)
NICE & COZY 3bedroom 2bath with 2car garage, Nice layout design with comfortable size bedrooms that have carpet. House is located in highly sought location that is close to major shopping areas, schools and University, some repairs needed. Will NOT qualify for VA or FHA Financing.
ⓘ Source: listings_history table (triggers on properties + properties_extension) + one-shot
backfill from property_details.listing_events for pre-trigger history.
Tax reassessment forecast TX · Resets to sale price
- Current annual tax
- $4,891 · $408/mo
- Projected year-2 tax
- $4,891 · $408/mo
- Expected delta
- $0/yr ($0/mo · 0.0%)
ⓘ Screening estimate from a state-policy table — verify with the county assessor before closing.
Climate risk First Street
- Flood 1/10 Low FEMA zone X · 0% chance over 30 yrs
- Wildfire 4/10 Moderate
- Heat 9/10 Extreme 7 d/yr ≥111°F today · 23 d/yr by 30 yrs out
- Wind 8/10 Severe 99% chance of damaging wind over 30 yrs
- Air quality 2/10 Low 0 unhealthy d/yr today · 1 by 30 yrs out
Nearby sold comps map
Loading sold comps map…
Walkable amenities ~0.75 mi
Loading nearby amenities…
Taxation est. · year 1
- Rental income
- $28,168
- − Mortgage interest
- −$14,508
- − Property taxes
- −$4,891
- − Insurance
- −$1,295
- − Repairs & maintenance
- −$2,253
- − Management
- −$2,253
- − Depreciation
- −$7,535
- Taxable loss
- −$4,568
- Est. tax savings @ 24.0%
- +$1,096
- After-tax cash flow
- $864/yr
For passive investors: Depreciation is non-cash, so a rental often shows a tax loss while cash-flowing — sheltering income. Rental losses are passive: they offset passive income freely, and up to $25,000/yr can offset ordinary (W-2) income if you actively participate and your MAGI is under $100k (phasing out to $0 by $150k); unused losses carry forward. On sale, claimed depreciation is recaptured at up to 25%, and gains may owe capital-gains tax (a 1031 exchange can defer both). Figures are a year-1 estimate at your 24.0% rate — not tax advice; consult a CPA.
Schools (NCES district)
- District
- Mcallen ISD
- NCES district ID
- 4829670
- Math proficiency
- 34% ▼ -22.00%
- Reading proficiency
- 45% ▼ -5.00%
- Median HH income
- $40,805
- Composite
- 33.16/100
- National rank
- #5551
- State rank
- #440 of 826 in TX
Livability — McAllen
- Score
- 76/100
- State rank
- #119
- US rank
- #3771
Category grades
Schools grade is shown separately in the Schools card above.
Census & demographics
- Census place
- McAllen, TX
- County
- Hidalgo County · 623,128 people
- City population
- 144,650
- Metro
- McAllen-Edinburg-Mission, TX
- Population (ZIP)
- 63,094
- Household income
- $81,905
- Rent vs Own
- Severe rent burden
- 1468.0
Population outlook (Hidalgo County) Hauer SSP2
- Today (2025)
- 955,232 people
- By 2030
- 1,009,774 · +5.7%
- By 2040
- 1,120,332 · +17.3%
- By 2050
- 1,225,036 · +28.2%
- By 2075
- 1,439,189 · +50.7%
- By 2100
- 1,533,429 · +60.5%
Race, ethnicity, and origin ACS 2023
- Neighborhood character
- Predominantly Hispanic (82%)
- Race & ethnicity
- Hispanic / Latino 82% Two or more races 39% White 11% Asian 5%
- Hispanic origin (detail)
- Mexican 75%
- Common ancestry
- Lithuanian 1% Italian 1%
- Foreign-born
- 24% · Canada, South Korea, Vietnam
- Languages at home
- 34% English-only · Spanish 62% Other Asian/Pacific 1% Tagalog/Filipino 1%
Political lean MEDSL · Hidalgo
- 2024 margin
- Toss-up / Even · D 48.1% · R 51.0%
- 2008→2024 swing
- -41.6pp toward R · 2008: 38.7pp · 2024: -2.9pp
- All cycles
- 2024: R+2.9 2020: D+17.1 2016: D+40.5 2012: D+41.8 2008: D+38.7
Not yet ingested
- Civics
- —
Market trends
- HPI YoY
- ▼ -80.87%
- Current HPI
- 194.1764
- Rent YoY
- ▲ 2.57%
- Metro
- McAllen-Edinburg-Mission, TX
- State GDP YoY
- ▲ 3.95%
- F500 in state
- 110
Industry mix (Fortune 500 HQ in TX)
| Industry | F500 HQs | Revenue |
|---|---|---|
| Energy | 16 | $1,198B |
|
||
| Technology | 5 | $198B |
|
||
| Engineering / Construction | 4 | $72B |
|
||
| Energy Services | 3 | $60B |
|
||
| Utilities | 3 | $41B |
|
||
| Healthcare | 2 | $330B |
|
||
Price history
-98.4% since first listed12 events — show timeline
- 2026-04-18 Rental Removed $1,900 MCALLENMLS
- 2026-04-18 Pending — MCALLENMLS
- 2026-04-18 Contingent — MCALLENMLS
- 2026-03-25 Listed for Rent $1,900 MCALLENMLS
- 2026-03-24 Listed $259,000 MCALLENMLS
- 2022-10-10 Price Changed $254,900 MCALLENMLS
- 2022-09-04 Listed $259,900 MCALLENMLS
- 2018-06-05 Price Changed $110,900 MCALLENMLS
- 2013-10-25 Sold (MLS) — MCALLENMLS
- 2013-08-30 Delisted — MCALLENMLS
- 2013-08-30 Price Changed $119,900 MCALLENMLS
- 2013-08-12 Listed $119,900 MCALLENMLS
Property tax history
+3.0%/yrLatest (2025): $4,891 · +3.1% YoY. Source: county tax records.
Cash-flow waterfall
monthlySold comps — $/sqft
last 12 mo · ≤1 miLoading sold comps…