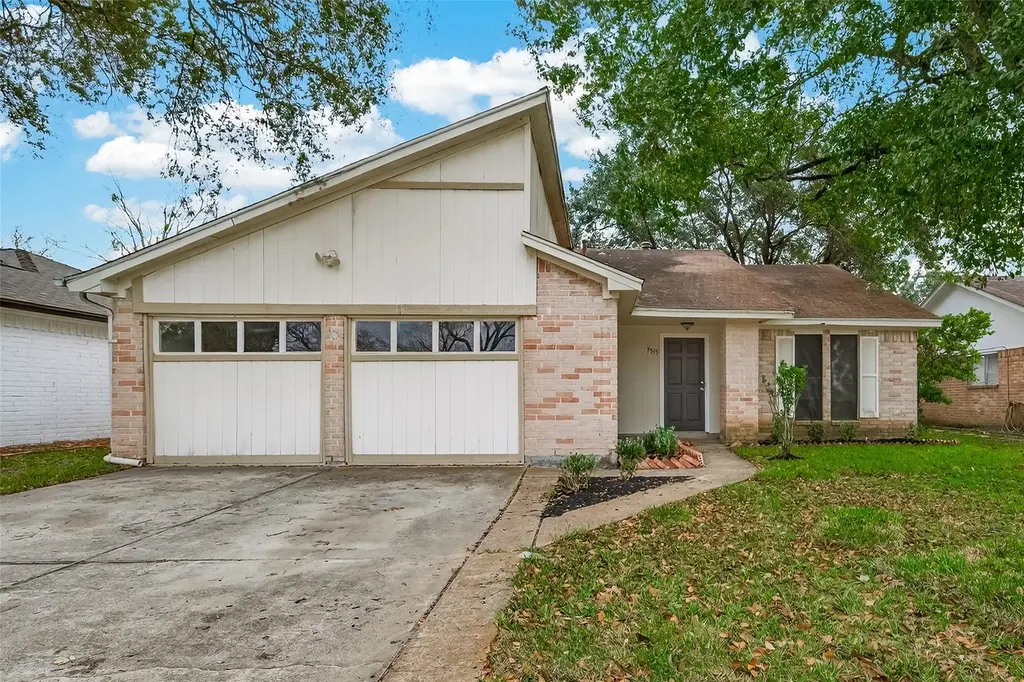
7515 Londres Dr · Mission Bend, TX
Flood risk 5/10 · Moderate
- FEMA flood zone
- X (unshaded)
- Chance of flooding over 30 yrs
- 0.33%
- Est. flood insurance / yr
- $507 – $1,088
Fire risk 3/10 · Minor
- Est. fire insurance / yr
- $1,222 – $2,270
Heat risk 9/10 · Severe
- Hot days now (above 110°F)
- 7 days/yr
- Hot days in 30 yrs
- 23 days/yr
Wind risk 9/10 · Severe
- Chance of severe wind over 30 yrs
- 99.0%
Air-quality risk 2/10 · Minimal
- Unhealthy air days now
- 1 days/yr
- Unhealthy air days in 30 yrs
- 2 days/yr
Risk factors via First Street. Map © Google.
Why this score? — see what drove the D+ grade
The composite is a weighted blend of 9 inputs, each scored 0–100. Each bar is that input's sub-score; the figure is the points it added to the 100-point composite (weight × sub-score).
- Cash flow +13.5/30.0
- ARV discount +11.0/15.0
- Schools +4.5/10.0
- 1% rule +4.1/10.0
- DSCR +4.1/10.0
- Livability +3.2/5.0
- Rent growth +3.0/5.0
- Condition / age +2.5/5.0
- Appreciation +0.0/10.0
$210,000
🖨 Deal sheet (PDF) 📄 Offer letter ✓ Due diligence
Listing remarks
Welcome to this inviting home in the established Mission Bend community. Where affordability, comfort and functionality come together beautifully. The seller just got the foundation done, the roof fixed and the whole outside painted. Basically the heavy lifting and major cost related items were taken care off. Now this home waits for a buyer to puts its own finishing and unique touches inside. The home is close to major roads like Hwy 1464 and tollway 1093. You r minutes away from Katy or Sugarland. Basically this home is perfectly located for an amazing price. If you r looking for a starter home or an investment inside the city. You cannot beat this opportunity. Come and see the possibili
Key facts
- Roof fixed
- Foundation done
- Close to major roads
Tags
Property features AI
Finance
- HOA & community: Part of Mission Bend South association; Trail(s) on community grounds; Community pool; Association fee $476 annually (includes common areas)
Exterior
- Parking: Attached garage; Converted garage; Driveway
- Security: Smoke detectors
- Utilities: Public water; Public sewer
- Home design: Residential property; Faces west; Built in 1981; Slab foundation
- Construction: Brick and wood siding construction; Composition roof
- Exterior features: Deck; Patio; Fully fenced yard; Subdivision lot; Concrete road access
Interior
- Kitchen: Dishwasher; Electric oven; Electric range; Garbage disposal; Refrigerator
- Flooring: Tile flooring
- Bathrooms: 2 full bathrooms
- Heating & cooling: Central heating (gas); Central air conditioning (electric)
- Interior features: Wet bar; Breakfast bar; Kitchen open to family room; Tub with shower; 1 fireplace; 9 total rooms
- Laundry & utility: Washer hookup; Electric dryer hookup; Gas dryer hookup
Neighborhood map
What this means for you Summary
Snapshot
- This is a 3-bed/3.0-bath single-family listed at $210k.
Deal economics
- At list price, monthly cash flow is $6 ($72/yr) — positive.
- The deal already cash-flows at list — no discount required.
- To meet the 1% rule (rent ≥ 1% of price), the offer needs to be $192k (8.7% below list).
- Recommended offer: $192k (8.7% below list) — sets the bar for 1% rule.
- Cap rate 6.3% vs local median 4.2% in Mission Bend — top-decile yield for the area; either an underpriced asset or a hidden risk that comps aren't pricing in. Stress-test before assuming the spread holds.
Location & tenants
- Location reads 65/100 on livability (#715 in TX) — a middle-class / working-renter tenant base. Strengths: cost of living A+, housing A+; Watch: crime D-, amenities F, commute F.
- Fort Bend ISD (suburban): math 44% / reading 53% proficiency, ranked #140 of 826 in TX (top 17%) — families likely to look elsewhere, expect single-tenant / working-renter base with shorter leases.
- Zoned schools: Mission Bend El (math 17% / reading 27%, grade F, #3,333 of 4,322 statewide, top 80%, 315 students, 88% FRL); Hodges Bend Middle (math 15% / reading 33%, grade F, #1,301 of 1,662 statewide, top 79%, 849 students, 81% FRL); Alief Isd J J A E P (13 students, 77% FRL) — zoned schools average 82% FRL vs 35% district-wide (47 pts higher); higher-poverty schools than district average — tighter screening recommended.
- Zoned-school proficiency averages 23% at this address vs 48% district-wide (-26 pts) — the specific schools serving this property underperform the Fort Bend ISD average; the district grade overstates school quality for this exact location.
- Market conditions: Rents rising (+1.9%/yr); 263 active listings in the ZIP; 15 comparable units currently listed for rent nearby; rentals leasing fast (median 7d on market — plan ~1-2 weeks tenant-placement turnaround); 12,093 units permitted in Fort Bend County in 2024 (815 in 5+ unit buildings).
- This rent runs 36% of the median local income ($64k/yr) — at the standard rent-burdened threshold; future hikes will face affordability resistance.
Forward outlook
- Local home prices are declining (-3.0%/yr); year-one equity from $1k of loan paydown is wiped out by about $6k of value loss. Plan a longer hold.
- Fort Bend County population projected at +75% by 2050 — long-run rental-demand tailwind backs the buy-and-hold thesis.
Negotiation context
- Only 13 days on market — expect competitive offers; lowballing is unlikely to land.
- 3 sale attempts since 22y ago with the ask held roughly flat each time — persistent listings suggest the price (not the market) is what's stuck; bring a comps-based counter.
Risks & watch-outs
- Climate carrying-cost: moderate flood risk; severe wind risk, 99% chance of damaging wind over 30y; extreme-heat days projected 7→23/yr by 2055 (HVAC capex compounding) — expect insurance premiums to compound above CPI over the hold.
Questions for the listing agent
- What does the HOA fee cover, when was the last increase, and are there any pending special assessments or reserve-fund shortfalls?
- Is there a deadline driving the sale (1031 exchange, divorce, estate, relocation)? That informs how much negotiation room exists.
- Schools are D-rated, which usually means shorter tenancies and higher turnover. Who's the typical renter profile here, and what's been the actual vacancy rate?
- Crime grade is D in this area — have there been break-ins, vandalism, or insurance claims at this property in the last 3 years? What carrier currently insures it and at what premium?
- The area grade is low — what's the realistic commute time and amenity access for the typical tenant pool here? Any planned neighborhood developments (good or bad) we should know about?
- What's the average days-on-market for RENTAL listings here right now (not sales)? A rising rental-DOM trend means longer vacancies and softer asking-rent achievability than the comps imply.
- What's the recent tenant-quality profile in this submarket — average credit score on applications, eviction rate, late-payment / NSF rate, and stable-employment percentage? A property-management company in the area should have these aggregated.
- How much new for-sale + rental construction is in the pipeline within 1–3 miles? Heavy new supply typically softens prices + rents 12–24 months out; constrained supply supports both.
Investment metrics
- 1% rule
- 0.91% ✗
- Cap rate
- 6.33%
- Cash-on-cash
- 0.12%
- DSCR
- 1.01
- GRM
- 9.1
CMA / ARV
- ARV (on-the-fly)
- $227,744
- Comps found
- 12
Show comp detail 12 sales within ~0.75 mi
| Address | Dist | Beds/Ba | Sqft | Sold | Price | $/sf | Match |
|---|---|---|---|---|---|---|---|
| 7423 Londres Dr | 0.05mi | 3/2.0 | 1,294 (0%) | 5mo | $224,999 | $174 | 90 |
| 7523 La Place Dr | 0.17mi | 3/2.5 | 1,200 (-7%) | 5mo | $159,000 | $133 | 74 |
| 7334 Tetela Dr | 0.37mi | 3/2.0 | 1,244 (-4%) | 0mo | $249,999 | $201 | 72 |
| 7411 Trabajo Dr | 0.23mi | 3/2.5 | 1,200 (-7%) | 8mo | $165,000 | $138 | 69 |
| 7627 Tierra Verde Dr | 0.24mi | 3/2.0 | 1,156 (-11%) | 8mo | $228,000 | $197 | 61 |
| 7530 Tierra Verde Dr | 0.28mi | 3/2.0 | 1,148 (-11%) | 5mo | $200,000 | $174 | 60 |
| 7215 Caracas Dr | 0.30mi | 3/2.0 | 1,111 (-14%) | 1mo | $220,000 | $198 | 58 |
| 16350 Villaret Dr | 0.73mi | 3/2.0 | 1,275 (-2%) | 8mo | $224,000 | $176 | 53 |
| 6822 Zapata Dr | 0.74mi | 4/2.0 (+1) | 1,295 (+0%) | 6mo | $225,000 | $174 | 51 |
| 6806 San Pablo Dr | 0.66mi | 3/2.0 | 1,228 (-5%) | 7mo | $235,000 | $191 | 51 |
| 8126 Soledad Dr | 0.52mi | 3/2.5 | 1,144 (-12%) | 6mo | $215,000 | $188 | 50 |
| 16331 Paso Hondo Dr | 0.70mi | 3/2.0 | 1,372 (+6%) | 5mo | $199,900 | $146 | 49 |
Match score weights: distance 35% · size 25% · config 20% · recency 20%. Top-matched comps best support the ARV.
Projected returns pro-forma
-3.0% appreciation · 1.89% rent growth · sell at horizon
- IRR
- -17.4%
- Equity multiple
- 0.39×
- Total profit
- $-35,701
- Equity at exit
- $31,312
- IRR
- -11.6%
- Equity multiple
- 0.34×
- Total profit
- $-38,834
- Equity at exit
- $18,157
Cash invested: $58,800 (down + closing). Projections, not guarantees.
Landlord ↔ Tenant lean methodology
- Overall (STATE)
- 87 Strongly Landlord-Friendly
- State Texas
- 87 Strongly Landlord-Friendly · R+5
- County
- — inherits STATE
- City
- — inherits STATE
ZIP-level market 77083
- Home prices YoY
- -19.3%
- Rents YoY
- 1.9%
- Active inventory
- 263
- Price-to-rent
- 9.1×
Monthly cashflow live
- Estimated rent
- $1,918 high interval (Pro) →
- Mortgage (P&I)
- −$1,101
- Tax from tax record
- −$280 /mo · $3,361/yr
- Insurance
- −$88
- HOA
- −$40
- Vacancy / Maint / Mgmt
- −$403
- Net cashflow
- $6
Break-even live
Sensitivity live
| Price | -10% $125 | -5% $65 | +0% $6 | +5% $-53 | +10% $-113 |
|---|---|---|---|---|---|
| Rent | -10% $-145 | -5% $-70 | +0% $6 | +5% $82 | +10% $157 |
| Rate | -1.0pp $112 | -0.5pp $59 | base $6 | +0.5pp $-48 | +1.0pp $-104 |
UW: 25.0% down · 7.5% · 30yr · 1.5% tax · 5.0% vac · 8.0% maint · 8.0% mgmt
Financing live
Cash to close
- Down payment
- $52,500
- Closing costs
- $6,300
- Reserves months
- —
- Total cash needed
- —
Loan-product check · same deal, 3 products live
Conventional
25% down · 7.5% · 30yr
- Down + closing
- —
- Monthly P&I
- —
- Monthly cashflow
- —
- DSCR
- —
- Eligible?
- —
Personal DTI + credit; lowest rate.
DSCR
20% down · 8.5% · 30yr
- Down + closing
- —
- Monthly P&I
- —
- Monthly cashflow
- —
- DSCR
- —
- Eligible?
- —
No personal income docs; deal must DSCR.
Hard money
10% down · 12.0% · 12mo
- Down + closing
- —
- Monthly P&I
- —
- Monthly cashflow
- —
- DSCR
- —
- Eligible?
- —
Short-term bridge; refi at stabilization.
Rent comps 15 comps
| Address | Beds | Baths | Sqft | Rent | $/sqft | DOM | Units | Dist |
|---|---|---|---|---|---|---|---|---|
| 7506 Tetela Dr Houston, TX | 3.0 | 2.0 | 1270 | $1,856 | $1.46 | 14d | 1 | 0.23mi |
| 7223 Londres Dr Houston, TX | 3.0 | 1.5 | 1076 | $1,720 | $1.60 | 45d | 1 | 0.28mi |
| 6822 Santa Rita Dr Houston, TX | 3.0 | 2.0 | 1301 | $1,510 | $1.16 | 26d | 1 | 0.65mi |
| 16126 Barbarossa Dr Houston, TX | 3.0 | 2.0 | 1104 | $1,719 | $1.56 | 4d | 1 | 0.68mi |
| 16311 Paso Hondo Dr Houston, TX | 3.0 | 2.5 | 1449 | $1,683 | $1.16 | 0d | 1 | 0.73mi |
| 16131 April Ridge Dr Houston, TX | 3.0 | 2.0 | 1782 | $2,000 | $1.12 | 45d | 1 | 0.81mi |
| 8811 FM 1464 Rd Richmond, TX | 1.0–2.0 | 1.0–2.0 | 971 | $2,145 | $2.21 | 0d | 32 | 0.92mi |
| 16717 Westpark Dr Houston, TX | 1.0–3.0 | 1.0–2.0 | 1042 | $2,335 | $2.24 | 4d | 38 | 0.95mi |
| 17000 Bissonnet St Richmond, TX | 1.0–2.0 | 1.0–2.0 | 950 | $1,899 | $2.00 | 0d | 41 | 1.11mi |
| 15770 Bellaire Blvd Houston, TX | 1.0–3.0 | 1.0–2.0 | 938 | $1,680 | $1.79 | 13d | 1 | 1.13mi |
| 8325 Addicks Clodine Rd Houston, TX | 1.0–2.0 | 1.0–2.0 | 940 | $1,975 | $2.10 | 13d | 18 | 1.19mi |
| 8325 Addicks Clodine Rd Unit 421 Houston, TX | 2.0 | 2.0 | 1080 | $1,815 | $1.68 | 7d | 1 | 1.19mi |
| 8325 Addicks Clodine Rd Unit 8362 Houston, TX | 2.0 | 2.0 | 1080 | $1,799 | $1.67 | 0d | 1 | 1.19mi |
| 15511 Evergreen Grove Dr Houston, TX | 3.0 | 2.0 | 1634 | $1,786 | $1.09 | 7d | 1 | 1.31mi |
| 16170 Westpark Dr Houston, TX | 2.0 | 2.0 | 895 | $1,236 | $1.38 | 5d | 3 | 1.36mi |
HOA detail
- Monthly dues
- $40 · $480/yr
Listing history 11 events
-
2026-06-07statusdays on market $210,000 Pending 13 DOM
-
2026-06-04days on market $210,000 Active 12 DOM
-
2026-06-03days on market $210,000 Active 11 DOM
-
2026-06-02days on market $210,000 Active 10 DOM
-
2026-06-01days on market $210,000 Active 9 DOM
-
2026-05-31days on market $210,000 Active 8 DOM
-
2026-05-23$210,000 Active
-
2026-04-22historical
-
2026-02-27$210,000 Active
-
2004-07-30historical
-
2004-06-24$105,000
ⓘ Source: listings_history table (triggers on properties + properties_extension) + one-shot
backfill from property_details.listing_events for pre-trigger history.
Tax reassessment forecast TX · Resets to sale price
- Current annual tax
- $3,361 · $280/mo
- Projected year-2 tax
- $3,843 · $320/mo
- Expected delta
- +$482/yr (+$40/mo · 14.4%)
ⓘ Screening estimate from a state-policy table — verify with the county assessor before closing.
Climate risk First Street
- Flood 5/10 Major FEMA zone X (unshaded) · 33% chance over 30 yrs
- Wildfire 3/10 Moderate
- Heat 9/10 Extreme 7 d/yr ≥110°F today · 23 d/yr by 30 yrs out
- Wind 9/10 Extreme 99% chance of damaging wind over 30 yrs
- Air quality 2/10 Low 1 unhealthy d/yr today · 2 by 30 yrs out
Nearby sold comps map
Loading sold comps map…
Walkable amenities ~0.75 mi
Loading nearby amenities…
Taxation est. · year 1
- Rental income
- $23,010
- − Mortgage interest
- −$11,763
- − Property taxes
- −$3,361
- − Insurance
- −$1,050
- − Repairs & maintenance
- −$1,841
- − Management
- −$1,841
- − HOA
- −$480
- − Depreciation
- −$6,109
- Taxable loss
- −$3,435
- Est. tax savings @ 24.0%
- +$824
- After-tax cash flow
- $896/yr
For passive investors: Depreciation is non-cash, so a rental often shows a tax loss while cash-flowing — sheltering income. Rental losses are passive: they offset passive income freely, and up to $25,000/yr can offset ordinary (W-2) income if you actively participate and your MAGI is under $100k (phasing out to $0 by $150k); unused losses carry forward. On sale, claimed depreciation is recaptured at up to 25%, and gains may owe capital-gains tax (a 1031 exchange can defer both). Figures are a year-1 estimate at your 24.0% rate — not tax advice; consult a CPA.
Schools (NCES district)
- District
- Fort Bend ISD
- NCES district ID
- 4819650
- Math proficiency
- 44% ▼ -15.00%
- Reading proficiency
- 53% ▼ -4.00%
- Median HH income
- $82,360
- Composite
- 44.61/100
- National rank
- #2779
- State rank
- #140 of 826 in TX
Livability — Mission Bend
- Score
- 65/100
- State rank
- #715
- US rank
- #13356
Category grades
Schools grade is shown separately in the Schools card above.
Census & demographics
- Census place
- Mission Bend, TX
- County
- Harris County · 4,702,590 people
- City population
- 74,843
- Metro
- Houston-The Woodlands-Sugar Land, TX
- Population (ZIP)
- 73,230
- Household income
- $64,418
- Rent vs Own
- Severe rent burden
- 2410.0
Population outlook (Fort Bend County) Hauer SSP2
- Today (2025)
- 1,004,526 people
- By 2030
- 1,153,104 · +14.8%
- By 2040
- 1,453,718 · +44.7%
- By 2050
- 1,753,781 · +74.6%
- By 2075
- 2,455,772 · +144.5%
- By 2100
- 2,930,528 · +191.7%
Race, ethnicity, and origin ACS 2023
- Neighborhood character
- Highly diverse neighborhood (Simpson 0.72)
- Race & ethnicity
- Hispanic / Latino 35% Black 30% Asian 23% Two or more races 14% White 8%
- Hispanic origin (detail)
- Mexican 16% Puerto Rican 1% Cuban 1%
- Foreign-born
- 47% · Canada, Vietnam, China
- Languages at home
- 38% English-only · Spanish 29% Vietnamese 11% Other Indo-European 6%
Political lean MEDSL · Fort Bend
- 2024 margin
- Toss-up / Even · D 49.5% · R 47.9% · Other 2.6%
- 2008→2024 swing
- +4.0pp toward D · 2008: -2.4pp · 2024: 1.6pp
- All cycles
- 2024: D+1.6 2020: D+10.6 2016: D+6.6 2012: R+6.8 2008: R+2.4
Not yet ingested
- Civics
- —
Market trends
- HPI YoY
- ▼ -65.00%
- Current HPI
- 271.2157
- Rent YoY
- ▲ 1.89%
- Metro
- Houston-The Woodlands-Sugar Land, TX
- State GDP YoY
- ▲ 3.95%
- F500 in state
- 110
Industry mix (Fortune 500 HQ in TX)
| Industry | F500 HQs | Revenue |
|---|---|---|
| Energy | 16 | $1,198B |
|
||
| Technology | 5 | $198B |
|
||
| Engineering / Construction | 4 | $72B |
|
||
| Energy Services | 3 | $60B |
|
||
| Utilities | 3 | $41B |
|
||
| Healthcare | 2 | $330B |
|
||
Price history
+100.0% since first listed5 events — show timeline
- 2026-05-23 Listed $210,000 HARMLS
- 2026-04-22 Listing Removed — HARMLS
- 2026-02-27 Listed $210,000 HARMLS
- 2004-07-30 Listing Removed — HARMLS
- 2004-06-24 Listed $105,000 HARMLS
Property tax history
+2.5%/yrLatest (2025): $3,361 · -5.2% YoY. Source: county tax records.
Cash-flow waterfall
monthlySold comps — $/sqft
last 12 mo · ≤1 miLoading sold comps…