 🏷️ Likely Rental
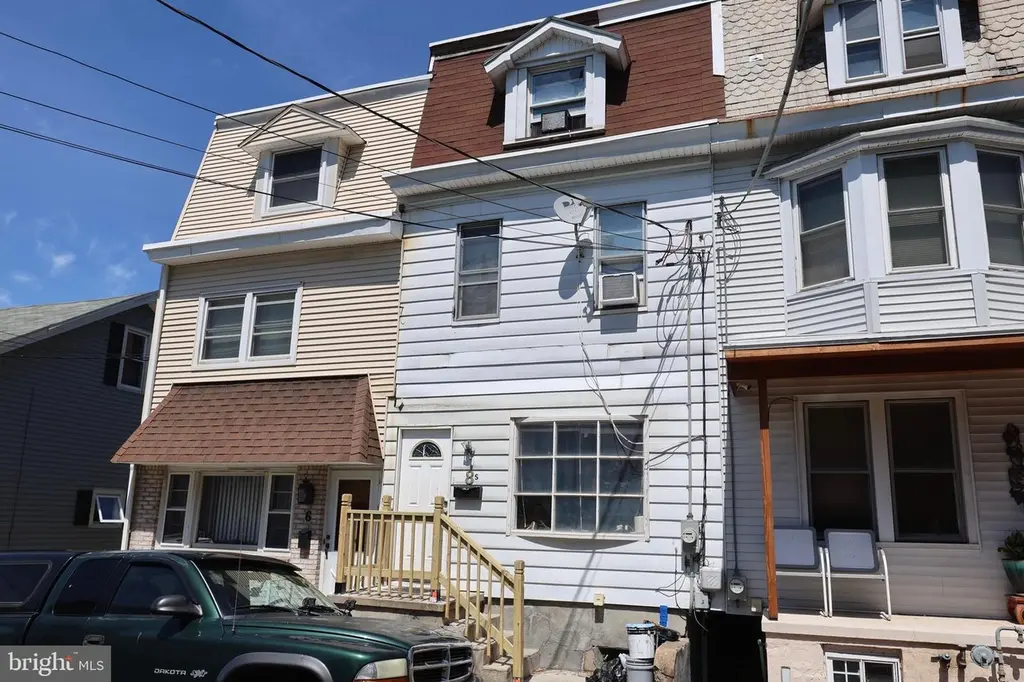
8 S 19th St · Pottsville, PA
Flood risk 1/10 · Minimal
- FEMA flood zone
- X (unshaded)
- Chance of flooding over 30 yrs
- 0.0%
- Est. flood insurance / yr
- $473 – $860
Fire risk 3/10 · Minor
- Est. fire insurance / yr
- $511 – $949
Heat risk 4/10 · Minor
- Hot days now (above 96°F)
- 7 days/yr
- Hot days in 30 yrs
- 16 days/yr
Wind risk 4/10 · Minor
- Chance of severe wind over 30 yrs
- 8.0%
Air-quality risk 2/10 · Minimal
- Unhealthy air days now
- 1 days/yr
- Unhealthy air days in 30 yrs
- 1 days/yr
Risk factors via First Street. Map © Google.
Why this score? — see what drove the B grade
The composite is a weighted blend of 9 inputs, each scored 0–100. Each bar is that input's sub-score; the figure is the points it added to the 100-point composite (weight × sub-score).
- Cash flow +30.0/30.0
- 1% rule +10.0/10.0
- DSCR +10.0/10.0
- ARV discount +7.5/15.0
- Rent growth +3.9/5.0
- Livability +3.8/5.0
- Schools +3.1/10.0
- Condition / age +2.5/5.0
- Appreciation +0.0/10.0
$83,900
🖨 Deal sheet 📄 Offer letter ✓ Due diligence
Listing remarks
4 Bedroom, 1 Bathroom Investment Home in Pottsville, PA. Tenant Occupied. $1300 per month rent. . Landlord pays sewer & trash. Tenant pays gas, water & electric. Add to your investment portfolio. .. Call today for information!
Key facts
- Built 1910
- Listed 7 days
Property features AI
Exterior
- Parking: On-street parking
- Utilities: Public water; Public sewer
- Home design: Interior townhouse/rowhouse; Fee simple ownership; Year built estimated
- Construction: Aluminum siding; Permanent foundation; Above grade and below grade structures
- Exterior features: Lot dimensions approximately 15 x 100
Interior
- Bedrooms: Four bedrooms on the main level
- Bathrooms: One full bathroom on the main level; One full bathroom total
- Heating & cooling: Baseboard hot water heating; Natural gas fuel; Electric hot water
- Interior features: Estimated living area; Basement present (other type)
Neighborhood map
What this means for you Summary
Snapshot
- This is a 2-bed/1.0-bath single-family listed at $84k.
Deal economics
- At list price, monthly cash flow is $471 ($6k/yr) — positive.
- The deal already cash-flows at list — no discount required.
- Meets the 1% rule at list price ($1k rent vs $84k).
- Cap rate 13.0% vs local median 6.1% in Pottsville — top-decile yield for the area; either an underpriced asset or a hidden risk that comps aren't pricing in. Stress-test before assuming the spread holds.
Location & tenants
- Location reads 75/100 on livability (#442 in PA, #4,025 nationally) — a middle-class / working-renter tenant base. Strengths: amenities A+, cost of living A+, housing A+; Watch: commute F, employment F.
- Pottsville Area SD (town): math 29% / reading 46% proficiency, ranked #395 of 539 in PA (top 73%) — families likely to look elsewhere, expect single-tenant / working-renter base with shorter leases.
- Market conditions: Rents rising fast (+5.7%/yr); 177 active listings in the ZIP; 7 comparable units currently listed for rent nearby; rentals lingering (median 44d on market — plan ~5-8 weeks vacancy on turnover, expect pricing pressure); 100% of comp listings sitting > 30 days — soft ceiling on asking rent; 169 units permitted in Schuylkill County in 2024 (0 in 5+ unit buildings).
Forward outlook
- Local home prices are declining (-3.0%/yr); year-one equity from $580 of loan paydown is wiped out by about $3k of value loss. Plan a longer hold.
- Schuylkill County population projected at -16% by 2050 — secular population decline; favor cash flow + early exit over multi-decade hold.
- At projected returns (-3.0% appreciation + 5.7% rent growth), your $23k cash investment doubles in ~5 years — after that, you're playing with house money.
Negotiation context
- Only 8 days on market — expect competitive offers; lowballing is unlikely to land.
- 2 sale attempts with the ask held roughly flat each time — persistent listings suggest the price (not the market) is what's stuck; bring a comps-based counter.
- Current owner paid $65k; 29% above their basis — modest negotiation headroom, anchor on the comps not their cost.
Risks & watch-outs
- Watch-outs: built in 1910 — expect roof / HVAC / electrical / plumbing capex.
Questions for the listing agent
- Built in 1910 — when were the roof, HVAC, electrical panel, plumbing, and water heater last replaced?
- Is there a deadline driving the sale (1031 exchange, divorce, estate, relocation)? That informs how much negotiation room exists.
- Schools are B-rated — typically a magnet for longer-tenancy family renters. What's the average tenant stay here, and is there a school-zone premium baked into asking?
- What's the average days-on-market for RENTAL listings here right now (not sales)? A rising rental-DOM trend means longer vacancies and softer asking-rent achievability than the comps imply.
- What's the recent tenant-quality profile in this submarket — average credit score on applications, eviction rate, late-payment / NSF rate, and stable-employment percentage? A property-management company in the area should have these aggregated.
- How much new for-sale + rental construction is in the pipeline within 1–3 miles? Heavy new supply typically softens prices + rents 12–24 months out; constrained supply supports both.
Investment metrics
- 1% rule
- 1.59% ✓
- Cap rate
- 13.04%
- Cash-on-cash
- 24.08%
- DSCR
- 2.07
- GRM
- 5.3
CMA / ARV
- ARV (on-the-fly)
- $207,592
- Comps found
- 10
Show comp detail 10 sales within ~0.75 mi
| Address | Dist | Beds/Ba | Sqft | Sold | Price | $/sf | Match |
|---|---|---|---|---|---|---|---|
| 1507 W Market St | 0.36mi | 3/1.0 (+1) | 1,260 (-6%) | 6mo | $194,000 | $154 | 63 |
| 103 N 16th St | 0.27mi | 3/1.0 (+1) | 1,264 (-6%) | 11mo | $130,500 | $103 | 63 |
| 1900 3rd Ave | 0.27mi | 2/2.0 | 1,522 (+13%) | 0mo | $185,000 | $122 | 61 |
| 1414 Mt Hope Ave | 0.70mi | 2/1.0 | 1,240 (-8%) | 7mo | $80,000 | $65 | 48 |
| 2137 S Woodglen Rd | 0.70mi | 3/0.5 (+1) | 1,439 (+7%) | 3mo | $276,000 | $192 | 46 |
| 1401 Mount Hope Ave | 0.72mi | 2/1.0 | 1,478 (+10%) | 9mo | $175,000 | $118 | 43 |
| 144 Mahantongo Dr | 0.66mi | 3/1.5 (+1) | 1,506 (+12%) | 2mo | $249,900 | $166 | 41 |
| 1342 Mount Hope Ave | 0.75mi | 3/1.0 (+1) | 1,412 (+5%) | 17mo | $135,000 | $96 | 38 |
| 110 Mahantongo Dr | 0.64mi | 3/1.0 (+1) | 1,151 (-15%) | 8mo | $259,000 | $225 | 34 |
| 2279 Mahantongo St | 0.71mi | 3/1.5 (+1) | 1,168 (-13%) | 11mo | $274,000 | $235 | 29 |
Match score weights: distance 35% · size 25% · config 20% · recency 20%. Top-matched comps best support the ARV.
Projected returns pro-forma
-3.0% appreciation · 5.7% rent growth · sell at horizon
- IRR
- 20.4%
- Equity multiple
- 1.86×
- Total profit
- $20,162
- Equity at exit
- $12,510
- IRR
- 30.3%
- Equity multiple
- 4.08×
- Total profit
- $72,401
- Equity at exit
- $7,254
Cash invested: $23,492 (down + closing). Projections, not guarantees.
Landlord ↔ Tenant lean methodology
- Overall (STATE)
- 62 Landlord-Friendly
- State Pennsylvania
- 62 Landlord-Friendly · EVEN
- County
- — inherits STATE
- City
- — inherits STATE
ZIP-level market 17901
- Home prices YoY
- -21.2%
- Rents YoY
- 5.7%
- Active inventory
- 177
- Price-to-rent
- 5.3×
Monthly cashflow live
- Estimated rent
- $1,331 high interval (Pro) →
- Mortgage (P&I)
- −$440
- Tax est. 1.5%
- −$105 /mo · $1,258/yr
- Insurance
- −$35
- HOA
- −$0
- Vacancy / Maint / Mgmt
- −$279
- Net cashflow
- $471
Break-even live
UW: 25.0% down · 7.5% · 30yr · 1.5% tax · 5.0% vac · 8.0% maint · 8.0% mgmt
Financing live
Cash to close
- Down payment
- $20,975
- Closing costs
- $2,517
- Reserves months
- —
- Total cash needed
- —
Loan-product check · same deal, 3 products live
Conventional
25% down · 7.5% · 30yr
- Down + closing
- —
- Monthly P&I
- —
- Monthly cashflow
- —
- DSCR
- —
- Eligible?
- —
Personal DTI + credit; lowest rate.
DSCR
20% down · 8.5% · 30yr
- Down + closing
- —
- Monthly P&I
- —
- Monthly cashflow
- —
- DSCR
- —
- Eligible?
- —
No personal income docs; deal must DSCR.
Hard money
10% down · 12.0% · 12mo
- Down + closing
- —
- Monthly P&I
- —
- Monthly cashflow
- —
- DSCR
- —
- Eligible?
- —
Short-term bridge; refi at stabilization.
Rent comps 7 comps
| Address | Beds | Baths | Sqft | Rent | $/sqft | DOM | Units | Dist |
|---|---|---|---|---|---|---|---|---|
| 2063 King Ave Pottsville, PA | 3.0 | 2.5 | 1656 | $1,600 | $0.97 | 43d | 1 | 0.39mi |
| 119 S 11th St Pottsville, PA | 3.0 | 1.5 | 1140 | $1,450 | $1.27 | 43d | 1 | 0.75mi |
| 909 Mahantongo St Unit 1 Pottsville, PA | 2.0 | 1.0 | 1100 | $1,200 | $1.09 | 43d | 1 | 0.82mi |
| 631 W Race St Pottsville, PA | 3.0 | 1.0 | 1340 | $1,200 | $0.90 | 43d | 1 | 0.91mi |
| 210 Harrison St Pottsville, PA | 3.0 | 1.0 | 1078 | $1,200 | $1.11 | 43d | 1 | 1.22mi |
| 612 N 2nd St Pottsville, PA | 2.0 | 1.0 | 1742 | $1,295 | $0.74 | 43d | 1 | 1.25mi |
| 426 Adams St Pottsville, PA | 3.0 | 1.0 | 1104 | $1,350 | $1.22 | 43d | 1 | 1.47mi |
Listing history 8 events
-
2026-06-19days on market $83,900 Active 8 DOM
-
2026-06-18days on market $83,900 Active 7 DOM
-
2026-06-17days on market $83,900 Active 6 DOM
-
2026-06-16days on market $83,900 Active 5 DOM
-
2026-06-15days on market $83,900 Active 4 DOM
-
2026-06-14days on market $83,900 Active 2 DOM
-
2026-06-12remarks 230-char remark
-
2026-06-12$83,900 Active 1 DOM
ⓘ Source: listings_history table (triggers on properties + properties_extension) + one-shot
backfill from property_details.listing_events for pre-trigger history.
Climate risk First Street
- Flood 1/10 Low FEMA zone X (unshaded) · 0% chance over 30 yrs
- Wildfire 3/10 Moderate
- Heat 4/10 Moderate 7 d/yr ≥96°F today · 16 d/yr by 30 yrs out
- Wind 4/10 Moderate 8% chance of damaging wind over 30 yrs
- Air quality 2/10 Low 1 unhealthy d/yr today · 1 by 30 yrs out
Nearby sold comps map
Loading sold comps map…
Walkable amenities ~0.75 mi
Loading nearby amenities…
Taxation est. · year 1
- Rental income
- $15,968
- − Mortgage interest
- −$4,700
- − Property taxes
- −$1,258
- − Insurance
- −$420
- − Repairs & maintenance
- −$1,277
- − Management
- −$1,277
- − Depreciation
- −$2,441
- Taxable income
- $4,595
- Est. tax owed @ 24.0%
- −$1,103
- After-tax cash flow
- $4,554/yr
For passive investors: Depreciation is non-cash, so a rental often shows a tax loss while cash-flowing — sheltering income. Rental losses are passive: they offset passive income freely, and up to $25,000/yr can offset ordinary (W-2) income if you actively participate and your MAGI is under $100k (phasing out to $0 by $150k); unused losses carry forward. On sale, claimed depreciation is recaptured at up to 25%, and gains may owe capital-gains tax (a 1031 exchange can defer both). Figures are a year-1 estimate at your 24.0% rate — not tax advice; consult a CPA.
Schools (NCES district)
- District
- Pottsville Area SD
- NCES district ID
- 4219710
- Math proficiency
- 29% ▼ -14.00%
- Reading proficiency
- 46% ▼ -12.00%
- Median HH income
- $39,157
- Composite
- 31.32/100
- National rank
- #6002
- State rank
- #395 of 539 in PA
Livability — Pottsville
- Score
- 75/100
- State rank
- #442
- US rank
- #4025
Category grades
Schools grade is shown separately in the Schools card above.
Census & demographics
- Census place
- Pottsville, PA
- County
- Schuylkill County · 22,371 people
- City population
- 22,371
- Metro
- Pottsville, PA
- Population (ZIP)
- 22,371
- Household income
- $62,484
- Rent vs Own
- Severe rent burden
- 622.0
Population outlook (Schuylkill County) Hauer SSP2
- Today (2025)
- 137,447 people
- By 2030
- 133,121 · -3.1%
- By 2040
- 124,172 · -9.7%
- By 2050
- 115,611 · -15.9%
- By 2075
- 100,796 · -26.7%
- By 2100
- 86,667 · -36.9%
Race, ethnicity, and origin ACS 2023
- Neighborhood character
- Predominantly White (90%)
- Race & ethnicity
- White 90% Hispanic / Latino 5% Two or more races 3% Black 2%
- Common ancestry
- Romanian 9% Iranian 5% Subsaharan African 3%
- Foreign-born
- 1% · Canada
- Languages at home
- 96% English-only · Spanish 2% German/W. Germanic 1% French/Haitian/Cajun 1%
Political lean MEDSL · Schuylkill
- 2024 margin
- Solid R (+42.1) · D 28.5% · R 70.6%
- 2008→2024 swing
- -33.4pp toward R · 2008: -8.7pp · 2024: -42.1pp
- All cycles
- 2024: R+42.1 2020: R+39.9 2016: R+43.4 2012: R+13.4 2008: R+8.7
Not yet ingested
- Civics
- —
Market trends
- HPI YoY
- ▼ -54.14%
- Current HPI
- 200.6516
- Rent YoY
- ▲ 5.70%
- Metro
- Pottsville, PA
- State GDP YoY
- ▲ 1.68%
- F500 in state
- 34
Industry mix (Fortune 500 HQ in PA)
| Industry | F500 HQs | Revenue |
|---|---|---|
| Healthcare | 2 | $309B |
|
||
| Insurance | 2 | $27B |
|
||
| Telecommunications / Media | 1 | $124B |
|
||
| Industrial Distribution | 1 | $22B |
|
||
| Financial Services | 1 | $20B |
|
||
| Chemicals / Materials | 1 | $18B |
|
||
Price history
+29.1% since first listed5 events — show timeline
- 2026-06-11 Listed $83,900 BRIGHT MLS
- 2025-09-04 Listing Removed — BRIGHT MLS
- 2025-07-30 Price Changed $99,000 BRIGHT MLS
- 2025-07-18 Listed $109,000 BRIGHT MLS
- 2024-06-04 Sold (Public Records) $65,000 Public Records
Property tax history
+9.0%/yrLatest (2026): $4,231 · +637.1% YoY. Source: county tax records.
Cash-flow waterfall
monthlySold comps — $/sqft
last 12 mo · ≤1 miLoading sold comps…