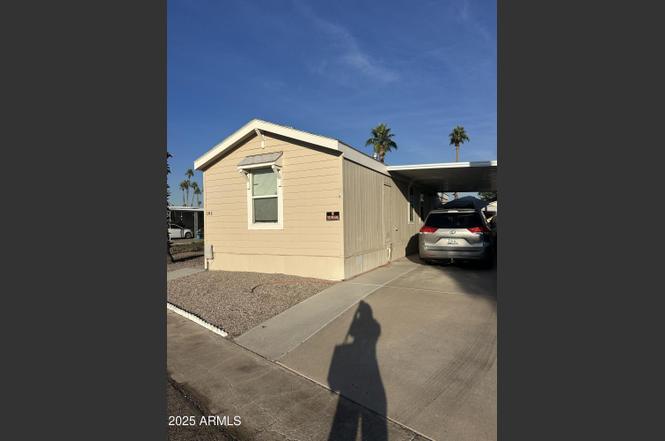
7300 N 51st Ave Unit E191 · Glendale, AZ
Flood risk 1/10 · Minimal
- FEMA flood zone
- X (shaded)
- Chance of flooding over 30 yrs
- 0.0%
- Est. flood insurance / yr
- $507 – $1,088
Fire risk 1/10 · Minimal
- Est. fire insurance / yr
- $610 – $1,132
Heat risk 9/10 · Severe
- Hot days now (above 112°F)
- 6 days/yr
- Hot days in 30 yrs
- 17 days/yr
Wind risk 1/10 · Minimal
- Chance of severe wind over 30 yrs
- —
Air-quality risk 2/10 · Minimal
- Unhealthy air days now
- 0 days/yr
- Unhealthy air days in 30 yrs
- 1 days/yr
Risk factors via First Street. Map © Google.
Why this score? — see what drove the B- grade
The composite is a weighted blend of 9 inputs, each scored 0–100. Each bar is that input's sub-score; the figure is the points it added to the 100-point composite (weight × sub-score).
- Cash flow +30.0/30.0
- 1% rule +10.0/10.0
- DSCR +10.0/10.0
- ARV discount +7.5/15.0
- Livability +3.8/5.0
- Condition / age +2.5/5.0
- Schools +2.3/10.0
- Rent growth +1.8/5.0
- Appreciation +0.0/10.0
$79,000
🖨 Deal sheet 📄 Offer letter ✓ Due diligence
Listing remarks
Get ready to level up your lifestyle at 7300 N 51st Ave - a standout home in a vibrant 55+ active adult community built for people who love to stay moving, stay social, and stay strong. Storage shed included! From the moment you walk in, you'll feel the fresh, open energy of this home. The bright living space flows effortlessly, giving you room to stretch, breathe, and actually live. The kitchen has the space and functionality to keep you fueled- whether you're meal-prepping for the week or blending up your post-walk protein shake. If you want a home that matches your energy and supports your active, health-focused lifestyle, this is the one that's going to feel like a win. Let's get you i
Key facts
- Bright living space
- Storage shed
- 3 parking spots
Tags
Property features AI
Finance
- Other: Community coin-op laundry
- HOA & community: No association fees; Land-lease community with $750 monthly land lease
Exterior
- Parking: 2 open parking spaces; 1 covered space; 1 carport space
- Utilities: City water; Public sewer
- Home design: Manufactured/mobile home; Leasehold ownership
- Construction: Vertical siding; Panelized construction; Other roof type
- Exterior features: Gravel/stone front and back; No fencing; Community spa; Community media room; Fitness center
Interior
- Kitchen: Built-in microwave; Refrigerator; Dishwasher; Garbage disposal; Laminate counters
- Bedrooms: 2 possible bedrooms
- Flooring: Carpet; Vinyl
- Bathrooms: 2 full bathrooms
- Heating & cooling: Natural gas heating; Central air conditioning; Ceiling fans; Programmable thermostat
- Interior features: Full bath in primary bedroom; Dual-pane windows; Laminate counters
- Laundry & utility: Coin-operated laundry available in community
Neighborhood map
What this means for you Summary
Snapshot
- This is a 2-bed/2.0-bath manufactured listed at $79k.
Deal economics
- At list price, monthly cash flow is $416 ($5k/yr) — positive.
- The deal already cash-flows at list — no discount required.
- Meets the 1% rule at list price ($1k rent vs $79k).
- Recommended offer: $70k (12.0% below list) — sets the bar for market timing.
- Cap rate 12.6% vs local median 3.5% in Glendale — top-decile yield for the area; either an underpriced asset or a hidden risk that comps aren't pricing in. Stress-test before assuming the spread holds.
Location & tenants
- Location reads 76/100 on livability (#12 in AZ, #3,235 nationally) — a middle-class / working-renter tenant base. Strengths: commute A+, housing A+, amenities B; Watch: health & safety D+, crime F.
- Glendale Union High School District (4285) (urban): math 23% / reading 31% proficiency, ranked #130 of 249 in AZ (top 52%) — low school quality limits family demand, transient renter base, plan for 1-2y turnover.
- Zoned schools: Glendale High School (math 13% / reading 22%, grade F, #245 of 381 statewide, top 65%, 1,816 students, 76% FRL).
- Market conditions: Rents soft (-3.0%/yr); 215 active listings in the ZIP; 40 comparable units currently listed for rent nearby; rentals leasing fast (median 2d on market — plan ~1-2 weeks tenant-placement turnaround); 36,011 units permitted in Maricopa County in 2024 (12,801 in 5+ unit buildings).
Forward outlook
- Local home prices are declining (-3.0%/yr); year-one equity from $546 of loan paydown is wiped out by about $2k of value loss. Plan a longer hold.
- Maricopa County population projected at +38% by 2050 — long-run rental-demand tailwind backs the buy-and-hold thesis.
- At projected returns (-3.0% appreciation + 0.0% rent growth), your $22k cash investment doubles in ~7 years — after that, you're playing with house money.
Negotiation context
- It's been on market 199 days — a 12% lower offer ($70k) is reasonable based on typical stale-listing flexibility.
Risks & watch-outs
- Climate carrying-cost: extreme-heat days projected 6→17/yr by 2055 (HVAC capex compounding) — expect insurance premiums to compound above CPI over the hold.
Questions for the listing agent
- It's been on market 199 days. Have you received any prior offers? Is the seller open to a 12% concession, seller financing, or rate buy-down credit?
- Why hasn't it sold? Are there any deal-killer items the seller is aware of (foundation, flood, title, zoning, code violations)?
- Is there a deadline driving the sale (1031 exchange, divorce, estate, relocation)? That informs how much negotiation room exists.
- Crime grade is F in this area — have there been break-ins, vandalism, or insurance claims at this property in the last 3 years? What carrier currently insures it and at what premium?
- What's the average days-on-market for RENTAL listings here right now (not sales)? A rising rental-DOM trend means longer vacancies and softer asking-rent achievability than the comps imply.
- What's the recent tenant-quality profile in this submarket — average credit score on applications, eviction rate, late-payment / NSF rate, and stable-employment percentage? A property-management company in the area should have these aggregated.
- How much new for-sale + rental construction is in the pipeline within 1–3 miles? Heavy new supply typically softens prices + rents 12–24 months out; constrained supply supports both.
Investment metrics
- 1% rule
- 1.54% ✓
- Cap rate
- 12.61%
- Cash-on-cash
- 22.57%
- DSCR
- 2.00
- GRM
- 5.4
CMA / ARV
- ARV (on-the-fly)
- $29,568
- Comps found
- 7
Show comp detail 7 sales within ~0.75 mi
| Address | Dist | Beds/Ba | Sqft | Sold | Price | $/sf | Match |
|---|---|---|---|---|---|---|---|
| 7300 N 51st Ave Unit G102 | 0.10mi | 2/2.0 | 896 (0%) | 9mo | $52,000 | $58 | 88 |
| 7300 N 51st Ave Unit E81 | 0.10mi | 2/2.0 | 960 (+7%) | 19mo | $31,400 | $33 | 68 |
| 7300 N 51st Ave #97 | 0.10mi | 2/2.0 | 960 (+7%) | 22mo | $70,000 | $73 | 66 |
| 7300 N 51st Ave | 0.06mi | 2/2.0 | 812 (-9%) | 21mo | $42,000 | $52 | 64 |
| 7300 N 51st Ave Unit D212 | 0.08mi | 1/1.0 (-1) | 774 (-14%) | 9mo | $25,000 | $32 | 57 |
| 7300 N 51st Ave Ave Unit F177 | 0.10mi | 2/2.0 | 768 (-14%) | 19mo | $12,000 | $16 | 56 |
| 4800 W Ocotillo Rd #89 | 0.75mi | 2/2.0 | 1,000 (+12%) | 3mo | $32,000 | $32 | 43 |
Match score weights: distance 35% · size 25% · config 20% · recency 20%. Top-matched comps best support the ARV.
Projected returns pro-forma
-3.0% appreciation · 0.0% rent growth · sell at horizon
- IRR
- 12.0%
- Equity multiple
- 1.46×
- Total profit
- $10,142
- Equity at exit
- $11,779
- IRR
- 18.4%
- Equity multiple
- 2.32×
- Total profit
- $29,231
- Equity at exit
- $6,830
Cash invested: $22,120 (down + closing). Projections, not guarantees.
Landlord ↔ Tenant lean methodology
- Overall (STATE)
- 87 Strongly Landlord-Friendly
- State Arizona
- 87 Strongly Landlord-Friendly · R+3
- County
- — inherits STATE
- City
- — inherits STATE
ZIP-level market 85301
- Home prices YoY
- -10.6%
- Rents YoY
- -3.0%
- Active inventory
- 215
- Price-to-rent
- 5.4×
Monthly cashflow live
- Estimated rent
- $1,218 high interval (Pro) →
- Mortgage (P&I)
- −$414
- Tax est. 1.5%
- −$99 /mo · $1,185/yr
- Insurance
- −$33
- HOA
- −$0
- Vacancy / Maint / Mgmt
- −$256
- Net cashflow
- $416
Break-even live
UW: 25.0% down · 7.5% · 30yr · 1.5% tax · 5.0% vac · 8.0% maint · 8.0% mgmt
Financing live
Cash to close
- Down payment
- $19,750
- Closing costs
- $2,370
- Reserves months
- —
- Total cash needed
- —
Loan-product check · same deal, 3 products live
Conventional
25% down · 7.5% · 30yr
- Down + closing
- —
- Monthly P&I
- —
- Monthly cashflow
- —
- DSCR
- —
- Eligible?
- —
Personal DTI + credit; lowest rate.
DSCR
20% down · 8.5% · 30yr
- Down + closing
- —
- Monthly P&I
- —
- Monthly cashflow
- —
- DSCR
- —
- Eligible?
- —
No personal income docs; deal must DSCR.
Hard money
10% down · 12.0% · 12mo
- Down + closing
- —
- Monthly P&I
- —
- Monthly cashflow
- —
- DSCR
- —
- Eligible?
- —
Short-term bridge; refi at stabilization.
Rent comps 40 comps
| Address | Beds | Baths | Sqft | Rent | $/sqft | DOM | Units | Dist |
|---|---|---|---|---|---|---|---|---|
| 7300 N 51st Ave Unit 2 Glendale, AZ | 1.0 | 1.0 | 774 | $1,000 | $1.29 | 1d | 1 | 0.02mi |
| 7151 N 53rd Ave Unit 3 Glendale, AZ | 2.0 | 1.0 | 625 | $1,400 | $2.24 | 1d | 1 | 0.18mi |
| 7160 N 53rd Ave Unit 2 Glendale, AZ | 2.0 | 1.0 | 625 | $925 | $1.48 | 1d | 1 | 0.20mi |
| 7211 N 54th Ave Apt 4 Glendale, AZ | 2.0 | 2.0 | 1000 | $1,450 | $1.45 | 1d | 1 | 0.23mi |
| 5136 W Glenn Dr Glendale, AZ | 2.0–3.0 | 1.5 | 1090 | $1,475 | $1.35 | 1d | 5 | 0.25mi |
| 7107 N 53rd Ave Apt 10 Glendale, AZ | 1.0 | 1.0 | 649 | $925 | $1.43 | 1d | 1 | 0.28mi |
| 7107 N 53rd Ave Unit 5 Glendale, AZ | 2.0 | 1.0 | 750 | $1,000 | $1.33 | 1d | 1 | 0.28mi |
| 4937 W Myrtle Ave Glendale, AZ | 1.0–2.0 | 1.0–2.0 | 752 | $1,225 | $1.63 | 1d | 12 | 0.35mi |
| 7235 N 55th Ave Glendale, AZ | 1.0 | 1.0 | 631 | $925 | $1.47 | 1d | 1 | 0.36mi |
| 4919 W Glenn Dr Glendale, AZ | 2.0 | 1.0 | 936 | $995 | $1.06 | 1d | 1 | 0.45mi |
| 5547 W Gardenia Ave Glendale, AZ | 3.0 | 1.0 | 1084 | $1,329 | $1.23 | 22d | 1 | 0.49mi |
| 7711 N 51st Ave Glendale, AZ | 2.0 | 1.0 | 590 | $1,445 | $2.45 | 1d | 67 | 0.50mi |
| 4828 W Orangewood Ave Glendale, AZ | 1.0 | 1.0 | 875 | $1,395 | $1.59 | 1d | 1 | 0.56mi |
| 6717 N 53rd Ave Glendale, AZ | 3.0 | 1.0 | 864 | $1,900 | $2.20 | 1d | 1 | 0.58mi |
| 5623 W Myrtle Ave Unit 105 Glendale, AZ | 2.0 | 1.0 | 700 | $1,195 | $1.71 | 1d | 1 | 0.59mi |
| 5206 W Ocotillo Rd Unit A Glendale, AZ | 2.0 | 1.0 | 750 | $1,350 | $1.80 | 1d | 1 | 0.61mi |
| 4949 W Northern Ave Glendale, AZ | 2.0 | 1.0–2.0 | 632 | $1,445 | $2.29 | 1d | 14 | 0.65mi |
| 6738 N 55th Ave Unit 4 Glendale, AZ | 1.0 | 1.0 | 800 | $650 | $0.81 | 2d | 1 | 0.66mi |
| 7153 N 57th Dr Unit 3 Glendale, AZ | 1.0 | 1.0 | 607 | $925 | $1.52 | 1d | 1 | 0.66mi |
| 8080 N 51st Ave Glendale, AZ | 1.0–2.0 | 1.0–2.0 | 702 | $1,575 | $2.24 | 1d | 11 | 0.73mi |
| 5012 W McLellan Rd Glendale, AZ | 3.0 | 2.0 | 1058 | $1,595 | $1.51 | 18d | 1 | 0.79mi |
| 5044 W Maryland Ave Glendale, AZ | 3.0 | 1.0 | 1065 | $1,295 | $1.22 | 3d | 1 | 0.88mi |
| 4730 W Northern Ave Glendale, AZ | 1.0 | 1.0 | 770 | $995 | $1.29 | 1d | 1 | 0.88mi |
| 4748 W Sierra Vista Dr Glendale, AZ | 2.0 | 2.0 | 875 | $1,185 | $1.35 | 4d | 1 | 0.90mi |
| 4748 W Sierra Vista Dr Glendale, AZ | 2.0 | 2.0 | 875 | $1,262 | $1.44 | 22d | 1 | 0.90mi |
| 5908 W Myrtle Ave Unit 5908 Glendale, AZ | 3.0 | 2.0 | 1053 | $1,375 | $1.31 | 1d | 1 | 0.90mi |
| 4730 W Northern Ave Glendale, AZ | 1.0 | 1.0 | 624 | $1,170 | $1.87 | 8d | 2 | 0.92mi |
| 4730 W Northern Ave Glendale, AZ | 1.0 | 1.0 | 624 | $1,120 | $1.79 | 1d | 2 | 0.92mi |
| 4730 W Northern Ave Glendale, AZ | 1.0–2.0 | 1.0–2.0 | 841 | $1,200 | $1.43 | 24d | 2 | 0.92mi |
| 6551 N 49th Ave Glendale, AZ | 2.0–3.0 | 2.0 | 1165 | $1,875 | $1.61 | 1d | 6 | 0.92mi |
| 4748 W Sierra Vista Dr Unit A1 Glendale, AZ | 1.0 | 1.0 | 650 | $910 | $1.40 | 1d | 1 | 0.92mi |
| 4748 W Sierra Vista Dr Unit B1 Glendale, AZ | 2.0 | 2.0 | 875 | $1,170 | $1.34 | 1d | 1 | 0.92mi |
| 6550 N 47th Ave Phoenix, AZ | 2.0 | 2.0 | 1044 | $1,400 | $1.34 | 1d | 1 | 0.99mi |
| 4443 W Palmaire Ave Glendale, AZ | 2.0–3.0 | 2.0 | 987 | $1,595 | $1.62 | 1d | 1 | 1.01mi |
| 4439 W Palmaire Ave Unit 249 Glendale, AZ | 2.0 | 2.0 | 872 | $1,495 | $1.71 | 22d | 1 | 1.01mi |
| 4439 W Palmaire Ave Glendale, AZ | 2.0–3.0 | 2.0 | 933 | $1,495 | $1.60 | 1d | 5 | 1.01mi |
| 4439 W Palmaire Ave Unit 103 Glendale, AZ | 2.0 | 2.0 | 872 | $1,495 | $1.71 | 8d | 1 | 1.01mi |
| 4439 W Palmaire Ave Unit 236 Glendale, AZ | 3.0 | 2.0 | 1101 | $1,695 | $1.54 | 24d | 1 | 1.01mi |
| 4439 W Palmaire Ave Unit 101 Glendale, AZ | 2.0 | 2.0 | 872 | $1,495 | $1.71 | 17d | 1 | 1.02mi |
| 4439 W Palmaire Ave Unit 245 Glendale, AZ | 3.0 | 2.0 | 995 | $1,695 | $1.70 | 4d | 1 | 1.02mi |
Listing history 15 events
-
2026-06-18days on market $79,000 Active 199 DOM
-
2026-06-17days on market $79,000 Active 198 DOM
-
2026-06-16days on market $79,000 Active 197 DOM
-
2026-06-15days on market $79,000 Active 196 DOM
-
2026-06-13days on market $79,000 Active 194 DOM
-
2026-06-13days on market $79,000 Active 193 DOM
-
2026-06-09days on market $79,000 Active 190 DOM
-
2026-06-08days on market $79,000 Active 189 DOM
-
2026-06-07days on market $79,000 Active 188 DOM
-
2026-06-04days on market $79,000 Active 185 DOM
-
2026-06-03days on market $79,000 Active 184 DOM
-
2026-06-02days on market $79,000 Active 183 DOM
-
2026-06-01days on market $79,000 Active 182 DOM
-
2026-05-31days on market $79,000 Active 181 DOM
-
2025-11-25$79,000 Active
ⓘ Source: listings_history table (triggers on properties + properties_extension) + one-shot
backfill from property_details.listing_events for pre-trigger history.
Climate risk First Street
- Flood 1/10 Low FEMA zone X (shaded) · 0% chance over 30 yrs
- Wildfire 1/10 Low
- Heat 9/10 Extreme 6 d/yr ≥112°F today · 17 d/yr by 30 yrs out
- Wind 1/10 Low
- Air quality 2/10 Low 0 unhealthy d/yr today · 1 by 30 yrs out
Nearby sold comps map
Loading sold comps map…
Walkable amenities ~0.75 mi
Loading nearby amenities…
Taxation est. · year 1
- Rental income
- $14,612
- − Mortgage interest
- −$4,425
- − Property taxes
- −$1,185
- − Insurance
- −$395
- − Repairs & maintenance
- −$1,169
- − Management
- −$1,169
- − Depreciation
- −$2,298
- Taxable income
- $3,970
- Est. tax owed @ 24.0%
- −$953
- After-tax cash flow
- $4,039/yr
For passive investors: Depreciation is non-cash, so a rental often shows a tax loss while cash-flowing — sheltering income. Rental losses are passive: they offset passive income freely, and up to $25,000/yr can offset ordinary (W-2) income if you actively participate and your MAGI is under $100k (phasing out to $0 by $150k); unused losses carry forward. On sale, claimed depreciation is recaptured at up to 25%, and gains may owe capital-gains tax (a 1031 exchange can defer both). Figures are a year-1 estimate at your 24.0% rate — not tax advice; consult a CPA.
Schools (NCES district)
- District
- Glendale Union High School District (4285)
- NCES district ID
- 0403450
- Math proficiency
- 23% ▼ -38.00%
- Reading proficiency
- 31% ▼ -19.00%
- Median HH income
- $40,846
- Composite
- 22.81/100
- National rank
- #8020
- State rank
- #130 of 249 in AZ
Livability — Glendale
- Score
- 76/100
- State rank
- #12
- US rank
- #3235
Category grades
Schools grade is shown separately in the Schools card above.
Census & demographics
- Census place
- Glendale, AZ
- County
- Maricopa County · 4,537,380 people
- City population
- 294,586
- Metro
- Phoenix-Mesa-Chandler, AZ
- Population (ZIP)
- 68,178
- Household income
- $53,827
- Rent vs Own
- Severe rent burden
- 3741.0
Population outlook (Maricopa County) Hauer SSP2
- Today (2025)
- 4,979,203 people
- By 2030
- 5,378,229 · +8.0%
- By 2040
- 6,156,598 · +23.6%
- By 2050
- 6,872,376 · +38.0%
- By 2075
- 8,401,270 · +68.7%
- By 2100
- 9,247,439 · +85.7%
Race, ethnicity, and origin ACS 2023
- Neighborhood character
- Majority Hispanic (63%)
- Race & ethnicity
- Hispanic / Latino 63% Two or more races 37% White 22% Black 8% Asian 2% Native American 2%
- Hispanic origin (detail)
- Mexican 57% Cuban 1%
- Common ancestry
- Slovak 1% Italian 1%
- Foreign-born
- 26% · Canada, Vietnam, Philippines
- Languages at home
- 46% English-only · Spanish 48% Arabic 1% Other Indo-European 1%
Political lean MEDSL · Maricopa
- 2024 margin
- Toss-up / Even · D 47.7% · R 51.2% · Other 1.1%
- 2008→2024 swing
- +7.1pp toward D · 2008: -10.6pp · 2024: -3.5pp
- All cycles
- 2024: R+3.5 2020: D+2.2 2016: R+3.5 2012: R+12.0 2008: R+10.6
Not yet ingested
- Civics
- —
Market trends
- HPI YoY
- ▼ -50.49%
- Current HPI
- 427.3069
- Rent YoY
- ▼ -2.98%
- Metro
- Phoenix-Mesa-Chandler, AZ
- State GDP YoY
- ▲ 4.54%
- F500 in state
- 20
Industry mix (Fortune 500 HQ in AZ)
| Industry | F500 HQs | Revenue |
|---|---|---|
| Technology | 2 | $13B |
|
||
| Mining / Metals | 1 | $23B |
|
||
| Environmental Services | 1 | $16B |
|
||
| Metals / Steel | 1 | $14B |
|
||
| Technology Distribution | 1 | $9B |
|
||
| Homebuilding | 1 | $8B |
|
||
Price history
1 event — show timeline
- 2025-11-25 Listed $79,000 ARMLS
Cash-flow waterfall
monthlySold comps — $/sqft
last 12 mo · ≤1 miLoading sold comps…