2200 Lancaster Dr SE Unit 18D · Salem, OR
Flood risk 1/10 · Minimal
- FEMA flood zone
- X
- Chance of flooding over 30 yrs
- 0.0%
- Est. flood insurance / yr
- $435 – $905
Fire risk 1/10 · Minimal
- Est. fire insurance / yr
- $498 – $926
Heat risk 4/10 · Minor
- Hot days now (above threshold)
- 7 days/yr
- Hot days in 30 yrs
- 15 days/yr
Wind risk No data
- Chance of severe wind over 30 yrs
- —
Air-quality risk No data
- Unhealthy air days now
- —
- Unhealthy air days in 30 yrs
- —
Risk factors via First Street. Map © Google.
Why this score? — see what drove the D+ grade
The composite is a weighted blend of 9 inputs, each scored 0–100. Each bar is that input's sub-score; the figure is the points it added to the 100-point composite (weight × sub-score).
- Cash flow +15.9/30.0
- ARV discount +7.5/15.0
- DSCR +4.9/10.0
- 1% rule +4.4/10.0
- Livability +4.0/5.0
- Condition / age +4.0/5.0
- Schools +3.7/10.0
- Rent growth +3.2/5.0
- Appreciation +0.0/10.0
$159,900
🖨 Deal sheet (PDF) 📄 Offer letter ✓ Due diligence
Listing remarks MLS
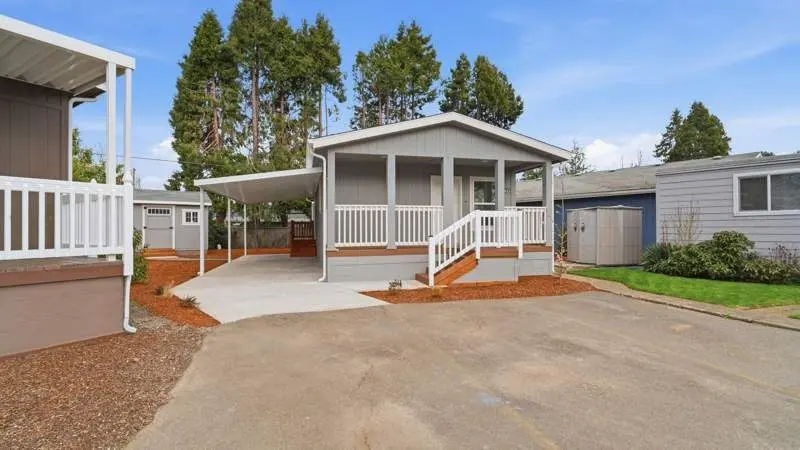
Step into easy, modern living with this beautifully crafted 2024 Clayton Homes home, offering 800 sq. ft. of thoughtfully designed space in Salem. Featuring 2 spacious bedrooms and 2 full bathrooms, including a private primary suite with en suite bath, this home delivers the perfect blend of comfort and convenience. The open-concept layout creates a bright, welcoming atmosphere, seamlessly connecting the living room to a stylish kitchen equipped with stainless steel appliances-perfect for everyday living or entertaining. With electric utilities and washer/dryer hookups, every detail is designed to make life simple and efficient. Step outside to enjoy your covered porch-an ideal spot for morning coffee or evening relaxation-plus an asphalt driveway for easy access and parking. Located in the sought-after Sundial 55+ lifestyle community, you'll enjoy a peaceful setting, friendly neighbors, and a true sense of belonging. Just minutes from local shopping, dining, and recreation, Sundial offers the perfect balance of tranquility and convenience.
Key facts
- Covered porch
- Asphalt driveway
- Stylish kitchen
Tags
Neighborhood map
What this means for you Summary
Snapshot
- This is a 2-bed/2.0-bath manufactured listed at $160k. Condition is rated good.
Deal economics
- At list price, monthly cash flow is $76 ($918/yr) — positive.
- The deal already cash-flows at list — no discount required.
- To meet the 1% rule (rent ≥ 1% of price), the offer needs to be $150k (6.5% below list).
- Recommended offer: $150k (6.5% below list) — sets the bar for 1% rule.
- Cap rate 6.9% vs local median 2.9% in Salem — top-decile yield for the area; either an underpriced asset or a hidden risk that comps aren't pricing in. Stress-test before assuming the spread holds.
Location & tenants
- Location reads 79/100 on livability (#59 in OR, #2,084 nationally) — a middle-class / working-renter tenant base. Strengths: amenities A+, commute A+, housing A+; Watch: schools D, crime F.
- Salem-Keizer SD 24J (urban): math 34% / reading 47% proficiency, ranked #103 of 183 in OR (top 56%) — families likely to look elsewhere, expect single-tenant / working-renter base with shorter leases.
- Market conditions: Rents rising (+2.6%/yr); 135 active listings in the ZIP; 20 comparable units currently listed for rent nearby; rentals at typical pace (median 15d on market — plan ~3-4 weeks tenant-placement turnaround); solid renter incomes; 1,591 units permitted in Marion County in 2024 (716 in 5+ unit buildings).
Forward outlook
- Local home prices are declining (-3.0%/yr); year-one equity from $1k of loan paydown is wiped out by about $5k of value loss. Plan a longer hold.
- Marion County population projected at +17% by 2050 — long-run rental-demand tailwind backs the buy-and-hold thesis.
Negotiation context
- It's been on market 54 days — a 3% lower offer ($155k) is reasonable based on typical stale-listing flexibility.
Questions for the listing agent
- It's been on market 54 days. Have you received any prior offers? Is the seller open to a 6% concession, seller financing, or rate buy-down credit?
- Is there a deadline driving the sale (1031 exchange, divorce, estate, relocation)? That informs how much negotiation room exists.
- Schools are D-rated, which usually means shorter tenancies and higher turnover. Who's the typical renter profile here, and what's been the actual vacancy rate?
- Crime grade is F in this area — have there been break-ins, vandalism, or insurance claims at this property in the last 3 years? What carrier currently insures it and at what premium?
- The area grade is low — what's the realistic commute time and amenity access for the typical tenant pool here? Any planned neighborhood developments (good or bad) we should know about?
- What's the average days-on-market for RENTAL listings here right now (not sales)? A rising rental-DOM trend means longer vacancies and softer asking-rent achievability than the comps imply.
- What's the recent tenant-quality profile in this submarket — average credit score on applications, eviction rate, late-payment / NSF rate, and stable-employment percentage? A property-management company in the area should have these aggregated.
- How much new for-sale + rental construction is in the pipeline within 1–3 miles? Heavy new supply typically softens prices + rents 12–24 months out; constrained supply supports both.
Investment metrics
- 1% rule
- 0.94% ✗
- Cap rate
- 6.87%
- Cash-on-cash
- 2.05%
- DSCR
- 1.09
- GRM
- 8.9
CMA / ARV
- ARV (median comp)
- $49,000
- List price
- $159,900
- Delta
- 226.33%
- Verdict
- OVERPRICED
- Comps
- 13 within 1.0 mi
Show comp detail 12 sales within ~0.75 mi
| Address | Dist | Beds/Ba | Sqft | Sold | Price | $/sf | Match |
|---|---|---|---|---|---|---|---|
| 2200 SE Lancaster Dr Unit 23A | 0.01mi | 2/1.0 | 828 (+4%) | 3mo | $7,000 | $8 | 87 |
| 2200 Lancaster Dr SE Unit 9C | 0.01mi | 2/1.0 | 728 (-9%) | 2mo | $14,500 | $20 | 79 |
| 2232 42nd Ave SE #111 | 0.24mi | 2/1.0 | 840 (+5%) | 11mo | $10,000 | $12 | 67 |
| 2232 42nd Ave SE #781 | 0.24mi | 2/2.0 | 871 (+9%) | 11mo | $13,000 | $15 | 64 |
| 2232 42nd Ave SE #407 | 0.24mi | 2/1.0 | 784 (-2%) | 22mo | $20,000 | $26 | 63 |
| 4413 Essex St | 0.35mi | 2/1.0 | 840 (+5%) | 13mo | $55,000 | $65 | 61 |
| 2232 42nd Ave SE #114 | 0.24mi | 2/1.0 | 726 (-9%) | 12mo | $17,000 | $23 | 59 |
| 3100 Turner Rd SE #429 | 0.60mi | 2/2.0 | 800 (0%) | 17mo | $99,900 | $125 | 58 |
| 3100 Turner Rd #431 | 0.60mi | 2/1.0 | 760 (-5%) | 9mo | $115,000 | $151 | 52 |
| 2200 #22D Lancaster Dr SE Unit 22D | 0.56mi | 2/1.0 | 784 (-2%) | 18mo | $35,000 | $45 | 52 |
| 3100 Turner Rd SE #804 | 0.60mi | 2/1.0 | 880 (+10%) | 20mo | $139,900 | $159 | 35 |
| 3100 Turner Rd SE #705 | 0.60mi | 1/1.5 (-1) | 872 (+9%) | 24mo | $115,000 | $132 | 30 |
Match score weights: distance 35% · size 25% · config 20% · recency 20%. Top-matched comps best support the ARV.
Projected returns pro-forma
-3.0% appreciation · 2.62% rent growth · sell at horizon
- IRR
- -13.5%
- Equity multiple
- 0.52×
- Total profit
- $-21,587
- Equity at exit
- $23,842
- IRR
- -5.1%
- Equity multiple
- 0.67×
- Total profit
- $-14,753
- Equity at exit
- $13,825
Cash invested: $44,772 (down + closing). Projections, not guarantees.
Landlord ↔ Tenant lean methodology
- Overall (STATE)
- 28 Tenant-Leaning
- State Oregon
- 28 Tenant-Leaning · D+6
- County
- — inherits STATE
- City
- — inherits STATE
ZIP-level market 97317
- Rents YoY
- 2.6%
- Active inventory
- 135
- Price-to-rent
- 8.9×
Monthly cashflow live
- Estimated rent
- $1,496 high interval (Pro) →
- Mortgage (P&I)
- −$839
- Tax est. 1.5%
- −$200 /mo · $2,398/yr
- Insurance
- −$67
- HOA
- −$0
- Vacancy / Maint / Mgmt
- −$314
- Net cashflow
- $76
Break-even live
Sensitivity live
| Price | -10% $187 | -5% $132 | +0% $76 | +5% $21 | +10% $-34 |
|---|---|---|---|---|---|
| Rent | -10% $-42 | -5% $17 | +0% $76 | +5% $136 | +10% $195 |
| Rate | -1.0pp $157 | -0.5pp $117 | base $76 | +0.5pp $35 | +1.0pp $-7 |
UW: 25.0% down · 7.5% · 30yr · 1.5% tax · 5.0% vac · 8.0% maint · 8.0% mgmt
Financing live
Cash to close
- Down payment
- $39,975
- Closing costs
- $4,797
- Reserves months
- —
- Total cash needed
- —
Loan-product check · same deal, 3 products live
Conventional
25% down · 7.5% · 30yr
- Down + closing
- —
- Monthly P&I
- —
- Monthly cashflow
- —
- DSCR
- —
- Eligible?
- —
Personal DTI + credit; lowest rate.
DSCR
20% down · 8.5% · 30yr
- Down + closing
- —
- Monthly P&I
- —
- Monthly cashflow
- —
- DSCR
- —
- Eligible?
- —
No personal income docs; deal must DSCR.
Hard money
10% down · 12.0% · 12mo
- Down + closing
- —
- Monthly P&I
- —
- Monthly cashflow
- —
- DSCR
- —
- Eligible?
- —
Short-term bridge; refi at stabilization.
Rent comps 20 comps
| Address | Beds | Baths | Sqft | Rent | $/sqft | DOM | Units | Dist |
|---|---|---|---|---|---|---|---|---|
| 4243 Campbell Dr SE Unit 4243 Salem, OR | 3.0 | 1.0 | 936 | $1,550 | $1.66 | 15d | 1 | 0.30mi |
| 2728 Lancaster Dr SE Unit 2728-14 Salem, OR | 2.0 | 1.5 | 1000 | $1,195 | $1.20 | 45d | 1 | 0.30mi |
| 4435 Campbell Dr SE Salem, OR | 2.0 | 1.0 | 807 | $1,445 | $1.79 | 24d | 1 | 0.40mi |
| 4665 Campbell Dr SE Salem, OR | 1.0–3.0 | 1.0–2.0 | 923 | $1,699 | $1.84 | 15d | 1 | 0.58mi |
| 1029 Raffon Ct SE Unit AR7171-3 Salem, OR | 2.0 | 1.5 | 927 | $1,700 | $1.83 | 24d | 1 | 0.84mi |
| 1569 Whitaker Dr SE Salem, OR | 1.0–3.0 | 1.0–2.0 | 933 | $1,799 | $1.93 | 15d | 1 | 0.90mi |
| 4976 Turquoise Ave SE Salem, OR | 2.0 | 2.0 | 918 | $1,495 | $1.63 | 15d | 5 | 0.95mi |
| 4807 Chinook Ct SE Salem, OR | 3.0 | 1.5 | 1104 | $2,200 | $1.99 | 15d | 1 | 1.08mi |
| 3897 Meadowlawn Loop SE Salem, OR | 1.0–3.0 | 1.0–2.0 | 962 | $1,619 | $1.68 | 15d | 26 | 1.10mi |
| 3828 Bayonne Dr SE Salem, OR | 2.0 | 1.0 | 980 | $1,299 | $1.33 | 15d | 1 | 1.12mi |
| 3822 Bayonne Dr SE Salem, OR | 2.0 | 1.0 | 980 | $1,299 | $1.33 | 24d | 1 | 1.12mi |
| 5192 Caplinger Rd SE Salem, OR | 1.0–3.0 | 1.0–2.0 | 927 | $1,554 | $1.67 | 15d | 25 | 1.25mi |
| 4433 Mahrt Ave SE Unit 4433-205 Salem, OR | 1.0 | 1.0 | 688 | $1,225 | $1.78 | 45d | 1 | 1.34mi |
| 4433 Mahrt Ave SE Unit 4435-201 Salem, OR | 2.0 | 2.0 | 888 | $1,525 | $1.72 | 24d | 1 | 1.34mi |
| 4433 Mahrt Ave SE Unit 4437-206 Salem, OR | 2.0 | 2.0 | 932 | $1,525 | $1.64 | 45d | 1 | 1.34mi |
| 178 Lancaster Dr SE Salem, OR | 2.0 | 2.0 | 952 | $1,495 | $1.57 | 15d | 1 | 1.41mi |
| 4242 State St Salem, OR | 1.0 | 1.0 | 684 | $1,325 | $1.94 | 24d | 1 | 1.42mi |
| 4166 State St Salem, OR | 2.0 | 1.0 | 788 | $1,350 | $1.71 | 15d | 1 | 1.44mi |
| 143 Connecticut Ave SE Unit 143 Salem, OR | 1.0 | 1.0 | 705 | $950 | $1.35 | 15d | 1 | 1.45mi |
| 124 Stafford Ln NE Unit 124-203 Salem, OR | 3.0 | 2.0 | 1052 | $1,595 | $1.52 | 45d | 1 | 1.49mi |
Listing history 1 events
-
2026-04-04$159,900 Active 1056-char remark
Show marketing remark (1056 chars)
Step into easy, modern living with this beautifully crafted 2024 Clayton Homes home, offering 800 sq. ft. of thoughtfully designed space in Salem. Featuring 2 spacious bedrooms and 2 full bathrooms, including a private primary suite with en suite bath, this home delivers the perfect blend of comfort and convenience. The open-concept layout creates a bright, welcoming atmosphere, seamlessly connecting the living room to a stylish kitchen equipped with stainless steel appliances-perfect for everyday living or entertaining. With electric utilities and washer/dryer hookups, every detail is designed to make life simple and efficient. Step outside to enjoy your covered porch-an ideal spot for morning coffee or evening relaxation-plus an asphalt driveway for easy access and parking. Located in the sought-after Sundial 55+ lifestyle community, you'll enjoy a peaceful setting, friendly neighbors, and a true sense of belonging. Just minutes from local shopping, dining, and recreation, Sundial offers the perfect balance of tranquility and convenience.
ⓘ Source: listings_history table (triggers on properties + properties_extension) + one-shot
backfill from property_details.listing_events for pre-trigger history.
Climate risk First Street
- Flood 1/10 Low FEMA zone X · 0% chance over 30 yrs
- Wildfire 1/10 Low
- Heat 4/10 Moderate
Nearby sold comps map
Loading sold comps map…
Walkable amenities ~0.75 mi
Loading nearby amenities…
Taxation est. · year 1
- Rental income
- $17,947
- − Mortgage interest
- −$8,957
- − Property taxes
- −$2,398
- − Insurance
- −$800
- − Repairs & maintenance
- −$1,436
- − Management
- −$1,436
- − Depreciation
- −$4,652
- Taxable loss
- −$1,731
- Est. tax savings @ 24.0%
- +$415
- After-tax cash flow
- $1,333/yr
For passive investors: Depreciation is non-cash, so a rental often shows a tax loss while cash-flowing — sheltering income. Rental losses are passive: they offset passive income freely, and up to $25,000/yr can offset ordinary (W-2) income if you actively participate and your MAGI is under $100k (phasing out to $0 by $150k); unused losses carry forward. On sale, claimed depreciation is recaptured at up to 25%, and gains may owe capital-gains tax (a 1031 exchange can defer both). Figures are a year-1 estimate at your 24.0% rate — not tax advice; consult a CPA.
Condition & rehab AI · 12 photos
This 2024 Clayton Homes manufactured home is in good condition with a modern kitchen and two full bathrooms. It offers a good investment opportunity with potential for both resale and rental value through minor updates and improvements.
Value-add opportunities
- Both Painting the exterior and interior walls — Fresh paint can enhance curb appeal and interior aesthetics.
- Both Upgrading the flooring to hardwood or tile — Hardwood or tile flooring can increase both resale and rental value.
- Both Adding smart home features — Smart home features can improve convenience and attract tech-savvy buyers/renters.
- Both Upgrading the kitchen appliances — Modern appliances can make the kitchen more functional and appealing to potential buyers/renters.
- Both Landscaping the front yard — A well-maintained front yard can enhance curb appeal and attract more potential buyers/renters.
Renovation cost estimate screening
Value-add ROI direction
- Both Painting the exterior and interior walls — Fresh paint can enhance curb appeal and interior aesthetics. ↑
- Both Upgrading the flooring to hardwood or tile — Hardwood or tile flooring can increase both resale and rental value. ↑
- Both Adding smart home features — Smart home features can improve convenience and attract tech-savvy buyers/renters. ↑
- Both Upgrading the kitchen appliances — Modern appliances can make the kitchen more functional and appealing to potential buyers/renters. ↑
- Both Landscaping the front yard — A well-maintained front yard can enhance curb appeal and attract more potential buyers/renters. ↑
ⓘ Cost ranges are severity-bucket heuristics (US national rule-of-thumb). Get contractor quotes + a written scope before underwriting a rehab budget.
Schools (NCES district)
- District
- Salem-Keizer SD 24J
- NCES district ID
- 4110820
- Math proficiency
- 34% ▼ -1.00%
- Reading proficiency
- 47% ▼ -2.00%
- Median HH income
- $48,632
- Composite
- 37.16/100
- National rank
- #9017
- State rank
- #103 of 183 in OR
Livability — Salem
- Score
- 79/100
- State rank
- #59
- US rank
- #2084
Category grades
Schools grade is shown separately in the Schools card above.
Census & demographics
- Census place
- Salem, OR
- County
- Marion County · 258,219 people
- City population
- 193,601
- Metro
- Salem, OR
- Population (ZIP)
- 25,966
- Household income
- $84,393
- Rent vs Own
- Severe rent burden
- 395.0
Population outlook (Marion County) Hauer SSP2
- Today (2025)
- 360,940 people
- By 2030
- 375,178 · +3.9%
- By 2040
- 400,914 · +11.1%
- By 2050
- 422,187 · +17.0%
- By 2075
- 460,305 · +27.5%
- By 2100
- 464,025 · +28.6%
Race, ethnicity, and origin ACS 2023
- Neighborhood character
- Majority White (61%)
- Race & ethnicity
- White 61% Hispanic / Latino 28% Two or more races 17% Asian 2% Pacific Islander 2%
- Hispanic origin (detail)
- Mexican 26%
- Common ancestry
- Portuguese 4% Italian 2% Lithuanian 2%
- Foreign-born
- 11% · Canada, Vietnam
- Languages at home
- 74% English-only · Spanish 22% Russian/Polish/Slavic 2% German/W. Germanic 1%
Political lean MEDSL · Marion
- 2024 margin
- Toss-up / Even · D 47.5% · R 49.5% · Other 3.0%
- 2008→2024 swing
- -4.2pp toward R · 2008: 2.2pp · 2024: -2.0pp
- All cycles
- 2024: R+2.0 2020: D+1.1 2016: R+5.0 2012: R+3.5 2008: D+2.2
Not yet ingested
- Civics
- —
Market trends
- HPI YoY
- ▼ -471.73%
- Current HPI
- 307.3264
- Rent YoY
- ▲ 2.62%
- Metro
- Salem, OR
- State GDP YoY
- ▲ 2.05%
- F500 in state
- 2
Industry mix (Fortune 500 HQ in OR)
| Industry | F500 HQs | Revenue |
|---|---|---|
| Consumer Goods | 1 | $51B |
|
||
Price history
1 event — show timeline
- 2026-04-04 Listed $159,900 Zillow
Cash-flow waterfall
monthlySold comps — $/sqft
last 12 mo · ≤1 miLoading sold comps…