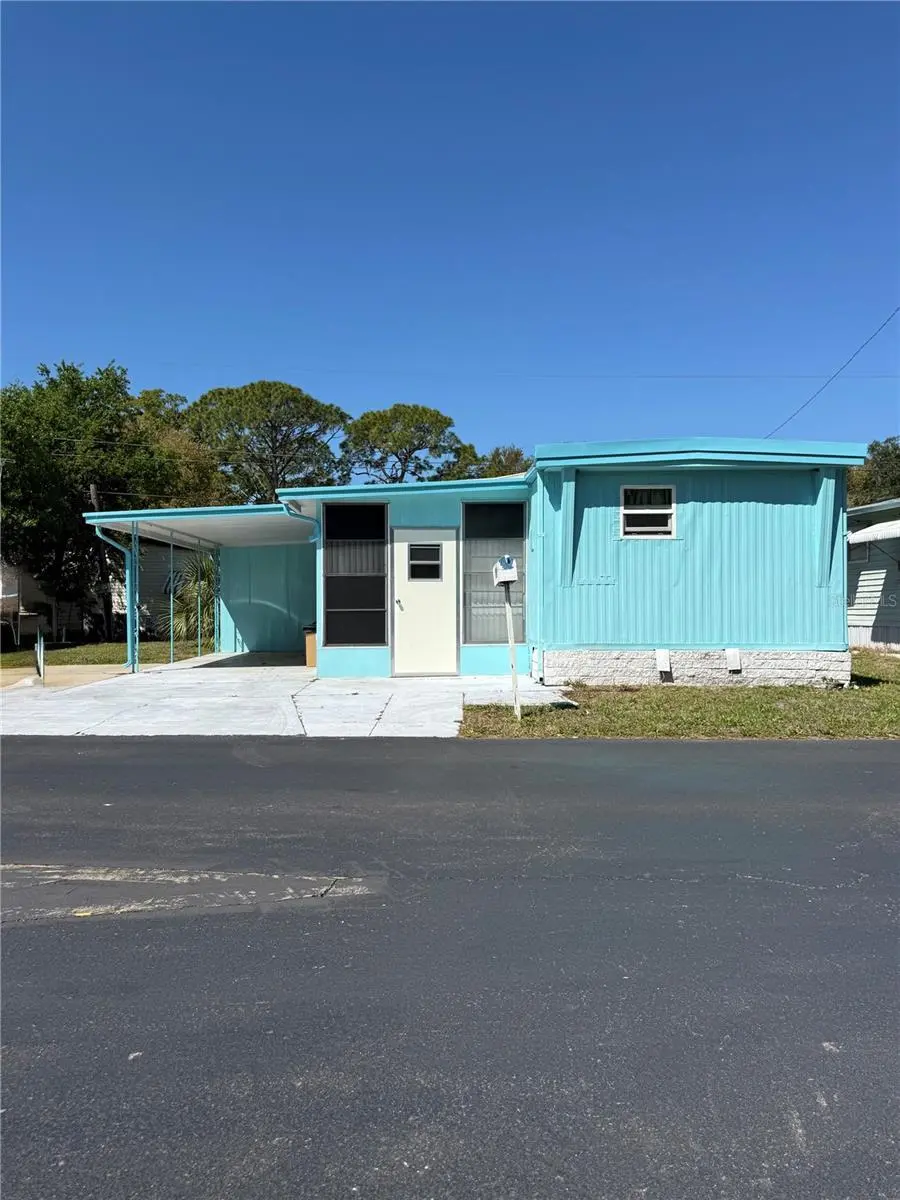
7803 46th Ave N #129 · West Lealman, FL
Flood risk 5/10 · Moderate
- FEMA flood zone
- X (shaded)
- Chance of flooding over 30 yrs
- 0.23%
- Est. flood insurance / yr
- $507 – $1,088
Fire risk 1/10 · Minimal
- Est. fire insurance / yr
- $947 – $1,759
Heat risk 10/10 · Severe
- Hot days now (above 107°F)
- 6 days/yr
- Hot days in 30 yrs
- 18 days/yr
Wind risk 10/10 · Severe
- Chance of severe wind over 30 yrs
- 99.0%
Air-quality risk 4/10 · Minor
- Unhealthy air days now
- 4 days/yr
- Unhealthy air days in 30 yrs
- 4 days/yr
Risk factors via First Street. Map © Google.
Why this score? — see what drove the B+ grade
The composite is a weighted blend of 9 inputs, each scored 0–100. Each bar is that input's sub-score; the figure is the points it added to the 100-point composite (weight × sub-score).
- Cash flow +30.0/30.0
- ARV discount +15.0/15.0
- 1% rule +10.0/10.0
- DSCR +10.0/10.0
- Schools +4.3/10.0
- Livability +4.0/5.0
- Rent growth +2.7/5.0
- Condition / age +2.5/5.0
- Appreciation +0.0/10.0
$69,000
🖨 Deal sheet (PDF) 📄 Offer letter ✓ Due diligence
Listing remarks
Seller is motivated! Bring you offers. Well-maintained 2-bedroom, 1-bath mobile home in the desirable 55+ resident-owned community of Melody Gardens in St. Petersburg. Features vinyl plank flooring in the living room and kitchen, newer kitchen appliances, and an updated bathroom with newer vanity and toilet. Roof-over completed in 2022. Offered mostly furnished for easy move-in. Low $180/month HOA includes water, sewer, trash, and lawn care. Community amenities include clubhouse, pool, shuffleboard, and social activities. Conveniently located near shopping, dining, the Pinellas Trail, and just minutes to the beaches. Buyer approval required.
Key facts
- Roof-over completed
- Clubhouse
- Pool
Tags
Property features AI
Finance
- Other: Furnished; Third-party listing; Living area reported as 552 sq ft
- Financial info: Total annual HOA fees $2,340; Lease/rental restrictions apply
- HOA & community: Has HOA; monthly fee $195 (required); Association approval required; Association contact: Chris Stancil; Community clubhouse, fitness center, and pool; Senior community; No pets allowed; Buyer approval required
Exterior
- Parking: Carport with 1 space
- Utilities: Public water connected; Public sewer (connected); Electricity connected; Cable connected
- Home design: Residential mobile home (single wide); One story; Faces east; Entry level: One
- Construction: Metal frame with metal siding; Membrane and metal roof; Pillar/post/pier foundation; Built on a 2.08-acre lot
- Exterior features: Awnings; Private mailbox; Asphalt road access
Interior
- Kitchen: Range; Refrigerator; Dishwasher not listed
- Bedrooms: 2 bedrooms
- Flooring: Vinyl flooring
- Bathrooms: 1 full bathroom
- Heating & cooling: Ductless heating; Wall/window air conditioning units
- Interior features: Kitchen and family room combined; Open floor plan; 5 total rooms
- Laundry & utility: Washer and dryer included; Laundry located outside
Neighborhood map
What this means for you Summary
Snapshot
- This is a 2-bed/1.0-bath manufactured listed at $69k.
Deal economics
- At list price, monthly cash flow is $604 ($7k/yr) — positive.
- The deal already cash-flows at list — no discount required.
- Meets the 1% rule at list price ($2k rent vs $69k).
- Recommended offer: $65k (6.0% below list) — sets the bar for market timing.
- Cap rate 16.8% vs local median 1.8% in West Lealman — top-decile yield for the area; either an underpriced asset or a hidden risk that comps aren't pricing in. Stress-test before assuming the spread holds.
Location & tenants
- Location reads 81/100 on livability (#84 in FL, #1,396 nationally) — a professional / high-income tenant draw. Strengths: commute A+, cost of living A+, housing A+; Watch: employment D+, amenities F.
- Pinellas (suburban): math 51% / reading 51% proficiency, ranked #31 of 73 in FL (top 42%) — acceptable for families but not a draw, mixed tenant base, ~2y average lease.
- Zoned schools: Seventy-Fourth St. Elementary (math 30% / reading 22%, grade F, #2,015 of 2,144 statewide, top 94%, 444 students, 72% FRL); Dixie M. Hollins High School (math 30% / reading 40%, grade F, #379 of 667 statewide, top 58%, 1,822 students, 56% FRL) — zoned schools average 64% FRL vs 48% district-wide (16 pts higher); higher-poverty schools than district average — tighter screening recommended.
- Zoned-school proficiency averages 30% at this address vs 51% district-wide (-20 pts) — the specific schools serving this property underperform the Pinellas average; the district grade overstates school quality for this exact location.
- Market conditions: Rents flat; 309 active listings in the ZIP; 16 comparable units currently listed for rent nearby; rentals at typical pace (median 19d on market — plan ~3-4 weeks tenant-placement turnaround); 2,676 units permitted in Pinellas County in 2024 (1,422 in 5+ unit buildings).
Forward outlook
- Local home prices are declining (-3.0%/yr); year-one equity from $477 of loan paydown is wiped out by about $2k of value loss. Plan a longer hold.
- Pinellas County population projected at +14% by 2050 — modest demand growth; plan on rents tracking national, not racing it.
- At projected returns (-3.0% appreciation + 1.0% rent growth), your $19k cash investment doubles in ~4 years — after that, you're playing with house money.
Negotiation context
- It's been on market 87 days — a 6% lower offer ($65k) is reasonable based on typical stale-listing flexibility.
- 2 sale attempts; this cycle's ask has dropped $10k (12%) from the opening price — seller is motivated, your offer sets the floor, not the list.
- Current owner paid $19k; list at $69k implies a 269% gain — meaningful room to come down on a strong offer.
Risks & watch-outs
- Climate carrying-cost: moderate flood risk; severe wind risk, 99% chance of damaging wind over 30y; extreme-heat days projected 6→18/yr by 2055 (HVAC capex compounding) — expect insurance premiums to compound above CPI over the hold.
Questions for the listing agent
- It's been on market 87 days. Have you received any prior offers? Is the seller open to a 6% concession, seller financing, or rate buy-down credit?
- Built in 1973 — when were the roof, HVAC, electrical panel, plumbing, and water heater last replaced?
- What does the HOA fee cover, when was the last increase, and are there any pending special assessments or reserve-fund shortfalls?
- Why hasn't it sold? Are there any deal-killer items the seller is aware of (foundation, flood, title, zoning, code violations)?
- Is there a deadline driving the sale (1031 exchange, divorce, estate, relocation)? That informs how much negotiation room exists.
- What's the average days-on-market for RENTAL listings here right now (not sales)? A rising rental-DOM trend means longer vacancies and softer asking-rent achievability than the comps imply.
- What's the recent tenant-quality profile in this submarket — average credit score on applications, eviction rate, late-payment / NSF rate, and stable-employment percentage? A property-management company in the area should have these aggregated.
- How much new for-sale + rental construction is in the pipeline within 1–3 miles? Heavy new supply typically softens prices + rents 12–24 months out; constrained supply supports both.
Investment metrics
- 1% rule
- 2.34% ✓
- Cap rate
- 16.80%
- Cash-on-cash
- 37.53%
- DSCR
- 2.67
- GRM
- 3.6
CMA / ARV
- ARV (on-the-fly)
- $82,800
- Comps found
- 4
Show comp detail 4 sales within ~0.75 mi
| Address | Dist | Beds/Ba | Sqft | Sold | Price | $/sf | Match |
|---|---|---|---|---|---|---|---|
| 5214 Yellow Pine St N | 0.32mi | 2/1.0 | 564 (+2%) | 14mo | $104,300 | $185 | 70 |
| 4235 72nd Way N #99 | 0.54mi | 2/1.5 | 588 (+6%) | 3mo | $88,000 | $150 | 60 |
| 4100 72nd Way N #56 | 0.58mi | 1/1.0 (-1) | 552 (0%) | 13mo | $59,000 | $107 | 57 |
| 5320 W Pine St N | 0.43mi | 1/1.0 (-1) | 619 (+12%) | 10mo | $87,000 | $141 | 47 |
Match score weights: distance 35% · size 25% · config 20% · recency 20%. Top-matched comps best support the ARV.
Projected returns pro-forma
-3.0% appreciation · 0.99% rent growth · sell at horizon
- IRR
- 30.9%
- Equity multiple
- 2.25×
- Total profit
- $24,245
- Equity at exit
- $10,288
- IRR
- 36.8%
- Equity multiple
- 4.04×
- Total profit
- $58,644
- Equity at exit
- $5,966
Cash invested: $19,320 (down + closing). Projections, not guarantees.
Landlord ↔ Tenant lean methodology
- Overall (STATE)
- 87 Strongly Landlord-Friendly
- State Florida
- 87 Strongly Landlord-Friendly · R+3
- County
- — inherits STATE
- City
- — inherits STATE
ZIP-level market 33709
- Rents YoY
- 1.0%
- Active inventory
- 309
- Price-to-rent
- 3.6×
Monthly cashflow live
- Estimated rent
- $1,612 high interval (Pro) →
- Mortgage (P&I)
- −$362
- Tax from tax record
- −$84 /mo · $1,006/yr
- Insurance
- −$29
- HOA
- −$195
- Vacancy / Maint / Mgmt
- −$339
- Net cashflow
- $604
Break-even live
Sensitivity live
| Price | -10% $643 | -5% $624 | +0% $604 | +5% $585 | +10% $565 |
|---|---|---|---|---|---|
| Rent | -10% $477 | -5% $540 | +0% $604 | +5% $668 | +10% $732 |
| Rate | -1.0pp $639 | -0.5pp $622 | base $604 | +0.5pp $586 | +1.0pp $568 |
UW: 25.0% down · 7.5% · 30yr · 1.5% tax · 5.0% vac · 8.0% maint · 8.0% mgmt
Financing live
Cash to close
- Down payment
- $17,250
- Closing costs
- $2,070
- Reserves months
- —
- Total cash needed
- —
Loan-product check · same deal, 3 products live
Conventional
25% down · 7.5% · 30yr
- Down + closing
- —
- Monthly P&I
- —
- Monthly cashflow
- —
- DSCR
- —
- Eligible?
- —
Personal DTI + credit; lowest rate.
DSCR
20% down · 8.5% · 30yr
- Down + closing
- —
- Monthly P&I
- —
- Monthly cashflow
- —
- DSCR
- —
- Eligible?
- —
No personal income docs; deal must DSCR.
Hard money
10% down · 12.0% · 12mo
- Down + closing
- —
- Monthly P&I
- —
- Monthly cashflow
- —
- DSCR
- —
- Eligible?
- —
Short-term bridge; refi at stabilization.
Rent comps 16 comps
| Address | Beds | Baths | Sqft | Rent | $/sqft | DOM | Units | Dist |
|---|---|---|---|---|---|---|---|---|
| 7317 46th Ave N Unit 4 St. Petersburg, FL | 1.0 | 1.0 | 528 | $1,200 | $2.27 | 14d | 1 | 0.40mi |
| 5257 81st Ln N #6 Saint Petersburg, FL | 1.0 | 1.0 | 745 | $1,375 | $1.85 | 25d | 1 | 0.51mi |
| 4801 71st St N Saint Petersburg, FL | 2.0 | 1.0 | 726 | $1,900 | $2.62 | 5d | 1 | 0.58mi |
| 4801 71st St N St Petersburg, FL | 2.0 | 1.0 | 726 | $1,900 | $2.62 | 18d | 1 | 0.58mi |
| 5140 70th St N Unit 3 St. Petersburg, FL | 1.0 | 1.0 | 450 | $1,200 | $2.67 | 25d | 1 | 0.66mi |
| 5411 70th Ln N Saint Petersburg, FL | 2.0 | 1.0 | 600 | $1,800 | $3.00 | 25d | 1 | 0.76mi |
| 7801 34th Ave N #88 Saint Petersburg, FL | 2.0 | 1.0 | 624 | $1,300 | $2.08 | 2d | 1 | 0.78mi |
| 7801 34th Ave N #88 Saint Petersburg, FL | 2.0 | 1.0 | 624 | $1,400 | $2.24 | 25d | 1 | 0.78mi |
| 6801 48th Ave N Unit B St. Petersburg, FL | 1.0 | 1.0 | 650 | $1,525 | $2.35 | 25d | 1 | 0.80mi |
| 4701 68th St N Saint Petersburg, FL | 1.0 | 1.0 | 700 | $1,099 | $1.57 | 25d | 1 | 0.84mi |
| 8800 Bay Pines Blvd #320 Saint Petersburg, FL | 1.0 | 1.0 | 506 | $2,200 | $4.35 | 4d | 1 | 1.00mi |
| 6538 42nd Ave N Unit 7 Kenneth City, FL | 2.0 | 1.0 | 648 | $2,000 | $3.09 | 25d | 1 | 1.18mi |
| 6522 54th Ave N Saint Petersburg, FL | 1.0–3.0 | 1.0–2.0 | 892 | $1,600 | $1.79 | 2d | 10 | 1.20mi |
| 7045 30th Ave N Saint Petersburg, FL | 1.0–2.0 | 1.0–2.0 | 825 | $1,595 | $1.93 | 8d | 1 | 1.27mi |
| 3556 66th St N St. Petersburg, FL | 1.0 | 1.0 | 610 | $1,300 | $2.13 | 15d | 1 | 1.27mi |
| 3980 64th St N Saint Petersburg, FL | 1.0–2.0 | 1.0–2.0 | 707 | $1,500 | $2.12 | 4d | 6 | 1.38mi |
HOA detail
- Monthly dues
- $195 · $2,340/yr
- Likely covers
- watersewertrashlandscapingpool
Listing history 17 events
-
2026-06-18days on market $69,000 Active 87 DOM
-
2026-06-17days on market $69,000 Active 86 DOM
-
2026-06-16days on market $69,000 Active 85 DOM
-
2026-06-15days on market $69,000 Active 84 DOM
-
2026-06-13days on market $69,000 Active 82 DOM
-
2026-06-09days on market $69,000 Active 78 DOM
-
2026-06-08days on market $69,000 Active 77 DOM
-
2026-06-07days on market $69,000 Active 76 DOM
-
2026-06-04days on market $69,000 Active 73 DOM
-
2026-06-03days on market $69,000 Active 72 DOM
-
2026-06-01days on market $69,000 Active 70 DOM
-
2026-05-31days on market $69,000 Active 69 DOM
-
2026-03-31price $69,000
-
2026-03-23$78,500 Active
-
2025-09-25historical
-
2025-03-25$75,000 Active
-
1992-06-26soldstatus $18,700
ⓘ Source: listings_history table (triggers on properties + properties_extension) + one-shot
backfill from property_details.listing_events for pre-trigger history.
Tax reassessment forecast FL · Resets to sale price
- Current annual tax
- $1,006 · $84/mo
- Projected year-2 tax
- $1,006 · $84/mo
- Expected delta
- $0/yr ($0/mo · 0.0%)
ⓘ Screening estimate from a state-policy table — verify with the county assessor before closing.
Climate risk First Street
- Flood 5/10 Major FEMA zone X (shaded) · 23% chance over 30 yrs
- Wildfire 1/10 Low
- Heat 10/10 Extreme 6 d/yr ≥107°F today · 18 d/yr by 30 yrs out
- Wind 10/10 Extreme 99% chance of damaging wind over 30 yrs
- Air quality 4/10 Moderate 4 unhealthy d/yr today · 4 by 30 yrs out
Nearby sold comps map
Loading sold comps map…
Walkable amenities ~0.75 mi
Loading nearby amenities…
Taxation est. · year 1
- Rental income
- $19,346
- − Mortgage interest
- −$3,865
- − Property taxes
- −$1,006
- − Insurance
- −$345
- − Repairs & maintenance
- −$1,548
- − Management
- −$1,548
- − HOA
- −$2,340
- − Depreciation
- −$2,007
- Taxable income
- $6,687
- Est. tax owed @ 24.0%
- −$1,605
- After-tax cash flow
- $5,645/yr
For passive investors: Depreciation is non-cash, so a rental often shows a tax loss while cash-flowing — sheltering income. Rental losses are passive: they offset passive income freely, and up to $25,000/yr can offset ordinary (W-2) income if you actively participate and your MAGI is under $100k (phasing out to $0 by $150k); unused losses carry forward. On sale, claimed depreciation is recaptured at up to 25%, and gains may owe capital-gains tax (a 1031 exchange can defer both). Figures are a year-1 estimate at your 24.0% rate — not tax advice; consult a CPA.
Schools (NCES district)
- District
- Pinellas
- NCES district ID
- 1201560
- Math proficiency
- 51% ▼ -5.00%
- Reading proficiency
- 51% ▼ -3.00%
- Median HH income
- $46,270
- Composite
- 43.27/100
- National rank
- #3046
- State rank
- #31 of 73 in FL
Livability — West Lealman
- Score
- 81/100
- State rank
- #84
- US rank
- #1396
Category grades
Schools grade is shown separately in the Schools card above.
Census & demographics
- Census place
- West Lealman, FL
- County
- Pinellas County · 939,478 people
- City population
- 25,371
- Metro
- Tampa-St. Petersburg-Clearwater, FL
- Population (ZIP)
- 25,050
- Household income
- $53,501
- Rent vs Own
- Severe rent burden
- 712.0
Population outlook (Pinellas County) Hauer SSP2
- Today (2025)
- 1,027,532 people
- By 2030
- 1,063,586 · +3.5%
- By 2040
- 1,125,020 · +9.5%
- By 2050
- 1,168,637 · +13.7%
- By 2075
- 1,265,188 · +23.1%
- By 2100
- 1,260,357 · +22.7%
Race, ethnicity, and origin ACS 2023
- Neighborhood character
- Predominantly White (73%)
- Race & ethnicity
- White 73% Hispanic / Latino 11% Two or more races 10% Black 5% Asian 5%
- Hispanic origin (detail)
- Mexican 2% Puerto Rican 3% Cuban 2% Dominican 1%
- Common ancestry
- Lithuanian 3% Romanian 3% Slovak 2%
- Foreign-born
- 14% · Canada, Vietnam, Jamaica
- Languages at home
- 84% English-only · Spanish 9% Other Indo-European 2% Vietnamese 2%
Political lean MEDSL · Pinellas
- 2024 margin
- Lean R (+5.2) · D 46.9% · R 52.1%
- 2008→2024 swing
- -13.5pp toward R · 2008: 8.3pp · 2024: -5.2pp
- All cycles
- 2024: R+5.2 2020: D+0.2 2016: R+1.1 2012: D+5.6 2008: D+8.3
Not yet ingested
- Civics
- —
Market trends
- HPI YoY
- ▼ -416.74%
- Current HPI
- 391.368
- Rent YoY
- ▲ 0.99%
- Metro
- Tampa-St. Petersburg-Clearwater, FL
- State GDP YoY
- ▲ 3.28%
- F500 in state
- 36
Industry mix (Fortune 500 HQ in FL)
| Industry | F500 HQs | Revenue |
|---|---|---|
| Industrial Technology | 2 | $29B |
|
||
| Insurance | 2 | $17B |
|
||
| Retail | 1 | $60B |
|
||
| Technology Distribution | 1 | $58B |
|
||
| Homebuilding | 1 | $35B |
|
||
| Technology Manufacturing | 1 | $35B |
|
||
Price history
+269.0% since first listed5 events — show timeline
- 2026-03-31 Price Changed $69,000 Stellar MLS as Distributed by MLS Grid
- 2026-03-23 Listed $78,500 Stellar MLS as Distributed by MLS Grid
- 2025-09-25 Listing Removed — Stellar MLS as Distributed by MLS Grid
- 2025-03-25 Listed $75,000 Stellar MLS as Distributed by MLS Grid
- 1992-06-26 Sold (Public Records) $18,700 Public Records
Property tax history
+5.5%/yrLatest (2025): $1,006 · +4.6% YoY. Source: county tax records.
Cash-flow waterfall
monthlySold comps — $/sqft
last 12 mo · ≤1 miLoading sold comps…