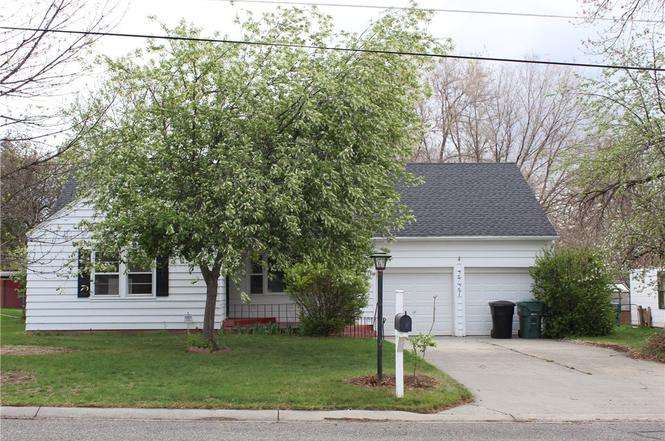
2721 Louise Ln · Billings, MT
Flood risk 1/10 · Minimal
- FEMA flood zone
- X (unshaded)
- Chance of flooding over 30 yrs
- 0.0%
- Est. flood insurance / yr
- $507 – $1,088
Fire risk 3/10 · Minor
- Est. fire insurance / yr
- $918 – $1,706
Heat risk 3/10 · Minor
- Hot days now (above 95°F)
- 7 days/yr
- Hot days in 30 yrs
- 15 days/yr
Wind risk 1/10 · Minimal
- Chance of severe wind over 30 yrs
- —
Air-quality risk 4/10 · Minor
- Unhealthy air days now
- 3 days/yr
- Unhealthy air days in 30 yrs
- 5 days/yr
Risk factors via First Street. Map © Google.
Why this score? — see what drove the D+ grade
The composite is a weighted blend of 9 inputs, each scored 0–100. Each bar is that input's sub-score; the figure is the points it added to the 100-point composite (weight × sub-score).
- ARV discount +15.0/15.0
- Cash flow +14.2/30.0
- DSCR +4.3/10.0
- Livability +4.0/5.0
- Rent growth +3.8/5.0
- Schools +3.2/10.0
- 1% rule +2.8/10.0
- Condition / age +2.5/5.0
- Appreciation +0.0/10.0
$309,000
🖨 Deal sheet (PDF) 📄 Offer letter ✓ Due diligence
Key facts
- Oversized yard
- Fenced backyard
- 0.23 acre lot
Tags
Property features AI
Exterior
- Parking: Attached 2-car garage; 2 covered parking spaces
- Utilities: Public water; Public sewer
- Home design: Single family residence; Two-story; Located in the Snyder subdivision; Suburban neighborhood residential zoning
- Construction: Wood siding exterior; Asphalt roof
- Exterior features: Fenced yard; Landscaped lot
Interior
- Kitchen: Dishwasher; Microwave; Oven; Range / Cooktop; Refrigerator
- Bedrooms: 2 bedrooms on the main level
- Bathrooms: 2 full bathrooms total; 1 bathroom on the main level
- Heating & cooling: Window unit(s) for cooling; Has heating (other type)
- Interior features: Fireplace (1); Crawl space basement
Neighborhood map
What this means for you Summary
Snapshot
- This is a 4-bed/2.0-bath single-family listed at $309k.
Deal economics
- At list price, monthly cash flow is $53 ($635/yr) — positive.
- The deal already cash-flows at list — no discount required.
- To meet the 1% rule (rent ≥ 1% of price), the offer needs to be $240k (22.2% below list).
- Recommended offer: $240k (22.2% below list) — sets the bar for 1% rule.
- Cap rate 6.5% vs local median 3.0% in Billings — top-decile yield for the area; either an underpriced asset or a hidden risk that comps aren't pricing in. Stress-test before assuming the spread holds.
Location & tenants
- Location reads 80/100 on livability (#10 in MT, #1,830 nationally) — a professional / high-income tenant draw. Strengths: amenities A+, commute A+, housing A+; Watch: crime F.
- Billings H S (urban): math 29% / reading 45% proficiency, ranked #69 of 116 in MT (top 60%) — families likely to look elsewhere, expect single-tenant / working-renter base with shorter leases.
- Zoned schools: Poly Drive School (math 52% / reading 42%, grade D-, #101 of 293 statewide, top 39%, 305 students, 0% FRL); Lewis & Clark Middle School (math 26% / reading 47%, grade F, #82 of 146 statewide, top 57%, 667 students, 0% FRL); Billings Sr High School (math 25% / reading 43%, grade F, #55 of 132 statewide, top 41%, 1,739 students, 0% FRL).
- Market conditions: Rents rising fast (+5.0%/yr); 197 active listings in the ZIP; 3 comparable units currently listed for rent nearby; rentals at typical pace (median 15d on market — plan ~3-4 weeks tenant-placement turnaround); solid renter incomes; 1,401 units permitted in Yellowstone County in 2024 (281 in 5+ unit buildings).
- This rent runs 38% of the median local income ($76k/yr) — at the standard rent-burdened threshold; future hikes will face affordability resistance.
Forward outlook
- Local home prices are declining (-3.0%/yr); year-one equity from $2k of loan paydown is wiped out by about $9k of value loss. Plan a longer hold.
- Yellowstone County population projected at +26% by 2050 — long-run rental-demand tailwind backs the buy-and-hold thesis.
Negotiation context
- It's been on market 179 days — a 12% lower offer ($272k) is reasonable based on typical stale-listing flexibility.
- 3 sale attempts; this cycle's ask has dropped $51k (14%) from the opening price — seller is motivated, your offer sets the floor, not the list.
Risks & watch-outs
- Watch-outs: built in 1949 — expect roof / HVAC / electrical / plumbing capex.
Questions for the listing agent
- It's been on market 179 days. Have you received any prior offers? Is the seller open to a 22% concession, seller financing, or rate buy-down credit?
- Built in 1949 — when were the roof, HVAC, electrical panel, plumbing, and water heater last replaced?
- Why hasn't it sold? Are there any deal-killer items the seller is aware of (foundation, flood, title, zoning, code violations)?
- Is there a deadline driving the sale (1031 exchange, divorce, estate, relocation)? That informs how much negotiation room exists.
- Schools are D-rated, which usually means shorter tenancies and higher turnover. Who's the typical renter profile here, and what's been the actual vacancy rate?
- Crime grade is F in this area — have there been break-ins, vandalism, or insurance claims at this property in the last 3 years? What carrier currently insures it and at what premium?
- The area grade is low — what's the realistic commute time and amenity access for the typical tenant pool here? Any planned neighborhood developments (good or bad) we should know about?
- What's the average days-on-market for RENTAL listings here right now (not sales)? A rising rental-DOM trend means longer vacancies and softer asking-rent achievability than the comps imply.
- What's the recent tenant-quality profile in this submarket — average credit score on applications, eviction rate, late-payment / NSF rate, and stable-employment percentage? A property-management company in the area should have these aggregated.
- How much new for-sale + rental construction is in the pipeline within 1–3 miles? Heavy new supply typically softens prices + rents 12–24 months out; constrained supply supports both.
Investment metrics
- 1% rule
- 0.78% ✗
- Cap rate
- 6.50%
- Cash-on-cash
- 0.73%
- DSCR
- 1.03
- GRM
- 10.7
CMA / ARV
- ARV (on-the-fly)
- $377,475
- Comps found
- 12
Show comp detail 12 sales within ~0.75 mi
| Address | Dist | Beds/Ba | Sqft | Sold | Price | $/sf | Match |
|---|---|---|---|---|---|---|---|
| 2713 Downer Ln | 0.31mi | 5/2.0 (+1) | 2,284 (+6%) | 0mo | $399,900 | $175 | 70 |
| 2607 Beartooth Dr | 0.51mi | 3/2.0 (-1) | 2,204 (+2%) | 1mo | $372,500 | $169 | 67 |
| 1907 Patricia Ln | 0.61mi | 3/2.0 (-1) | 2,160 (+0%) | 3mo | $379,900 | $176 | 63 |
| 2220 Lyndale Ln | 0.30mi | 4/2.0 | 1,879 (-13%) | 5mo | $349,900 | $186 | 60 |
| 2411 Granite Ave | 0.45mi | 3/2.0 (-1) | 2,054 (-5%) | 8mo | $360,000 | $175 | 60 |
| 2215 Patricia Ln | 0.33mi | 3/2.0 (-1) | 1,946 (-10%) | 6mo | $314,900 | $162 | 58 |
| 2021 Glendale Lane Ln | 0.47mi | 3/2.0 (-1) | 1,972 (-9%) | 2mo | $337,000 | $171 | 57 |
| 2103 Poly Dr | 0.72mi | 4/2.0 | 2,272 (+5%) | 2mo | $425,000 | $187 | 56 |
| 1817 Rehberg Lane Ln | 0.68mi | 5/2.0 (+1) | 2,016 (-6%) | 2mo | $319,500 | $158 | 51 |
| 2002 Glendale Ln | 0.51mi | 3/2.0 (-1) | 1,865 (-14%) | 0mo | $369,000 | $198 | 48 |
| 1824 Patricia Ln | 0.64mi | 3/2.0 (-1) | 2,374 (+10%) | 6mo | $369,900 | $156 | 43 |
| 1815 28th St W | 0.62mi | 4/3.0 | 2,472 (+15%) | 7mo | $469,500 | $190 | 37 |
Match score weights: distance 35% · size 25% · config 20% · recency 20%. Top-matched comps best support the ARV.
Projected returns pro-forma
-3.0% appreciation · 5.03% rent growth · sell at horizon
- IRR
- -13.2%
- Equity multiple
- 0.52×
- Total profit
- $-41,833
- Equity at exit
- $46,073
- IRR
- -1.8%
- Equity multiple
- 0.87×
- Total profit
- $-11,230
- Equity at exit
- $26,717
Cash invested: $86,520 (down + closing). Projections, not guarantees.
Landlord ↔ Tenant lean methodology
- Overall (STATE)
- 82 Strongly Landlord-Friendly
- State Montana
- 82 Strongly Landlord-Friendly · R+11
- County
- — inherits STATE
- City
- — inherits STATE
ZIP-level market 59102
- Rents YoY
- 5.0%
- Active inventory
- 197
- Price-to-rent
- 10.7×
Monthly cashflow live
- Estimated rent
- $2,405 medium interval (Pro) →
- Mortgage (P&I)
- −$1,620
- Tax from tax record
- −$97 /mo · $1,170/yr
- Insurance
- −$129
- HOA
- −$0
- Vacancy / Maint / Mgmt
- −$505
- Net cashflow
- $53
Break-even live
Sensitivity live
| Price | -10% $228 | -5% $140 | +0% $53 | +5% $-35 | +10% $-122 |
|---|---|---|---|---|---|
| Rent | -10% $-137 | -5% $-42 | +0% $53 | +5% $148 | +10% $243 |
| Rate | -1.0pp $209 | -0.5pp $131 | base $53 | +0.5pp $-27 | +1.0pp $-109 |
UW: 25.0% down · 7.5% · 30yr · 1.5% tax · 5.0% vac · 8.0% maint · 8.0% mgmt
Financing live
Cash to close
- Down payment
- $77,250
- Closing costs
- $9,270
- Reserves months
- —
- Total cash needed
- —
Loan-product check · same deal, 3 products live
Conventional
25% down · 7.5% · 30yr
- Down + closing
- —
- Monthly P&I
- —
- Monthly cashflow
- —
- DSCR
- —
- Eligible?
- —
Personal DTI + credit; lowest rate.
DSCR
20% down · 8.5% · 30yr
- Down + closing
- —
- Monthly P&I
- —
- Monthly cashflow
- —
- DSCR
- —
- Eligible?
- —
No personal income docs; deal must DSCR.
Hard money
10% down · 12.0% · 12mo
- Down + closing
- —
- Monthly P&I
- —
- Monthly cashflow
- —
- DSCR
- —
- Eligible?
- —
Short-term bridge; refi at stabilization.
Rent comps 3 comps
| Address | Beds | Baths | Sqft | Rent | $/sqft | DOM | Units | Dist |
|---|---|---|---|---|---|---|---|---|
| 1704 Wellington Pl Billings, MT | 3.0 | 3.0 | 2426 | $2,395 | $0.99 | 15d | 1 | 0.91mi |
| 3635 Harvest Time Ln Billings, MT | 2.0–3.0 | 2.5–3.0 | 1501 | $2,850 | $1.90 | 15d | 10 | 1.18mi |
| 1126 Lendel Ln Billings, MT | 3.0 | 2.0 | 2020 | $2,300 | $1.14 | 15d | 1 | 1.31mi |
Listing history 26 events
-
2026-06-21days on market $309,000 Active 179 DOM
-
2026-06-19days on market $309,000 Active 177 DOM
-
2026-06-18days on market $309,000 Active 176 DOM
-
2026-06-17days on market $309,000 Active 175 DOM
-
2026-06-16days on market $309,000 Active 174 DOM
-
2026-06-15days on market $309,000 Active 173 DOM
-
2026-06-14days on market $309,000 Active 171 DOM
-
2026-06-13days on market $309,000 Active 170 DOM
-
2026-06-10days on market $309,000 Active 168 DOM
-
2026-06-09days on market $309,000 Active 167 DOM
-
2026-06-08days on market $309,000 Active 166 DOM
-
2026-06-07days on market $309,000 Active 165 DOM
-
2026-06-05days on market $309,000 Active 162 DOM
-
2026-06-02days on market $309,000 Active 160 DOM
-
2026-06-01days on market $309,000 Active 159 DOM
-
2026-05-31days on market $309,000 Active 158 DOM
-
2026-05-30days on market $309,000 Active 157 DOM
-
2026-05-09price $315,000
-
2026-04-15price $339,000
-
2026-04-08status Active
-
2026-03-25historical Active Under Contract
-
2026-02-23status Active
-
2026-02-11historical Active Under Contract
-
2026-01-15price $345,000
-
2025-12-22$360,000 Active
-
2002-05-09soldstatus
ⓘ Source: listings_history table (triggers on properties + properties_extension) + one-shot
backfill from property_details.listing_events for pre-trigger history.
Tax reassessment forecast MT · Resets to sale price
- Current annual tax
- $1,170 · $97/mo
- Projected year-2 tax
- $2,596 · $216/mo
- Expected delta
- +$1,426/yr (+$119/mo · 121.9%)
ⓘ Screening estimate from a state-policy table — verify with the county assessor before closing.
Climate risk First Street
- Flood 1/10 Low FEMA zone X (unshaded) · 0% chance over 30 yrs
- Wildfire 3/10 Moderate
- Heat 3/10 Moderate 7 d/yr ≥95°F today · 15 d/yr by 30 yrs out
- Wind 1/10 Low
- Air quality 4/10 Moderate 3 unhealthy d/yr today · 5 by 30 yrs out
Nearby sold comps map
Loading sold comps map…
Walkable amenities ~0.75 mi
Loading nearby amenities…
Taxation est. · year 1
- Rental income
- $28,854
- − Mortgage interest
- −$17,309
- − Property taxes
- −$1,170
- − Insurance
- −$1,545
- − Repairs & maintenance
- −$2,308
- − Management
- −$2,308
- − Depreciation
- −$8,989
- Taxable loss
- −$4,775
- Est. tax savings @ 24.0%
- +$1,146
- After-tax cash flow
- $1,781/yr
For passive investors: Depreciation is non-cash, so a rental often shows a tax loss while cash-flowing — sheltering income. Rental losses are passive: they offset passive income freely, and up to $25,000/yr can offset ordinary (W-2) income if you actively participate and your MAGI is under $100k (phasing out to $0 by $150k); unused losses carry forward. On sale, claimed depreciation is recaptured at up to 25%, and gains may owe capital-gains tax (a 1031 exchange can defer both). Figures are a year-1 estimate at your 24.0% rate — not tax advice; consult a CPA.
Schools (NCES district)
- District
- Billings H S
- NCES district ID
- 3003900
- Math proficiency
- 29% ▼ -4.00%
- Reading proficiency
- 45% ▲ 2.00%
- Median HH income
- $49,863
- Composite
- 31.93/100
- National rank
- #5848
- State rank
- #69 of 116 in MT
Livability — Billings
- Score
- 80/100
- State rank
- #10
- US rank
- #1830
Category grades
Schools grade is shown separately in the Schools card above.
Census & demographics
- Census place
- Billings, MT
- County
- Yellowstone County · 159,426 people
- City population
- 147,124
- Metro
- Billings, MT
- Population (ZIP)
- 47,977
- Household income
- $76,141
- Rent vs Own
- Severe rent burden
- 1584.0
Population outlook (Yellowstone County) Hauer SSP2
- Today (2025)
- 176,227 people
- By 2030
- 185,619 · +5.3%
- By 2040
- 203,543 · +15.5%
- By 2050
- 221,100 · +25.5%
- By 2075
- 266,931 · +51.5%
- By 2100
- 301,141 · +70.9%
Race, ethnicity, and origin ACS 2023
- Neighborhood character
- Predominantly White (88%)
- Race & ethnicity
- White 88% Hispanic / Latino 6% Two or more races 5% Native American 2% Asian 1%
- Hispanic origin (detail)
- Mexican 4%
- Common ancestry
- Portuguese 10% Slovak 3% Lithuanian 3%
- Foreign-born
- 2% · Canada, Vietnam
- Languages at home
- 96% English-only · Spanish 2% Vietnamese 1%
Political lean MEDSL · Yellowstone
- 2024 margin
- Strong R (+27.1) · D 34.9% · R 62.0% · Other 3.1%
- 2008→2024 swing
- -20.8pp toward R · 2008: -6.3pp · 2024: -27.1pp
- All cycles
- 2024: R+27.1 2020: R+24.0 2016: R+27.1 2012: R+20.6 2008: R+6.3
Not yet ingested
- Civics
- —
Market trends
- HPI YoY
- ▼ -364.20%
- Current HPI
- 205.0915
- Rent YoY
- ▲ 5.03%
- Metro
- Billings, MT
- State GDP YoY
- ▲ 3.41%
- F500 in state
- 2
Industry mix (Fortune 500 HQ in MT)
| Industry | F500 HQs | Revenue |
|---|---|---|
| Technology / Analytics | 1 | $2B |
|
||
Price history
-12.5% since first listed9 events — show timeline
- 2026-05-09 Price Changed $315,000 BMTMLS
- 2026-04-15 Price Changed $339,000 BMTMLS
- 2026-04-08 Relisted — BMTMLS
- 2026-03-25 Contingent — BMTMLS
- 2026-02-23 Relisted — BMTMLS
- 2026-02-11 Contingent — BMTMLS
- 2026-01-15 Price Changed $345,000 BMTMLS
- 2025-12-22 Listed $360,000 BMTMLS
- 2002-05-09 Sold (Public Records) — Public Records
Property tax history
-3.3%/yrLatest (2025): $1,170 · -59.3% YoY. Source: county tax records.
Cash-flow waterfall
monthlySold comps — $/sqft
last 12 mo · ≤1 miLoading sold comps…