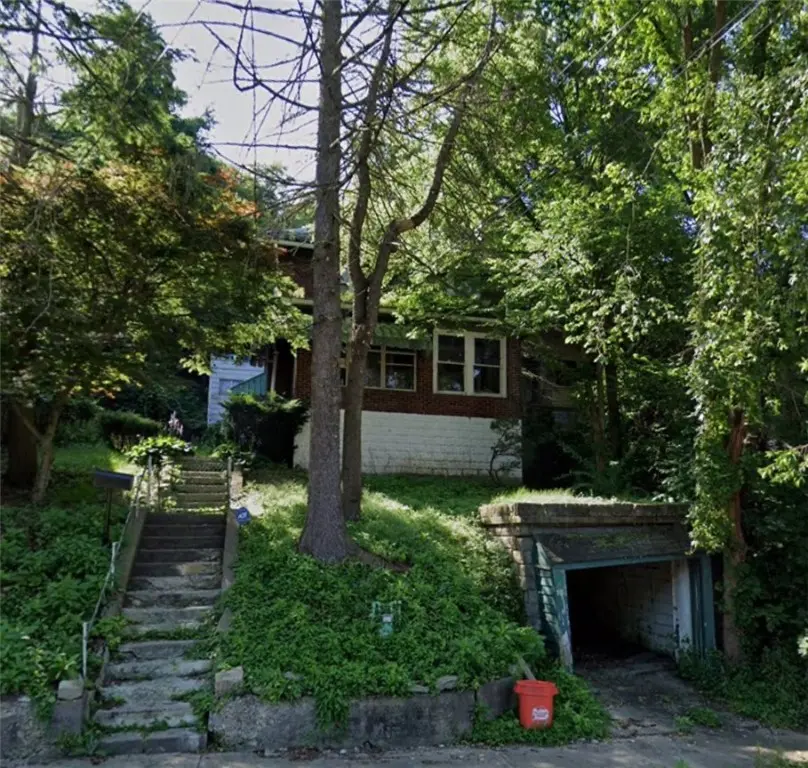
1934 Laketon Rd · Wilkinsburg, PA
Flood risk 1/10 · Minimal
- FEMA flood zone
- X (unshaded)
- Chance of flooding over 30 yrs
- 0.0%
- Est. flood insurance / yr
- $473 – $860
Fire risk 1/10 · Minimal
- Est. fire insurance / yr
- $511 – $949
Heat risk 3/10 · Minor
- Hot days now (above 96°F)
- 7 days/yr
- Hot days in 30 yrs
- 17 days/yr
Wind risk 2/10 · Minimal
- Chance of severe wind over 30 yrs
- —
Air-quality risk 4/10 · Minor
- Unhealthy air days now
- 4 days/yr
- Unhealthy air days in 30 yrs
- 5 days/yr
Risk factors via First Street. Map © Google.
Why this score? — see what drove the D grade
The composite is a weighted blend of 9 inputs, each scored 0–100. Each bar is that input's sub-score; the figure is the points it added to the 100-point composite (weight × sub-score).
- Cash flow +15.0/30.0
- ARV discount +7.5/15.0
- 1% rule +5.0/10.0
- DSCR +5.0/10.0
- Livability +3.8/5.0
- Rent growth +3.5/5.0
- Condition / age +2.5/5.0
- Schools +1.5/10.0
- Appreciation +0.0/10.0
$20,000
🖨 Deal sheet (PDF) 📄 Offer letter ✓ Due diligence
Listing remarks MLS
Opportunity awaits at 1934 Laketon Road in Wilkinsburg. This three-bedroom, one-and-a-half-bath home offers generous square footage and a welcoming front porch, providing a solid foundation for a full renovation. The property requires extensive repairs and updates throughout, making it best suited for investors or buyers prepared to take on a complete project. With vision and effort, this home presents the potential to be transformed into a finished residence or resale opportunity
Key facts
- 5,401 sq ft lot
- Built 1925
- Listed 187 days
Neighborhood map
What this means for you Summary
Snapshot
- This is a 3-bed/1.5-bath single-family listed at $20k.
Deal economics
- At list price, monthly cash flow is $1k ($14k/yr) — positive.
- The deal already cash-flows at list — no discount required.
- Meets the 1% rule at list price ($2k rent vs $20k).
- Recommended offer: $18k (12.0% below list) — sets the bar for market timing.
- Cap rate 77.1% vs local median 10.6% in Wilkinsburg — top-decile yield for the area; either an underpriced asset or a hidden risk that comps aren't pricing in. Stress-test before assuming the spread holds.
Location & tenants
- Location reads 76/100 on livability (#411 in PA, #3,754 nationally) — a middle-class / working-renter tenant base. Strengths: commute A+, cost of living A+, housing A+; Watch: schools D+, health & safety D+, crime F.
- Wilkinsburg Borough SD (suburban): math 14% / reading 23% proficiency, ranked #503 of 539 in PA (top 93%) — low school quality limits family demand, transient renter base, plan for 1-2y turnover; 96% free/reduced lunch — lower-income household profile, screen leases tightly.
- Market conditions: Rents rising (+3.9%/yr); 117 active listings in the ZIP; 26 comparable units currently listed for rent nearby; rentals at typical pace (median 25d on market — plan ~3-4 weeks tenant-placement turnaround); 2,996 units permitted in Allegheny County in 2024 (1,588 in 5+ unit buildings).
- This rent runs 36% of the median local income ($55k/yr) — at the standard rent-burdened threshold; future hikes will face affordability resistance.
Forward outlook
- Local home prices are declining (-3.0%/yr); year-one equity from $138 of loan paydown is wiped out by about $600 of value loss. Plan a longer hold.
- At projected returns (-3.0% appreciation + 3.9% rent growth), your $6k cash investment doubles in ~1 year — after that, you're playing with house money.
Negotiation context
- It's been on market 188 days — a 12% lower offer ($18k) is reasonable based on typical stale-listing flexibility.
- Current owner paid $10k; list at $20k implies a 111% gain — meaningful room to come down on a strong offer.
Risks & watch-outs
- Watch-outs: built in 1925 — expect roof / HVAC / electrical / plumbing capex.
Questions for the listing agent
- It's been on market 188 days. Have you received any prior offers? Is the seller open to a 12% concession, seller financing, or rate buy-down credit?
- Built in 1925 — when were the roof, HVAC, electrical panel, plumbing, and water heater last replaced?
- Why hasn't it sold? Are there any deal-killer items the seller is aware of (foundation, flood, title, zoning, code violations)?
- Is there a deadline driving the sale (1031 exchange, divorce, estate, relocation)? That informs how much negotiation room exists.
- Schools are D-rated, which usually means shorter tenancies and higher turnover. Who's the typical renter profile here, and what's been the actual vacancy rate?
- Crime grade is F in this area — have there been break-ins, vandalism, or insurance claims at this property in the last 3 years? What carrier currently insures it and at what premium?
- The area grade is low — what's the realistic commute time and amenity access for the typical tenant pool here? Any planned neighborhood developments (good or bad) we should know about?
- What's the average days-on-market for RENTAL listings here right now (not sales)? A rising rental-DOM trend means longer vacancies and softer asking-rent achievability than the comps imply.
- What's the recent tenant-quality profile in this submarket — average credit score on applications, eviction rate, late-payment / NSF rate, and stable-employment percentage? A property-management company in the area should have these aggregated.
- How much new for-sale + rental construction is in the pipeline within 1–3 miles? Heavy new supply typically softens prices + rents 12–24 months out; constrained supply supports both.
Investment metrics
- 1% rule
- 8.35% ✓
- Cap rate
- 77.12%
- Cash-on-cash
- 252.95%
- DSCR
- 12.26
- GRM
- 1.0
CMA / ARV
- ARV (median comp)
- $85,334
- List price
- $20,000
- Delta
- -76.56%
- Verdict
- UNDERPRICED
- Comps
- 20 within 1.0 mi
Show comp detail 12 sales within ~0.75 mi
| Address | Dist | Beds/Ba | Sqft | Sold | Price | $/sf | Match |
|---|---|---|---|---|---|---|---|
| 2233 Laketon Rd | 0.30mi | 3/1.0 | 1,536 (-0%) | 4mo | $25,000 | $16 | 81 |
| 2339 Collins Rd | 0.40mi | 3/2.0 | 1,468 (-5%) | 3mo | $257,000 | $175 | 70 |
| 2072 Boggs Ave | 0.15mi | 3/1.5 | 1,324 (-14%) | 1mo | $83,000 | $63 | 69 |
| 1054 Osage Dr | 0.45mi | 3/1.5 | 1,413 (-8%) | 0mo | $195,000 | $138 | 65 |
| 2381 Collins Rd | 0.46mi | 3/1.5 | 1,645 (+7%) | 3mo | $156,689 | $95 | 65 |
| 1117 James St | 0.62mi | 3/2.0 | 1,512 (-2%) | 6mo | $147,325 | $97 | 61 |
| 1910 Beech St | 0.28mi | 3/1.5 | 1,724 (+12%) | 8mo | $230,000 | $133 | 61 |
| 1842 Graham Blvd | 0.50mi | 3/2.5 | 1,628 (+6%) | 3mo | $243,500 | $150 | 60 |
| 2516 Collins Rd | 0.70mi | 3/2.0 | 1,600 (+4%) | 3mo | $255,000 | $159 | 56 |
| 1871 Atkinson Pl | 0.54mi | 3/1.0 | 1,700 (+10%) | 1mo | $240,000 | $141 | 54 |
| 2534 Graham Blvd | 0.62mi | 3/2.5 | 1,680 (+9%) | 1mo | $340,000 | $202 | 51 |
| 42 Barton Dr | 0.65mi | 3/1.5 | 1,365 (-11%) | 5mo | $257,000 | $188 | 47 |
Match score weights: distance 35% · size 25% · config 20% · recency 20%. Top-matched comps best support the ARV.
Projected returns pro-forma
-3.0% appreciation · 3.86% rent growth · sell at horizon
- IRR
- —
- Equity multiple
- 14.11×
- Total profit
- $73,425
- Equity at exit
- $2,982
- IRR
- —
- Equity multiple
- 30.81×
- Total profit
- $166,933
- Equity at exit
- $1,729
Cash invested: $5,600 (down + closing). Projections, not guarantees.
Landlord ↔ Tenant lean methodology
- Overall (STATE)
- 62 Landlord-Friendly
- State Pennsylvania
- 62 Landlord-Friendly · EVEN
- County
- — inherits STATE
- City
- — inherits STATE
ZIP-level market 15221
- Home prices YoY
- -32.3%
- Rents YoY
- 3.9%
- Active inventory
- 117
- Price-to-rent
- 1.0×
Monthly cashflow live
- Estimated rent
- $1,669 high interval (Pro) →
- Mortgage (P&I)
- −$105
- Tax est. 1.5%
- −$25 /mo · $300/yr
- Insurance
- −$8
- HOA
- −$0
- Vacancy / Maint / Mgmt
- −$351
- Net cashflow
- $1,180
Break-even live
Sensitivity live
| Price | -10% $1,194 | -5% $1,187 | +0% $1,180 | +5% $1,174 | +10% $1,167 |
|---|---|---|---|---|---|
| Rent | -10% $1,049 | -5% $1,115 | +0% $1,180 | +5% $1,246 | +10% $1,312 |
| Rate | -1.0pp $1,191 | -0.5pp $1,186 | base $1,180 | +0.5pp $1,175 | +1.0pp $1,170 |
UW: 25.0% down · 7.5% · 30yr · 1.5% tax · 5.0% vac · 8.0% maint · 8.0% mgmt
Financing live
Cash to close
- Down payment
- $5,000
- Closing costs
- $600
- Reserves months
- —
- Total cash needed
- —
Loan-product check · same deal, 3 products live
Conventional
25% down · 7.5% · 30yr
- Down + closing
- —
- Monthly P&I
- —
- Monthly cashflow
- —
- DSCR
- —
- Eligible?
- —
Personal DTI + credit; lowest rate.
DSCR
20% down · 8.5% · 30yr
- Down + closing
- —
- Monthly P&I
- —
- Monthly cashflow
- —
- DSCR
- —
- Eligible?
- —
No personal income docs; deal must DSCR.
Hard money
10% down · 12.0% · 12mo
- Down + closing
- —
- Monthly P&I
- —
- Monthly cashflow
- —
- DSCR
- —
- Eligible?
- —
Short-term bridge; refi at stabilization.
Rent comps 26 comps
| Address | Beds | Baths | Sqft | Rent | $/sqft | DOM | Units | Dist |
|---|---|---|---|---|---|---|---|---|
| 2031 Chalfant St Pittsburgh, PA | 3.0 | 1.5 | 1150 | $1,950 | $1.70 | 45d | 1 | 0.06mi |
| 1962 McNary Blvd Pittsburgh, PA | 3.0 | 1.0 | 1517 | $1,545 | $1.02 | 8d | 1 | 0.20mi |
| 7534 Penn Bridge Ct Pittsburgh, PA | 2.0 | 2.0 | 1259 | $1,750 | $1.39 | 45d | 1 | 0.45mi |
| 7215 Beacon Hill Dr Pittsburgh, PA | 2.0 | 2.0 | 1259 | $1,795 | $1.43 | 5d | 1 | 0.61mi |
| 648 Southern Ave Penn Hills, PA | 3.0 | 1.0 | 1100 | $1,600 | $1.45 | 8d | 1 | 0.73mi |
| 8918 Frankstown Rd Pittsburgh, PA | 3.0 | 1.0 | 1400 | $1,907 | $1.36 | 15d | 1 | 0.80mi |
| 1148 East St Pittsburgh, PA | 3.0 | 3.0 | 1738 | $1,700 | $0.98 | 45d | 1 | 0.81mi |
| 3005 Laketon Rd Pittsburgh, PA | 3.0 | 1.0 | 1100 | $1,295 | $1.18 | 15d | 1 | 0.84mi |
| 610 Churchill Ave Pittsburgh, PA | 3.0 | 1.0 | 1100 | $1,395 | $1.27 | 3d | 1 | 0.84mi |
| 8606 Westwood Rd Pittsburgh, PA | 4.0 | 1.0 | 1596 | $1,425 | $0.89 | 45d | 1 | 0.94mi |
| 100 Bryn Mawr Ct W Pittsburgh, PA | 1.0–2.0 | 1.0–2.0 | 975 | $1,904 | $1.95 | 4d | 15 | 1.06mi |
| 565 Ardmore Blvd Pittsburgh, PA | 4.0 | 1.0 | 1368 | $1,450 | $1.06 | 11d | 1 | 1.09mi |
| 8612 Oakcrest Rd Pittsburgh, PA | 2.0 | 1.0 | 1218 | $1,450 | $1.19 | 25d | 1 | 1.11mi |
| 515 Hill Ave Pittsburgh, PA | 4.0 | 1.0 | 1628 | $1,300 | $0.80 | 45d | 1 | 1.18mi |
| 314 Penn Vista Dr Pittsburgh, PA | 2.0 | 1.0 | 1150 | $1,250 | $1.09 | 45d | 1 | 1.20mi |
| 641 Penny Dr Pittsburgh, PA | 3.0 | 1.5 | 1199 | $1,525 | $1.27 | 15d | 1 | 1.21mi |
| 103 Grove Rd Verona, PA | 3.0 | 1.5 | 1460 | $1,450 | $0.99 | 13d | 1 | 1.27mi |
| 745 Franklin Ave Pittsburgh, PA | 4.0 | 2.0 | 1948 | $1,599 | $0.82 | 45d | 1 | 1.28mi |
| 1250 Blackadore Ave Pittsburgh, PA | 3.0 | 1.0 | 1440 | $1,750 | $1.22 | 25d | 1 | 1.31mi |
| 216 Grove Rd Verona, PA | 3.0 | 1.0 | 1165 | $1,550 | $1.33 | 45d | 1 | 1.34mi |
| 209 Briarwood Dr Pittsburgh, PA | 3.0 | 2.0 | 1080 | $1,500 | $1.39 | 25d | 1 | 1.36mi |
| 10135 Pearl Rd Pittsburgh, PA | 3.0 | 2.0 | 1163 | $1,450 | $1.25 | 25d | 1 | 1.37mi |
| 700 Filmore Rd Pittsburgh, PA | 3.0 | 2.0 | 1072 | $1,800 | $1.68 | 13d | 1 | 1.39mi |
| 826 Walnut St Pittsburgh, PA | 2.0 | 1.0 | 1270 | $1,195 | $0.94 | 45d | 1 | 1.42mi |
| 442 Locust St Pittsburgh, PA | 2.0 | 1.0 | 1600 | $2,600 | $1.62 | 4d | 1 | 1.46mi |
| 600 Kelly Ave Pittsburgh, PA | 1.0–2.0 | 1.0 | 968 | $1,350 | $1.39 | 4d | 3 | 1.49mi |
Listing history 16 events
-
2026-06-21days on market $20,000 Active 188 DOM
-
2026-06-18days on market $20,000 Active 185 DOM
-
2026-06-17days on market $20,000 Active 184 DOM
-
2026-06-16days on market $20,000 Active 183 DOM
-
2026-06-15days on market $20,000 Active 182 DOM
-
2026-06-13days on market $20,000 Active 180 DOM
-
2026-06-09days on market $20,000 Active 176 DOM
-
2026-06-08days on market $20,000 Active 175 DOM
-
2026-06-07days on market $20,000 Active 174 DOM
-
2026-06-05days on market $20,000 Active 171 DOM
-
2026-06-03days on market $20,000 Active 170 DOM
-
2026-06-02days on market $20,000 Active 169 DOM
-
2026-06-01days on market $20,000 Active 168 DOM
-
2026-05-31days on market $20,000 Active 167 DOM
-
2025-12-10$20,000 Active 485-char remark
Show marketing remark (485 chars)
Opportunity awaits at 1934 Laketon Road in Wilkinsburg. This three-bedroom, one-and-a-half-bath home offers generous square footage and a welcoming front porch, providing a solid foundation for a full renovation. The property requires extensive repairs and updates throughout, making it best suited for investors or buyers prepared to take on a complete project. With vision and effort, this home presents the potential to be transformed into a finished residence or resale opportunity
-
1975-10-10soldstatus $9,500
ⓘ Source: listings_history table (triggers on properties + properties_extension) + one-shot
backfill from property_details.listing_events for pre-trigger history.
Climate risk First Street
- Flood 1/10 Low FEMA zone X (unshaded) · 0% chance over 30 yrs
- Wildfire 1/10 Low
- Heat 3/10 Moderate 7 d/yr ≥96°F today · 17 d/yr by 30 yrs out
- Wind 2/10 Low
- Air quality 4/10 Moderate 4 unhealthy d/yr today · 5 by 30 yrs out
Nearby sold comps map
Loading sold comps map…
Walkable amenities ~0.75 mi
Loading nearby amenities…
Taxation est. · year 1
- Rental income
- $20,030
- − Mortgage interest
- −$1,120
- − Property taxes
- −$300
- − Insurance
- −$100
- − Repairs & maintenance
- −$1,602
- − Management
- −$1,602
- − Depreciation
- −$582
- Taxable income
- $14,723
- Est. tax owed @ 24.0%
- −$3,534
- After-tax cash flow
- $10,632/yr
For passive investors: Depreciation is non-cash, so a rental often shows a tax loss while cash-flowing — sheltering income. Rental losses are passive: they offset passive income freely, and up to $25,000/yr can offset ordinary (W-2) income if you actively participate and your MAGI is under $100k (phasing out to $0 by $150k); unused losses carry forward. On sale, claimed depreciation is recaptured at up to 25%, and gains may owe capital-gains tax (a 1031 exchange can defer both). Figures are a year-1 estimate at your 24.0% rate — not tax advice; consult a CPA.
Schools (NCES district)
- District
- Wilkinsburg Borough SD
- NCES district ID
- 4226370
- Math proficiency
- 14% ▼ -8.00%
- Reading proficiency
- 23% ▼ -9.00%
- Median HH income
- $32,204
- Composite
- 14.94/100
- National rank
- #9368
- State rank
- #503 of 539 in PA
Livability — Wilkinsburg
- Score
- 76/100
- State rank
- #411
- US rank
- #3754
Category grades
Schools grade is shown separately in the Schools card above.
Census & demographics
- Census place
- Wilkinsburg, PA
- County
- Allegheny County · 1,022,028 people
- City population
- 29,513
- Metro
- Pittsburgh, PA
- Population (ZIP)
- 29,374
- Household income
- $55,028
- Rent vs Own
- Severe rent burden
- 1933.0
Population outlook (Allegheny County) Hauer SSP2
- Today (2025)
- 1,250,282 people
- By 2030
- 1,256,482 · +0.5%
- By 2040
- 1,256,318 · +0.5%
- By 2050
- 1,244,169 · -0.5%
- By 2075
- 1,197,693 · -4.2%
- By 2100
- 1,093,187 · -12.6%
Race, ethnicity, and origin ACS 2023
- Neighborhood character
- Diverse neighborhood (Simpson 0.60)
- Race & ethnicity
- White 47% Black 43% Two or more races 7% Hispanic / Latino 4% Asian 1%
- Common ancestry
- Romanian 4% Lithuanian 2% Serbian 1%
- Foreign-born
- 4% · Canada, South Korea, China
- Languages at home
- 93% English-only · Spanish 2% French/Haitian/Cajun 1% Other Indo-European 1%
Political lean MEDSL · Allegheny
- 2024 margin
- Strong D (+20.3) · D 59.7% · R 39.4%
- 2008→2024 swing
- +4.8pp toward D · 2008: 15.5pp · 2024: 20.3pp
- All cycles
- 2024: D+20.3 2020: D+20.4 2016: D+16.4 2012: D+14.4 2008: D+15.5
Not yet ingested
- Civics
- —
Market trends
- HPI YoY
- ▼ -109.77%
- Current HPI
- 230.0486
- Rent YoY
- ▲ 3.86%
- Metro
- Pittsburgh, PA
- State GDP YoY
- ▲ 1.68%
- F500 in state
- 34
Industry mix (Fortune 500 HQ in PA)
| Industry | F500 HQs | Revenue |
|---|---|---|
| Healthcare | 2 | $309B |
|
||
| Insurance | 2 | $27B |
|
||
| Telecommunications / Media | 1 | $124B |
|
||
| Industrial Distribution | 1 | $22B |
|
||
| Financial Services | 1 | $20B |
|
||
| Chemicals / Materials | 1 | $18B |
|
||
Price history
+110.5% since first listed2 events — show timeline
- 2025-12-10 Listed $20,000 West Penn MLS
- 1975-10-10 Sold (Public Records) $9,500 Public Records
Property tax history
+2.8%/yrLatest (2026): $2,047 · +3.0% YoY. Source: county tax records.
Cash-flow waterfall
monthlySold comps — $/sqft
last 12 mo · ≤1 miLoading sold comps…