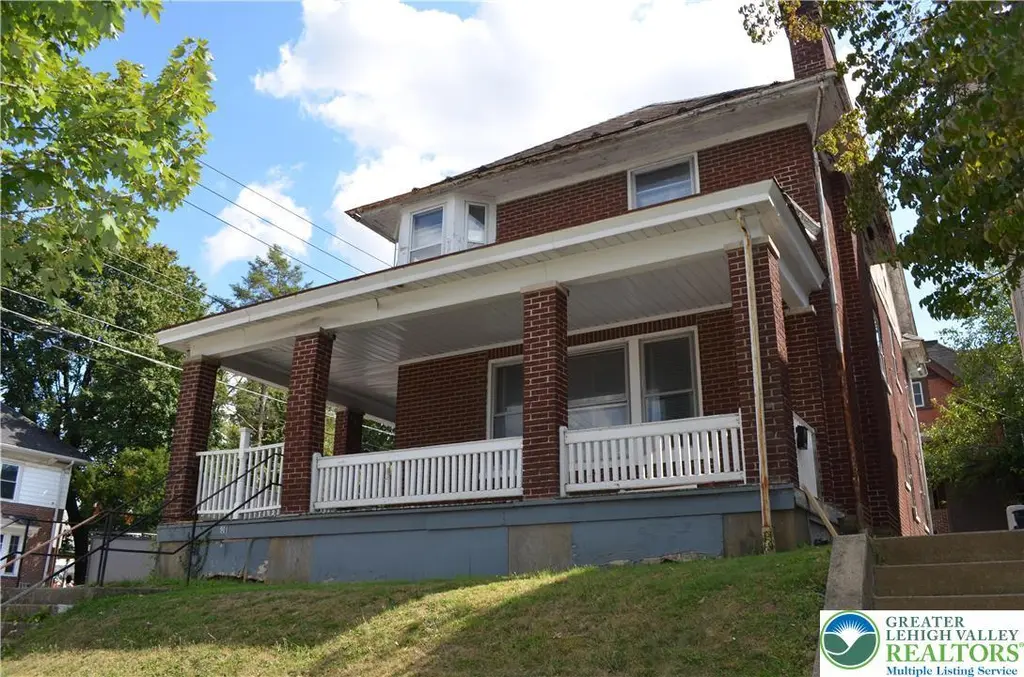
901 West Broad St · Bethlehem, PA
Flood risk 1/10 · Minimal
- FEMA flood zone
- X (unshaded)
- Chance of flooding over 30 yrs
- 0.0%
- Est. flood insurance / yr
- $473 – $860
Fire risk 4/10 · Minor
- Est. fire insurance / yr
- $511 – $949
Heat risk 5/10 · Moderate
- Hot days now (above 100°F)
- 7 days/yr
- Hot days in 30 yrs
- 15 days/yr
Wind risk 4/10 · Minor
- Chance of severe wind over 30 yrs
- 17.0%
Air-quality risk 4/10 · Minor
- Unhealthy air days now
- 3 days/yr
- Unhealthy air days in 30 yrs
- 6 days/yr
Risk factors via First Street. Map © Google.
Why this score? — see what drove the C- grade
The composite is a weighted blend of 9 inputs, each scored 0–100. Each bar is that input's sub-score; the figure is the points it added to the 100-point composite (weight × sub-score).
- Cash flow +15.3/30.0
- ARV discount +15.0/15.0
- 1% rule +4.8/10.0
- DSCR +4.7/10.0
- Livability +4.1/5.0
- Schools +3.5/10.0
- Rent growth +2.7/5.0
- Condition / age +2.5/5.0
- Appreciation +0.0/10.0
$299,000
🖨 Deal sheet 📄 Offer letter ✓ Due diligence
Listing remarks MLS
Welcome to 901 West Broad Street! Located in West Bethlehem and only minutes from Historic Downtown Bethlehem, this property offers convenience, walkability, and historic charm all in one. From the historic Bethlehem Rose Garden, to the numerous cafes, restaurants and amenities found within close proximity, all with easy access to highways i-78 and i-22. This is the perfect location to experience what Bethlehem has to offer. Being sold As-Is.
Key facts
- 3,581 sq ft lot
- Built 1920
- Listed 285 days
Tags
Neighborhood map
What this means for you Summary
Snapshot
- This is a 4-bed/2.0-bath single-family listed at $299k.
Deal economics
- At list price, monthly cash flow is $110 ($1k/yr) — positive.
- The deal already cash-flows at list — no discount required.
- To meet the 1% rule (rent ≥ 1% of price), the offer needs to be $294k (1.8% below list).
- Recommended offer: $263k (12.0% below list) — sets the bar for market timing.
- Cap rate 6.7% vs local median 4.3% in Bethlehem — top-decile yield for the area; either an underpriced asset or a hidden risk that comps aren't pricing in. Stress-test before assuming the spread holds.
Location & tenants
- Location reads 82/100 on livability (#138 in PA, #1,122 nationally) — a professional / high-income tenant draw. Strengths: amenities A+, cost of living A+, housing A+; Watch: commute F.
- Bethlehem Area SD (urban): math 31% / reading 49% proficiency, ranked #342 of 539 in PA (top 64%) — families likely to look elsewhere, expect single-tenant / working-renter base with shorter leases.
- Market conditions: Rents flat; 103 active listings in the ZIP; 6 comparable units currently listed for rent nearby; rentals at typical pace (median 24d on market — plan ~3-4 weeks tenant-placement turnaround); solid renter incomes; 765 units permitted in Lehigh County in 2024 (286 in 5+ unit buildings).
- At $2,936/mo this rent would consume 47% of the median local household income ($75k/yr) (locally 1361% of renters already pay >50% of income on rent) — very limited rent-growth headroom before tenants either downsize or default.
Forward outlook
- Local home prices are declining (-3.0%/yr); year-one equity from $2k of loan paydown is wiped out by about $9k of value loss. Plan a longer hold.
- Lehigh County population projected at +21% by 2050 — long-run rental-demand tailwind backs the buy-and-hold thesis.
Negotiation context
- It's been on market 285 days — a 12% lower offer ($263k) is reasonable based on typical stale-listing flexibility.
- Current owner paid $65k; list at $299k implies a 360% gain — meaningful room to come down on a strong offer.
Risks & watch-outs
- Watch-outs: built in 1920 — expect roof / HVAC / electrical / plumbing capex.
- Climate carrying-cost: extreme-heat days projected 7→15/yr by 2055 (HVAC capex compounding) — expect insurance premiums to compound above CPI over the hold.
Questions for the listing agent
- It's been on market 285 days. Have you received any prior offers? Is the seller open to a 12% concession, seller financing, or rate buy-down credit?
- Built in 1920 — when were the roof, HVAC, electrical panel, plumbing, and water heater last replaced?
- Why hasn't it sold? Are there any deal-killer items the seller is aware of (foundation, flood, title, zoning, code violations)?
- Is there a deadline driving the sale (1031 exchange, divorce, estate, relocation)? That informs how much negotiation room exists.
- Schools are B-rated — typically a magnet for longer-tenancy family renters. What's the average tenant stay here, and is there a school-zone premium baked into asking?
- What's the average days-on-market for RENTAL listings here right now (not sales)? A rising rental-DOM trend means longer vacancies and softer asking-rent achievability than the comps imply.
- What's the recent tenant-quality profile in this submarket — average credit score on applications, eviction rate, late-payment / NSF rate, and stable-employment percentage? A property-management company in the area should have these aggregated.
- How much new for-sale + rental construction is in the pipeline within 1–3 miles? Heavy new supply typically softens prices + rents 12–24 months out; constrained supply supports both.
Investment metrics
- 1% rule
- 0.98% ✗
- Cap rate
- 6.73%
- Cash-on-cash
- 1.57%
- DSCR
- 1.07
- GRM
- 8.5
CMA / ARV
- ARV (median comp)
- $425,005
- List price
- $299,000
- Delta
- -29.65%
- Verdict
- UNDERPRICED
- Comps
- 20 within 1.0 mi
Show comp detail 9 sales within ~0.75 mi
| Address | Dist | Beds/Ba | Sqft | Sold | Price | $/sf | Match |
|---|---|---|---|---|---|---|---|
| 1104 Prospect Ave | 0.18mi | 5/2.5 (+1) | 2,942 (+5%) | 12mo | $611,480 | $208 | 67 |
| 1130 Spring St | 0.34mi | 4/2.0 | 2,540 (-10%) | 4mo | $320,000 | $126 | 65 |
| 1133 Prospect Ave | 0.24mi | 4/2.5 | 2,636 (-6%) | 20mo | $526,000 | $200 | 60 |
| 423 1St Ave | 0.51mi | 4/1.5 | 2,875 (+2%) | 13mo | $475,000 | $165 | 59 |
| 1306 W Market St | 0.30mi | 3/2.0 (-1) | 3,092 (+10%) | 8mo | $555,000 | $179 | 57 |
| 125 W Fairview St | 0.75mi | 4/2.0 | 2,650 (-6%) | 9mo | $417,000 | $157 | 48 |
| 1442 Stanford | 0.73mi | 3/2.5 (-1) | 2,840 (+1%) | 12mo | $475,000 | $167 | 46 |
| 80 W Market St | 0.73mi | 3/3.0 (-1) | 2,765 (-2%) | 20mo | $795,000 | $288 | 38 |
| 282 13th Ave | 0.48mi | 5/3.0 (+1) | 2,400 (-14%) | 12mo | $300,000 | $125 | 34 |
Match score weights: distance 35% · size 25% · config 20% · recency 20%. Top-matched comps best support the ARV.
Projected returns pro-forma
-3.0% appreciation · 0.85% rent growth · sell at horizon
- IRR
- -16.4%
- Equity multiple
- 0.43×
- Total profit
- $-47,545
- Equity at exit
- $44,582
- IRR
- -12.7%
- Equity multiple
- 0.33×
- Total profit
- $-56,297
- Equity at exit
- $25,852
Cash invested: $83,720 (down + closing). Projections, not guarantees.
Landlord ↔ Tenant lean methodology
- Overall (STATE)
- 62 Landlord-Friendly
- State Pennsylvania
- 62 Landlord-Friendly · EVEN
- County
- — inherits STATE
- City
- — inherits STATE
ZIP-level market 18018
- Rents YoY
- 0.8%
- Active inventory
- 103
- Price-to-rent
- 8.5×
Monthly cashflow live
- Estimated rent
- $2,936 high interval (Pro) →
- Mortgage (P&I)
- −$1,568
- Tax from tax record
- −$517 /mo · $6,203/yr
- Insurance
- −$125
- HOA
- −$0
- Vacancy / Maint / Mgmt
- −$617
- Net cashflow
- $110
Break-even live
UW: 25.0% down · 7.5% · 30yr · 1.5% tax · 5.0% vac · 8.0% maint · 8.0% mgmt
Financing live
Cash to close
- Down payment
- $74,750
- Closing costs
- $8,970
- Reserves months
- —
- Total cash needed
- —
Loan-product check · same deal, 3 products live
Conventional
25% down · 7.5% · 30yr
- Down + closing
- —
- Monthly P&I
- —
- Monthly cashflow
- —
- DSCR
- —
- Eligible?
- —
Personal DTI + credit; lowest rate.
DSCR
20% down · 8.5% · 30yr
- Down + closing
- —
- Monthly P&I
- —
- Monthly cashflow
- —
- DSCR
- —
- Eligible?
- —
No personal income docs; deal must DSCR.
Hard money
10% down · 12.0% · 12mo
- Down + closing
- —
- Monthly P&I
- —
- Monthly cashflow
- —
- DSCR
- —
- Eligible?
- —
Short-term bridge; refi at stabilization.
Rent comps 6 comps
| Address | Beds | Baths | Sqft | Rent | $/sqft | DOM | Units | Dist |
|---|---|---|---|---|---|---|---|---|
| 522 W Union Blvd Bethlehem, PA | 5.0 | 1.5 | 2272 | $2,700 | $1.19 | 43d | 1 | 0.34mi |
| 520 W Union Blvd Unit 2 Bethlehem, PA | 3.0 | 1.0 | 2225 | $2,150 | $0.97 | 23d | 1 | 0.34mi |
| 401 W Broad St Bethlehem, PA | 5.0 | 2.0 | 2694 | $4,000 | $1.48 | 2d | 1 | 0.35mi |
| 917 Center St Bethlehem, PA | 5.0 | 1.0 | 2300 | $2,500 | $1.09 | 23d | 1 | 1.08mi |
| 435 Montclair Ave Bethlehem, PA | 5.0 | 2.0 | 2051 | $3,375 | $1.65 | 43d | 1 | 1.10mi |
| 830 Montclair Ave Unit 1 Bethlehem, PA | 5.0 | 2.0 | 2000 | $2,999 | $1.50 | 2d | 1 | 1.41mi |
Listing history 17 events
-
2026-06-18days on market $299,000 Active 285 DOM
-
2026-06-17days on market $299,000 Active 284 DOM
-
2026-06-16days on market $299,000 Active 283 DOM
-
2026-06-15days on market $299,000 Active 282 DOM
-
2026-06-14days on market $299,000 Active 280 DOM
-
2026-06-10days on market $299,000 Active 277 DOM
-
2026-06-09days on market $299,000 Active 276 DOM
-
2026-06-08days on market $299,000 Active 275 DOM
-
2026-06-07days on market $299,000 Active 274 DOM
-
2026-06-03days on market $299,000 Active 270 DOM
-
2026-06-02days on market $299,000 Active 269 DOM
-
2026-06-01days on market $299,000 Active 268 DOM
-
2026-05-31days on market $299,000 Active 267 DOM
-
2026-05-31days on market $299,000 Active 266 DOM
-
2026-05-13price $299,000 446-char remark
Show marketing remark (446 chars)
Welcome to 901 West Broad Street! Located in West Bethlehem and only minutes from Historic Downtown Bethlehem, this property offers convenience, walkability, and historic charm all in one. From the historic Bethlehem Rose Garden, to the numerous cafes, restaurants and amenities found within close proximity, all with easy access to highways i-78 and i-22. This is the perfect location to experience what Bethlehem has to offer. Being sold As-Is.
-
2025-09-06$320,000 Active 446-char remark
Show marketing remark (446 chars)
Welcome to 901 West Broad Street! Located in West Bethlehem and only minutes from Historic Downtown Bethlehem, this property offers convenience, walkability, and historic charm all in one. From the historic Bethlehem Rose Garden, to the numerous cafes, restaurants and amenities found within close proximity, all with easy access to highways i-78 and i-22. This is the perfect location to experience what Bethlehem has to offer. Being sold As-Is.
-
1999-08-24soldstatus $65,000
ⓘ Source: listings_history table (triggers on properties + properties_extension) + one-shot
backfill from property_details.listing_events for pre-trigger history.
Tax reassessment forecast PA · Partial reset (capped growth)
- Current annual tax
- $6,203 · $517/mo
- Projected year-2 tax
- $6,203 · $517/mo
- Expected delta
- $0/yr ($0/mo · 0.0%)
ⓘ Screening estimate from a state-policy table — verify with the county assessor before closing.
Climate risk First Street
- Flood 1/10 Low FEMA zone X (unshaded) · 0% chance over 30 yrs
- Wildfire 4/10 Moderate
- Heat 5/10 Major 7 d/yr ≥100°F today · 15 d/yr by 30 yrs out
- Wind 4/10 Moderate 17% chance of damaging wind over 30 yrs
- Air quality 4/10 Moderate 3 unhealthy d/yr today · 6 by 30 yrs out
Nearby sold comps map
Loading sold comps map…
Walkable amenities ~0.75 mi
Loading nearby amenities…
Taxation est. · year 1
- Rental income
- $35,229
- − Mortgage interest
- −$16,749
- − Property taxes
- −$6,203
- − Insurance
- −$1,495
- − Repairs & maintenance
- −$2,818
- − Management
- −$2,818
- − Depreciation
- −$8,698
- Taxable loss
- −$3,552
- Est. tax savings @ 24.0%
- +$853
- After-tax cash flow
- $2,170/yr
For passive investors: Depreciation is non-cash, so a rental often shows a tax loss while cash-flowing — sheltering income. Rental losses are passive: they offset passive income freely, and up to $25,000/yr can offset ordinary (W-2) income if you actively participate and your MAGI is under $100k (phasing out to $0 by $150k); unused losses carry forward. On sale, claimed depreciation is recaptured at up to 25%, and gains may owe capital-gains tax (a 1031 exchange can defer both). Figures are a year-1 estimate at your 24.0% rate — not tax advice; consult a CPA.
Schools (NCES district)
- District
- Bethlehem Area SD
- NCES district ID
- 4203570
- Math proficiency
- 31% ▼ -2.00%
- Reading proficiency
- 49% ▼ -6.00%
- Median HH income
- $55,124
- Composite
- 34.92/100
- National rank
- #5068
- State rank
- #342 of 539 in PA
Livability — Bethlehem
- Score
- 82/100
- State rank
- #138
- US rank
- #1122
Category grades
Schools grade is shown separately in the Schools card above.
Census & demographics
- Census place
- Bethlehem, PA
- County
- Lehigh County · 333,019 people
- City population
- 129,661
- Metro
- Allentown-Bethlehem-Easton, PA-NJ
- Population (ZIP)
- 32,965
- Household income
- $75,417
- Rent vs Own
- Severe rent burden
- 1361.0
Population outlook (Lehigh County) Hauer SSP2
- Today (2025)
- 392,957 people
- By 2030
- 408,319 · +3.9%
- By 2040
- 440,007 · +12.0%
- By 2050
- 475,940 · +21.1%
- By 2075
- 590,448 · +50.3%
- By 2100
- 690,314 · +75.7%
Race, ethnicity, and origin ACS 2023
- Neighborhood character
- Majority White (65%)
- Race & ethnicity
- White 65% Hispanic / Latino 24% Two or more races 10% Black 6% Asian 2%
- Hispanic origin (detail)
- Mexican 2% Puerto Rican 14% Dominican 3%
- Common ancestry
- Romanian 4% Italian 2% Polish 2%
- Foreign-born
- 9% · Canada, Jamaica, China
- Languages at home
- 81% English-only · Spanish 15% Other Indo-European 2%
Political lean MEDSL · Lehigh
- 2024 margin
- Toss-up / Even · D 50.7% · R 48.0% · Other 1.2%
- 2008→2024 swing
- -12.9pp toward R · 2008: 15.6pp · 2024: 2.7pp
- All cycles
- 2024: D+2.7 2020: D+7.6 2016: D+4.4 2012: D+7.5 2008: D+15.6
Not yet ingested
- Civics
- —
Market trends
- HPI YoY
- ▼ -211.46%
- Current HPI
- 301.1699
- Rent YoY
- ▲ 0.85%
- Metro
- Allentown-Bethlehem-Easton, PA-NJ
- State GDP YoY
- ▲ 1.68%
- F500 in state
- 34
Industry mix (Fortune 500 HQ in PA)
| Industry | F500 HQs | Revenue |
|---|---|---|
| Healthcare | 2 | $309B |
|
||
| Insurance | 2 | $27B |
|
||
| Telecommunications / Media | 1 | $124B |
|
||
| Industrial Distribution | 1 | $22B |
|
||
| Financial Services | 1 | $20B |
|
||
| Chemicals / Materials | 1 | $18B |
|
||
Price history
+360.0% since first listed3 events — show timeline
- 2026-05-13 Price Changed $299,000 GLVRMLS
- 2025-09-06 Listed $320,000 GLVRMLS
- 1999-08-24 Sold (Public Records) $65,000 Public Records
Property tax history
+1.6%/yrLatest (2026): $6,203 · +2.4% YoY. Source: county tax records.
Cash-flow waterfall
monthlySold comps — $/sqft
last 12 mo · ≤1 miLoading sold comps…