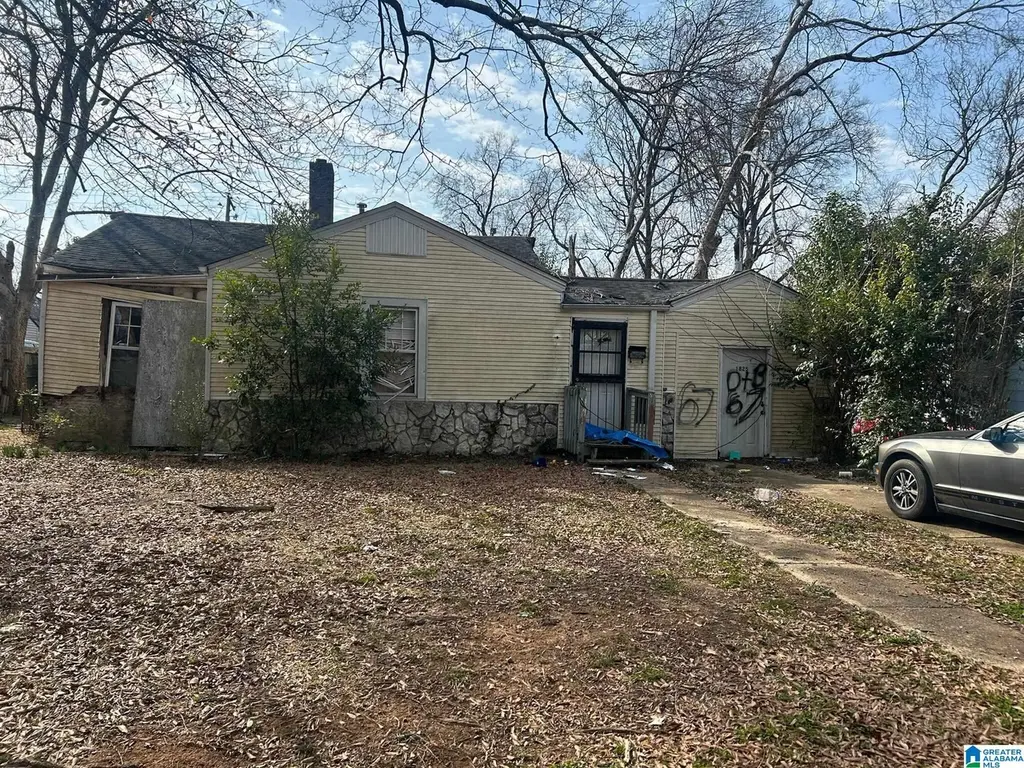
1825 Monroe Ave SW · Birmingham, AL
Flood risk 1/10 · Minimal
- FEMA flood zone
- X (unshaded)
- Chance of flooding over 30 yrs
- 0.0%
- Est. flood insurance / yr
- $507 – $1,088
Fire risk 1/10 · Minimal
- Est. fire insurance / yr
- $916 – $1,700
Heat risk 6/10 · Moderate
- Hot days now (above 106°F)
- 7 days/yr
- Hot days in 30 yrs
- 19 days/yr
Wind risk 6/10 · Moderate
- Chance of severe wind over 30 yrs
- 27.0%
Air-quality risk 4/10 · Minor
- Unhealthy air days now
- 5 days/yr
- Unhealthy air days in 30 yrs
- 5 days/yr
Risk factors via First Street. Map © Google.
Why this score? — see what drove the D grade
The composite is a weighted blend of 9 inputs, each scored 0–100. Each bar is that input's sub-score; the figure is the points it added to the 100-point composite (weight × sub-score).
- Cash flow +15.0/30.0
- ARV discount +7.5/15.0
- 1% rule +5.0/10.0
- DSCR +5.0/10.0
- Livability +3.4/5.0
- Rent growth +2.5/5.0
- Condition / age +2.5/5.0
- Schools +0.9/10.0
- Appreciation +0.0/10.0
$29,999
🖨 Deal sheet (PDF) 📄 Offer letter ✓ Due diligence
Listing remarks MLS
This 3-bedroom, 1-bath home in Birmingham is a full rehab opportunity with serious upside potential. Bring your contractor and your vision — this property needs a complete renovation but presents a strong ARV potential in a thriving market.
Key facts
- 8,276 sq ft lot
- Built 1947
- Listed 118 days
Neighborhood map
What this means for you Summary
Snapshot
- This is a 3-bed/1.0-bath single-family listed at $30k.
Deal economics
- At list price, monthly cash flow is $813 ($10k/yr) — positive.
- The deal already cash-flows at list — no discount required.
- Meets the 1% rule at list price ($1k rent vs $30k).
- Recommended offer: $27k (9.0% below list) — sets the bar for market timing.
- Cap rate 38.8% vs local median 6.2% in Birmingham — top-decile yield for the area; either an underpriced asset or a hidden risk that comps aren't pricing in. Stress-test before assuming the spread holds.
Location & tenants
- Location reads 67/100 on livability (#78 in AL) — a middle-class / working-renter tenant base. Strengths: commute A+, cost of living A+, housing A+; Watch: amenities C-, schools F, crime F.
- Birmingham City (urban): math 4% / reading 20% proficiency, ranked #116 of 129 in AL (top 90%) — low school quality limits family demand, transient renter base, plan for 1-2y turnover; 82% free/reduced lunch — lower-income household profile, screen leases tightly.
- Market conditions: Rents soft (-0.0%/yr); 152 active listings in the ZIP; 40 comparable units currently listed for rent nearby; rentals at typical pace (median 25d on market — plan ~3-4 weeks tenant-placement turnaround); 42% of comp listings sitting > 30 days — soft ceiling on asking rent; lower-income renter base — watch delinquency; 2,114 units permitted in Jefferson County in 2024 (556 in 5+ unit buildings).
- This rent runs 44% of the median local income ($35k/yr) — at the standard rent-burdened threshold; future hikes will face affordability resistance.
Forward outlook
- Local home prices are declining (-3.0%/yr); year-one equity from $207 of loan paydown is wiped out by about $900 of value loss. Plan a longer hold.
- Jefferson County population projected to shrink 4% by 2050 — rents likely to lag national; underwrite the cash flow, not the appreciation.
- At projected returns (-3.0% appreciation + 0.0% rent growth), your $8k cash investment doubles in ~1 year — after that, you're playing with house money.
Negotiation context
- It's been on market 118 days — a 9% lower offer ($27k) is reasonable based on typical stale-listing flexibility.
- 2 sale attempts since 13y ago; this cycle's ask has dropped $20k (40%) from the opening price — seller is motivated, your offer sets the floor, not the list.
- Current owner paid $9k; list at $30k implies a 231% gain — meaningful room to come down on a strong offer.
Risks & watch-outs
- Watch-outs: built in 1947 — expect roof / HVAC / electrical / plumbing capex.
- Climate carrying-cost: major wind risk, 27% chance of damaging wind over 30y; extreme-heat days projected 7→19/yr by 2055 (HVAC capex compounding) — expect insurance premiums to compound above CPI over the hold.
Questions for the listing agent
- It's been on market 118 days. Have you received any prior offers? Is the seller open to a 9% concession, seller financing, or rate buy-down credit?
- Built in 1947 — when were the roof, HVAC, electrical panel, plumbing, and water heater last replaced?
- Why hasn't it sold? Are there any deal-killer items the seller is aware of (foundation, flood, title, zoning, code violations)?
- Is there a deadline driving the sale (1031 exchange, divorce, estate, relocation)? That informs how much negotiation room exists.
- Schools are F-rated, which usually means shorter tenancies and higher turnover. Who's the typical renter profile here, and what's been the actual vacancy rate?
- Crime grade is F in this area — have there been break-ins, vandalism, or insurance claims at this property in the last 3 years? What carrier currently insures it and at what premium?
- The area grade is low — what's the realistic commute time and amenity access for the typical tenant pool here? Any planned neighborhood developments (good or bad) we should know about?
- What's the average days-on-market for RENTAL listings here right now (not sales)? A rising rental-DOM trend means longer vacancies and softer asking-rent achievability than the comps imply.
- What's the recent tenant-quality profile in this submarket — average credit score on applications, eviction rate, late-payment / NSF rate, and stable-employment percentage? A property-management company in the area should have these aggregated.
- How much new for-sale + rental construction is in the pipeline within 1–3 miles? Heavy new supply typically softens prices + rents 12–24 months out; constrained supply supports both.
Investment metrics
- 1% rule
- 4.25% ✓
- Cap rate
- 38.80%
- Cash-on-cash
- 116.11%
- DSCR
- 6.17
- GRM
- 2.0
CMA / ARV
- ARV (median comp)
- $65,710
- List price
- $29,999
- Delta
- -54.35%
- Verdict
- UNDERPRICED
- Comps
- 20 within 1.0 mi
Show comp detail 12 sales within ~0.75 mi
| Address | Dist | Beds/Ba | Sqft | Sold | Price | $/sf | Match |
|---|---|---|---|---|---|---|---|
| 1861 Woodland Ave SW | 0.08mi | 3/1.0 | 1,248 (-14%) | 10mo | $92,000 | $74 | 64 |
| 1437 Woodland Ave SW | 0.47mi | 3/1.0 | 1,369 (-6%) | 5mo | $53,000 | $39 | 64 |
| 1700 Lee Ave SW | 0.46mi | 3/2.0 | 1,586 (+9%) | 0mo | $177,000 | $112 | 60 |
| 1728 Princeton Ave SW | 0.40mi | 3/1.0 | 1,334 (-9%) | 10mo | $63,500 | $48 | 59 |
| 1629 Steiner Ave SW | 0.65mi | 2/1.0 (-1) | 1,476 (+1%) | 8mo | $72,000 | $49 | 56 |
| 1625 SW Alabama Ave | 0.33mi | 2/2.0 (-1) | 1,290 (-12%) | 2mo | $19,900 | $15 | 54 |
| 1936 Saint Charles Ct SW | 0.33mi | 4/1.5 (+1) | 1,600 (+10%) | 11mo | $95,000 | $59 | 52 |
| 4645 Avenue U | 0.67mi | 3/1.0 | 1,374 (-6%) | 9mo | $73,000 | $53 | 52 |
| 724 18th Pl SW | 0.67mi | 4/2.0 (+1) | 1,508 (+3%) | 4mo | $48,900 | $32 | 50 |
| 2908 Ensley Ave | 0.62mi | 3/2.0 | 1,558 (+7%) | 9mo | $60,000 | $39 | 48 |
| 213 SW 22nd St | 0.58mi | 3/1.0 | 1,260 (-14%) | 8mo | $110,000 | $87 | 44 |
| 201 21st St SW | 0.51mi | 3/2.0 | 1,258 (-14%) | 8mo | $30,000 | $24 | 43 |
Match score weights: distance 35% · size 25% · config 20% · recency 20%. Top-matched comps best support the ARV.
Projected returns pro-forma
-3.0% appreciation · 0.0% rent growth · sell at horizon
- IRR
- —
- Equity multiple
- 6.14×
- Total profit
- $43,180
- Equity at exit
- $4,473
- IRR
- —
- Equity multiple
- 11.70×
- Total profit
- $89,872
- Equity at exit
- $2,594
Cash invested: $8,400 (down + closing). Projections, not guarantees.
Landlord ↔ Tenant lean methodology
- Overall (STATE)
- 90 Strongly Landlord-Friendly
- State Alabama
- 90 Strongly Landlord-Friendly · R+15
- County
- — inherits STATE
- City
- — inherits STATE
ZIP-level market 35211
- Rents YoY
- -0.0%
- Active inventory
- 152
- Price-to-rent
- 2.0×
Monthly cashflow live
- Estimated rent
- $1,273 high interval (Pro) →
- Mortgage (P&I)
- −$157
- Tax from tax record
- −$24 /mo · $282/yr
- Insurance
- −$12
- HOA
- −$0
- Vacancy / Maint / Mgmt
- −$267
- Net cashflow
- $813
Break-even live
Sensitivity live
| Price | -10% $830 | -5% $821 | +0% $813 | +5% $804 | +10% $796 |
|---|---|---|---|---|---|
| Rent | -10% $712 | -5% $762 | +0% $813 | +5% $863 | +10% $913 |
| Rate | -1.0pp $828 | -0.5pp $820 | base $813 | +0.5pp $805 | +1.0pp $797 |
UW: 25.0% down · 7.5% · 30yr · 1.5% tax · 5.0% vac · 8.0% maint · 8.0% mgmt
Financing live
Cash to close
- Down payment
- $7,500
- Closing costs
- $900
- Reserves months
- —
- Total cash needed
- —
Loan-product check · same deal, 3 products live
Conventional
25% down · 7.5% · 30yr
- Down + closing
- —
- Monthly P&I
- —
- Monthly cashflow
- —
- DSCR
- —
- Eligible?
- —
Personal DTI + credit; lowest rate.
DSCR
20% down · 8.5% · 30yr
- Down + closing
- —
- Monthly P&I
- —
- Monthly cashflow
- —
- DSCR
- —
- Eligible?
- —
No personal income docs; deal must DSCR.
Hard money
10% down · 12.0% · 12mo
- Down + closing
- —
- Monthly P&I
- —
- Monthly cashflow
- —
- DSCR
- —
- Eligible?
- —
Short-term bridge; refi at stabilization.
Rent comps 40 comps
| Address | Beds | Baths | Sqft | Rent | $/sqft | DOM | Units | Dist |
|---|---|---|---|---|---|---|---|---|
| 1800 Woodland Ave SW Birmingham, AL | 4.0 | 1.0 | 1411 | $1,195 | $0.85 | 3d | 1 | 0.13mi |
| 1645 Woodland Ave SW Birmingham, AL | 4.0 | 2.0 | 1298 | $1,300 | $1.00 | 20d | 1 | 0.25mi |
| 504 Francis Pl SW Birmingham, AL | 3.0 | 2.0 | 1816 | $1,223 | $0.67 | 24d | 1 | 0.25mi |
| 1816 Saint Charles Ave SW Birmingham, AL | 3.0 | 1.0 | 1395 | $1,295 | $0.93 | 24d | 1 | 0.31mi |
| 1900 Saint Charles Ave SW Birmingham, AL | 4.0 | 2.0 | 1623 | $1,350 | $0.83 | 3d | 1 | 0.32mi |
| 1933 Saint Charles Ct SW Birmingham, AL | 3.0 | 1.0 | 1106 | $1,050 | $0.95 | 24d | 1 | 0.35mi |
| 1728 Princeton Ave SW Birmingham, AL | 4.0 | 2.0 | 1334 | $1,300 | $0.97 | 44d | 1 | 0.42mi |
| 1437 Woodland Ave SW Birmingham, AL | 3.0 | 1.0 | 1369 | $1,100 | $0.80 | 4d | 1 | 0.48mi |
| 1734 Lee Ave SW Birmingham, AL | 4.0 | 1.0 | 1142 | $1,150 | $1.01 | 20d | 1 | 0.48mi |
| 2028 Lee Ter SW Birmingham, AL | 2.0 | 1.0 | 884 | $695 | $0.79 | 44d | 1 | 0.53mi |
| 2133 47th Street Ensley Unit ENSLEY Birmingham, AL | 3.0 | 1.5 | 1308 | $1,300 | $0.99 | 44d | 1 | 0.59mi |
| 1501 Princeton Ave SW Birmingham, AL | 3.0 | 2.0 | 1260 | $1,350 | $1.07 | 45d | 1 | 0.59mi |
| 208 22nd St SW Birmingham, AL | 2.0 | 1.0 | 926 | $1,050 | $1.13 | 4d | 1 | 0.60mi |
| 2017 48th Street Ensley Birmingham, AL | 3.0 | 2.0 | 1383 | $1,250 | $0.90 | 44d | 1 | 0.60mi |
| 2026 Lee Ct SW Birmingham, AL | 3.0 | 1.0 | 1204 | $1,100 | $0.91 | 44d | 1 | 0.62mi |
| 2709 30th Street Ensley Birmingham, AL | 4.0 | 2.0 | 1410 | $1,323 | $0.94 | 3d | 1 | 0.68mi |
| 2329 30th Street Ensley Birmingham, AL | 2.0 | 1.0 | 917 | $990 | $1.08 | 24d | 1 | 0.69mi |
| 2216 Lee Ave SW Birmingham, AL | 3.0 | 1.0 | 902 | $900 | $1.00 | 24d | 1 | 0.69mi |
| 2421 29th Street Ensley Unit C Birmingham, AL | 2.0 | 1.0 | 950 | $703 | $0.74 | 24d | 1 | 0.72mi |
| 4636 Avenue T Unit T Birmingham, AL | 4.0 | 1.5 | 1842 | $1,500 | $0.81 | 2d | 1 | 0.75mi |
| 4813 Court S Birmingham, AL | 3.0 | 2.0 | 1118 | $1,125 | $1.01 | 44d | 1 | 0.75mi |
| 1220 Alabama Ave SW Birmingham, AL | 3.0 | 1.5 | 1175 | $1,350 | $1.15 | 44d | 1 | 0.76mi |
| 3017 Ensley Ave Birmingham, AL | 3.0 | 1.0 | 1540 | $1,400 | $0.91 | 2d | 1 | 0.76mi |
| 1228 Fulton Ave SW Birmingham, AL | 2.0 | 1.0 | 900 | $800 | $0.89 | 45d | 1 | 0.77mi |
| 2520 Avenue U Unit A Birmingham, AL | 4.0 | 1.0 | 1260 | $1,200 | $0.95 | 44d | 1 | 0.78mi |
| 1621 2nd Ct W Birmingham, AL | 3.0 | 1.0 | 1074 | $1,095 | $1.02 | 44d | 1 | 0.79mi |
| 1213 Alabama Ave SW Birmingham, AL | 4.0 | 2.0 | 1616 | $1,200 | $0.74 | 44d | 1 | 0.79mi |
| 1000 17th Pl SW Birmingham, AL | 3.0 | 2.0 | 1200 | $1,275 | $1.06 | 20d | 1 | 0.80mi |
| 4736 Court S Birmingham, AL | 3.0 | 1.5 | 1300 | $1,200 | $0.92 | 4d | 1 | 0.80mi |
| 4732 Court S Birmingham, AL | 3.0 | 1.0 | 1372 | $1,100 | $0.80 | 44d | 1 | 0.80mi |
| 4825 Avenue S Birmingham, AL | 3.0 | 1.0 | 1310 | $1,050 | $0.80 | 17d | 1 | 0.80mi |
| 1217 Fulton Ave SW Birmingham, AL | 4.0 | 2.0 | 1397 | $1,395 | $1.00 | 44d | 1 | 0.81mi |
| 4801 Avenue S Birmingham, AL | 3.0 | 1.0 | 1310 | $1,000 | $0.76 | 44d | 1 | 0.82mi |
| 4637 Court S Birmingham, AL | 3.0 | 1.0 | 1225 | $975 | $0.80 | 3d | 1 | 0.83mi |
| 4612 Terrace S Birmingham, AL | 3.0 | 1.0 | 1612 | $1,050 | $0.65 | 44d | 1 | 0.83mi |
| 1609 Jefferson Ave SW Birmingham, AL | 4.0 | 1.0 | 1572 | $1,300 | $0.83 | 4d | 1 | 0.84mi |
| 312 25th St SW Birmingham, AL | 4.0 | 1.0 | 1159 | $1,000 | $0.86 | 24d | 1 | 0.85mi |
| 3009 Prince Ave Birmingham, AL | 3.0 | 2.0 | 1176 | $1,095 | $0.93 | 24d | 1 | 0.85mi |
| 2519 Saint Charles Ave SW Birmingham, AL | 2.0 | 1.0 | 990 | $975 | $0.98 | 45d | 1 | 0.87mi |
| 2712 24th Street Ensley Unit ENSLEY Birmingham, AL | 3.0 | 1.0 | 1232 | $1,099 | $0.89 | 24d | 1 | 0.88mi |
Listing history 23 events
-
2026-06-18days on market $29,999 Active 118 DOM
-
2026-06-17days on market $29,999 Active 117 DOM
-
2026-06-16days on market $29,999 Active 116 DOM
-
2026-06-15days on market $29,999 Active 115 DOM
-
2026-06-13days on market $29,999 Active 113 DOM
-
2026-06-10days on market $29,999 Active 110 DOM
-
2026-06-09days on market $29,999 Active 109 DOM
-
2026-06-08days on market $29,999 Active 108 DOM
-
2026-06-07days on market $29,999 Active 107 DOM
-
2026-06-03days on market $29,999 Active 103 DOM
-
2026-06-02pricedays on market $29,999 Active 102 DOM
-
2026-06-01days on market $33,000 Active 101 DOM
-
2026-05-31days on market $33,000 Active 100 DOM
-
2026-04-28price $33,000 246-char remark
Show marketing remark (246 chars)
This 3-bedroom, 1-bath home in Birmingham is a full rehab opportunity with serious upside potential. Bring your contractor and your vision — this property needs a complete renovation but presents a strong ARV potential in a thriving market.
-
2026-04-21price $38,000 246-char remark
Show marketing remark (246 chars)
This 3-bedroom, 1-bath home in Birmingham is a full rehab opportunity with serious upside potential. Bring your contractor and your vision — this property needs a complete renovation but presents a strong ARV potential in a thriving market.
-
2026-04-15price $39,000 246-char remark
Show marketing remark (246 chars)
This 3-bedroom, 1-bath home in Birmingham is a full rehab opportunity with serious upside potential. Bring your contractor and your vision — this property needs a complete renovation but presents a strong ARV potential in a thriving market.
-
2026-03-16price $39,999 246-char remark
Show marketing remark (246 chars)
This 3-bedroom, 1-bath home in Birmingham is a full rehab opportunity with serious upside potential. Bring your contractor and your vision — this property needs a complete renovation but presents a strong ARV potential in a thriving market.
-
2026-03-09price $44,999 246-char remark
Show marketing remark (246 chars)
This 3-bedroom, 1-bath home in Birmingham is a full rehab opportunity with serious upside potential. Bring your contractor and your vision — this property needs a complete renovation but presents a strong ARV potential in a thriving market.
-
2026-03-03price $45,999 246-char remark
Show marketing remark (246 chars)
This 3-bedroom, 1-bath home in Birmingham is a full rehab opportunity with serious upside potential. Bring your contractor and your vision — this property needs a complete renovation but presents a strong ARV potential in a thriving market.
-
2026-02-20$49,999 Active 246-char remark
Show marketing remark (246 chars)
This 3-bedroom, 1-bath home in Birmingham is a full rehab opportunity with serious upside potential. Bring your contractor and your vision — this property needs a complete renovation but presents a strong ARV potential in a thriving market.
-
2014-01-07soldstatus $9,050 164-char remark
Show marketing remark (164 chars)
Great starter home or investment property. Please verify schools. . * * ALL OFFERS MUST SUBMITTED ON THE BANKS CONTRACT PLEASE CALL FOR A COPY OF THOSE FORMS. * *
-
2013-11-14$10,900 164-char remark
Show marketing remark (164 chars)
Great starter home or investment property. Please verify schools. . * * ALL OFFERS MUST SUBMITTED ON THE BANKS CONTRACT PLEASE CALL FOR A COPY OF THOSE FORMS. * *
-
1994-06-27soldstatus $38,000
ⓘ Source: listings_history table (triggers on properties + properties_extension) + one-shot
backfill from property_details.listing_events for pre-trigger history.
Tax reassessment forecast AL · Resets to sale price
- Current annual tax
- $282 · $24/mo
- Projected year-2 tax
- $282 · $24/mo
- Expected delta
- $0/yr ($0/mo · 0.0%)
ⓘ Screening estimate from a state-policy table — verify with the county assessor before closing.
Climate risk First Street
- Flood 1/10 Low FEMA zone X (unshaded) · 0% chance over 30 yrs
- Wildfire 1/10 Low
- Heat 6/10 Major 7 d/yr ≥106°F today · 19 d/yr by 30 yrs out
- Wind 6/10 Major 27% chance of damaging wind over 30 yrs
- Air quality 4/10 Moderate 5 unhealthy d/yr today · 5 by 30 yrs out
Nearby sold comps map
Loading sold comps map…
Walkable amenities ~0.75 mi
Loading nearby amenities…
Taxation est. · year 1
- Rental income
- $15,282
- − Mortgage interest
- −$1,680
- − Property taxes
- −$282
- − Insurance
- −$150
- − Repairs & maintenance
- −$1,223
- − Management
- −$1,223
- − Depreciation
- −$873
- Taxable income
- $9,851
- Est. tax owed @ 24.0%
- −$2,364
- After-tax cash flow
- $7,388/yr
For passive investors: Depreciation is non-cash, so a rental often shows a tax loss while cash-flowing — sheltering income. Rental losses are passive: they offset passive income freely, and up to $25,000/yr can offset ordinary (W-2) income if you actively participate and your MAGI is under $100k (phasing out to $0 by $150k); unused losses carry forward. On sale, claimed depreciation is recaptured at up to 25%, and gains may owe capital-gains tax (a 1031 exchange can defer both). Figures are a year-1 estimate at your 24.0% rate — not tax advice; consult a CPA.
Schools (NCES district)
- District
- Birmingham City
- NCES district ID
- 0100390
- Math proficiency
- 4% ▼ -17.00%
- Reading proficiency
- 20% ▼ -4.00%
- Median HH income
- $31,988
- Composite
- 9.49/100
- National rank
- #9850
- State rank
- #116 of 129 in AL
Livability — Birmingham
- Score
- 67/100
- State rank
- #78
- US rank
- #10412
Category grades
Schools grade is shown separately in the Schools card above.
Census & demographics
- Census place
- Birmingham, AL
- County
- Jefferson County · 527,445 people
- City population
- 210,422
- Metro
- Birmingham-Hoover, AL
- Population (ZIP)
- 24,924
- Household income
- $34,884
- Rent vs Own
- Severe rent burden
- 2161.0
Population outlook (Jefferson County) Hauer SSP2
- Today (2025)
- 669,185 people
- By 2030
- 669,694 · +0.1%
- By 2040
- 661,388 · -1.2%
- By 2050
- 643,086 · -3.9%
- By 2075
- 577,267 · -13.7%
- By 2100
- 474,758 · -29.1%
Race, ethnicity, and origin ACS 2023
- Neighborhood character
- Predominantly Black (77%)
- Race & ethnicity
- Black 77% White 10% Hispanic / Latino 10% Two or more races 4%
- Hispanic origin (detail)
- Mexican 7%
- Foreign-born
- 6% · Canada
- Languages at home
- 91% English-only · Spanish 8% French/Haitian/Cajun 1%
Political lean MEDSL · Jefferson
- 2024 margin
- D (+10.4) · D 54.6% · R 44.2% · Other 1.2%
- 2008→2024 swing
- +5.4pp toward D · 2008: 5.1pp · 2024: 10.4pp
- All cycles
- 2024: D+10.4 2020: D+13.2 2016: D+7.2 2012: D+6.0 2008: D+5.1
Not yet ingested
- Civics
- —
Market trends
- HPI YoY
- ▼ -49.29%
- Current HPI
- 91.2903
- Rent YoY
- ▬ -0.01%
- Metro
- Birmingham-Hoover, AL
- State GDP YoY
- ▲ 2.94%
- F500 in state
- 4
Industry mix (Fortune 500 HQ in AL)
| Industry | F500 HQs | Revenue |
|---|---|---|
| Financial Services | 1 | $8B |
|
||
| Healthcare | 1 | $5B |
|
||
Price history
-13.2% since first listed10 events — show timeline
- 2026-04-28 Price Changed $33,000 Greater Alabama MLS
- 2026-04-21 Price Changed $38,000 Greater Alabama MLS
- 2026-04-15 Price Changed $39,000 Greater Alabama MLS
- 2026-03-16 Price Changed $39,999 Greater Alabama MLS
- 2026-03-09 Price Changed $44,999 Greater Alabama MLS
- 2026-03-03 Price Changed $45,999 Greater Alabama MLS
- 2026-02-20 Listed $49,999 Greater Alabama MLS
- 2014-01-07 Sold (MLS) $9,050 Greater Alabama MLS
- 2013-11-14 Listed $10,900 Greater Alabama MLS
- 1994-06-27 Sold (Public Records) $38,000 Public Records
Property tax history
-9.9%/yrLatest (2025): $282 · +0.0% YoY. Source: county tax records.
Cash-flow waterfall
monthlySold comps — $/sqft
last 12 mo · ≤1 miLoading sold comps…