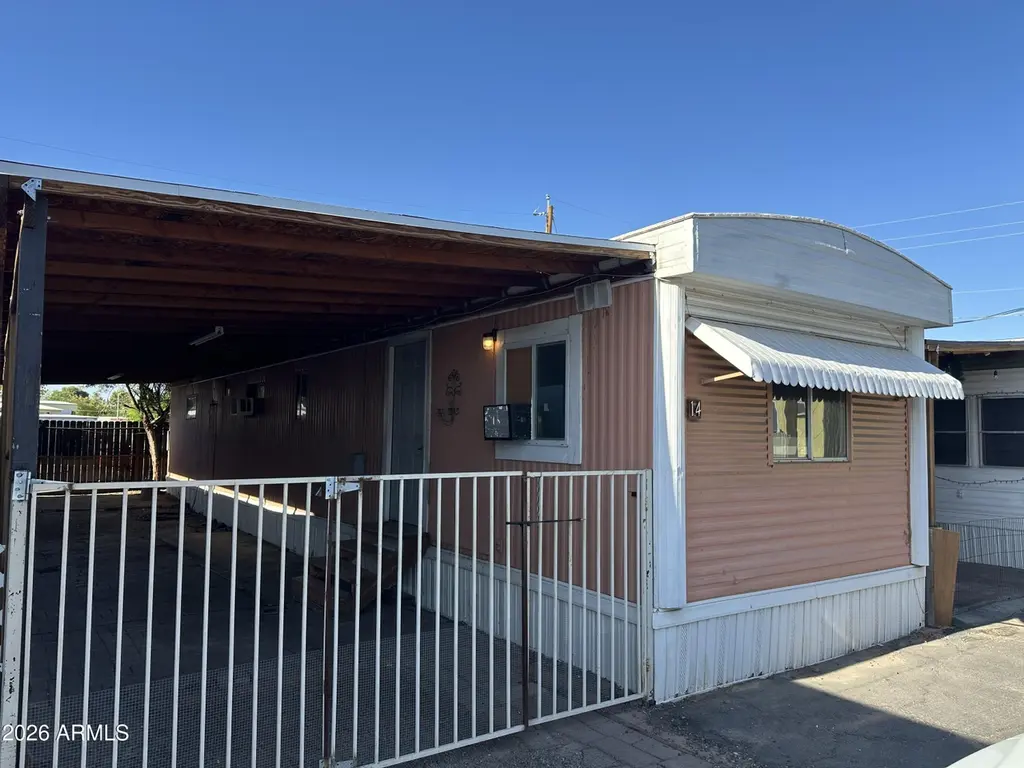
3140 W Glendale Ave #14 · Phoenix, AZ
Flood risk 1/10 · Minimal
- FEMA flood zone
- X (shaded)
- Chance of flooding over 30 yrs
- 0.0%
- Est. flood insurance / yr
- $507 – $1,088
Fire risk 1/10 · Minimal
- Est. fire insurance / yr
- $610 – $1,132
Heat risk 9/10 · Severe
- Hot days now (above 112°F)
- 7 days/yr
- Hot days in 30 yrs
- 19 days/yr
Wind risk 1/10 · Minimal
- Chance of severe wind over 30 yrs
- —
Air-quality risk 3/10 · Minor
- Unhealthy air days now
- 3 days/yr
- Unhealthy air days in 30 yrs
- 3 days/yr
Risk factors via First Street. Map © Google.
Why this score? — see what drove the D grade
The composite is a weighted blend of 9 inputs, each scored 0–100. Each bar is that input's sub-score; the figure is the points it added to the 100-point composite (weight × sub-score).
- Cash flow +15.0/30.0
- ARV discount +7.5/15.0
- 1% rule +5.0/10.0
- DSCR +5.0/10.0
- Livability +3.8/5.0
- Schools +2.3/10.0
- Condition / age +2.2/5.0
- Rent growth +1.7/5.0
- Appreciation +0.0/10.0
$28,000
🖨 Deal sheet 📄 Offer letter ✓ Due diligence
Listing remarks
Lots of potential in this 3 bed 1.5 bathroom manufactured home with lots of parking, close to freeways and central phx. Lot does allow pets at no additional charge. This is not an age restricted community.
Key facts
- Close to freeways
- Allows pets
- Lots of parking
Tags
Property features AI
Finance
- Other: Directions: Just west of 31st Ave and Glendale, on the north side of the road.
- HOA & community: Land lease of $725 monthly; Association fee includes: other (see remarks)
Exterior
- Parking: 2 covered parking spaces; 2 carport spaces
- Utilities: City water; Public sewer; 220V in kitchen (electric)
- Home design: Manufactured/Mobile housing; Leasehold ownership
- Construction: Metal siding construction; Other roof; Building area reported by owner
- Exterior features: Metal siding; Other roof; Other fencing
Interior
- Kitchen: 220V outlet in kitchen; Refrigerator; Disposal
- Bedrooms: 3 possible bedrooms
- Bathrooms: 1 full bathroom; 1 half bathroom
- Heating & cooling: Window/wall cooling unit; Heating: see remarks
- Interior features: Eat-in kitchen; Refrigerator; Disposal
- Laundry & utility: Washer/dryer hookup only
Neighborhood map
What this means for you Summary
Snapshot
- This is a 3-bed/1.5-bath manufactured listed at $28k. Condition is rated fair.
Deal economics
- At list price, monthly cash flow is $806 ($10k/yr) — positive.
- The deal already cash-flows at list — no discount required.
- Meets the 1% rule at list price ($1k rent vs $28k).
- Recommended offer: $27k (3.0% below list) — sets the bar for market timing.
- Cap rate 40.8% vs local median 3.3% in Phoenix — top-decile yield for the area; either an underpriced asset or a hidden risk that comps aren't pricing in. Stress-test before assuming the spread holds.
Location & tenants
- Location reads 75/100 on livability (#16 in AZ, #3,924 nationally) — a middle-class / working-renter tenant base. Strengths: amenities A+, commute A+, housing A+; Watch: health & safety C-, crime F.
- Glendale Union High School District (4285) (urban): math 23% / reading 31% proficiency, ranked #130 of 249 in AZ (top 52%) — low school quality limits family demand, transient renter base, plan for 1-2y turnover.
- Zoned schools: Washington High School (math 21% / reading 26%, grade F, #206 of 381 statewide, top 54%, 1,756 students, 60% FRL).
- Market conditions: Rents falling (-3.0%/yr); 117 active listings in the ZIP; 19 comparable units currently listed for rent nearby; rentals leasing fast (median 1d on market — plan ~1-2 weeks tenant-placement turnaround); 36,011 units permitted in Maricopa County in 2024 (12,801 in 5+ unit buildings).
Forward outlook
- Local home prices are declining (-3.0%/yr); year-one equity from $194 of loan paydown is wiped out by about $840 of value loss. Plan a longer hold.
- Maricopa County population projected at +38% by 2050 — long-run rental-demand tailwind backs the buy-and-hold thesis.
- At projected returns (-3.0% appreciation + 0.0% rent growth), your $8k cash investment doubles in ~1 year — after that, you're playing with house money.
Negotiation context
- It's been on market 43 days — a 3% lower offer ($27k) is reasonable based on typical stale-listing flexibility.
Risks & watch-outs
- Climate carrying-cost: extreme-heat days projected 7→19/yr by 2055 (HVAC capex compounding) — expect insurance premiums to compound above CPI over the hold.
Questions for the listing agent
- It's been on market 43 days. Have you received any prior offers? Is the seller open to a 3% concession, seller financing, or rate buy-down credit?
- Have any recent inspections been done? Can we get a copy of the seller's disclosures and any deferred-maintenance estimates?
- Built in 1967 — when were the roof, HVAC, electrical panel, plumbing, and water heater last replaced?
- Is there a deadline driving the sale (1031 exchange, divorce, estate, relocation)? That informs how much negotiation room exists.
- Crime grade is F in this area — have there been break-ins, vandalism, or insurance claims at this property in the last 3 years? What carrier currently insures it and at what premium?
- The area grade is low — what's the realistic commute time and amenity access for the typical tenant pool here? Any planned neighborhood developments (good or bad) we should know about?
- What's the average days-on-market for RENTAL listings here right now (not sales)? A rising rental-DOM trend means longer vacancies and softer asking-rent achievability than the comps imply.
- What's the recent tenant-quality profile in this submarket — average credit score on applications, eviction rate, late-payment / NSF rate, and stable-employment percentage? A property-management company in the area should have these aggregated.
- How much new for-sale + rental construction is in the pipeline within 1–3 miles? Heavy new supply typically softens prices + rents 12–24 months out; constrained supply supports both.
Investment metrics
- 1% rule
- 4.52% ✓
- Cap rate
- 40.82%
- Cash-on-cash
- 123.32%
- DSCR
- 6.49
- GRM
- 1.8
CMA / ARV
No comps found within radius.
Projected returns pro-forma
-3.0% appreciation · 0.0% rent growth · sell at horizon
- IRR
- —
- Equity multiple
- 6.50×
- Total profit
- $43,088
- Equity at exit
- $4,175
- IRR
- —
- Equity multiple
- 12.40×
- Total profit
- $89,347
- Equity at exit
- $2,421
Cash invested: $7,840 (down + closing). Projections, not guarantees.
Landlord ↔ Tenant lean methodology
- Overall (STATE)
- 87 Strongly Landlord-Friendly
- State Arizona
- 87 Strongly Landlord-Friendly · R+3
- County
- — inherits STATE
- City
- — inherits STATE
ZIP-level market 85051
- Home prices YoY
- -22.4%
- Rents YoY
- -3.0%
- Active inventory
- 117
- Price-to-rent
- 1.8×
Monthly cashflow live
- Estimated rent
- $1,265 high interval (Pro) →
- Mortgage (P&I)
- −$147
- Tax est. 1.5%
- −$35 /mo · $420/yr
- Insurance
- −$12
- HOA
- −$0
- Vacancy / Maint / Mgmt
- −$266
- Net cashflow
- $806
Break-even live
UW: 25.0% down · 7.5% · 30yr · 1.5% tax · 5.0% vac · 8.0% maint · 8.0% mgmt
Financing live
Cash to close
- Down payment
- $7,000
- Closing costs
- $840
- Reserves months
- —
- Total cash needed
- —
Loan-product check · same deal, 3 products live
Conventional
25% down · 7.5% · 30yr
- Down + closing
- —
- Monthly P&I
- —
- Monthly cashflow
- —
- DSCR
- —
- Eligible?
- —
Personal DTI + credit; lowest rate.
DSCR
20% down · 8.5% · 30yr
- Down + closing
- —
- Monthly P&I
- —
- Monthly cashflow
- —
- DSCR
- —
- Eligible?
- —
No personal income docs; deal must DSCR.
Hard money
10% down · 12.0% · 12mo
- Down + closing
- —
- Monthly P&I
- —
- Monthly cashflow
- —
- DSCR
- —
- Eligible?
- —
Short-term bridge; refi at stabilization.
Rent comps 19 comps
| Address | Beds | Baths | Sqft | Rent | $/sqft | DOM | Units | Dist |
|---|---|---|---|---|---|---|---|---|
| 7232 N 27th Ave Phoenix, AZ | 1.0–2.0 | 1.0 | 750 | $1,200 | $1.60 | 1d | 5 | 0.61mi |
| 6805 N 27th Ave Unit 206 Phoenix, AZ | 2.0 | 1.0 | 640 | $1,143 | $1.79 | 1d | 1 | 0.66mi |
| 6805 N 27th Ave Unit 321 Phoenix, AZ | 2.0 | 1.0 | 640 | $995 | $1.55 | 1d | 1 | 0.66mi |
| 6801 N 25th Dr Phoenix, AZ | 1.0–2.0 | 1.0 | 750 | $1,199 | $1.60 | 1d | 1 | 0.81mi |
| 6721 N 25th Dr Phoenix, AZ | 2.0 | 1.0 | 750 | $950 | $1.27 | 1d | 1 | 0.83mi |
| 2512 W Ocotillo Rd Phoenix, AZ | 2.0 | 1.0 | 750 | $899 | $1.20 | 5d | 1 | 0.83mi |
| 2520 W McLellan Blvd Phoenix, AZ | 2.0–3.0 | 1.0 | 800 | $1,248 | $1.56 | 1d | 6 | 0.83mi |
| 2502 W Ocotillo Rd Phoenix, AZ | 1.0–2.0 | 1.0 | 650 | $1,499 | $2.31 | 1d | 2 | 0.85mi |
| 2501 W Ocotillo Rd Phoenix, AZ | 1.0–2.0 | 1.0 | 740 | $845 | $1.14 | 1d | 4 | 0.87mi |
| 2540 W Maryland Ave Phoenix, AZ | 1.0–2.0 | 1.0 | 725 | $1,449 | $2.00 | 1d | 2 | 0.89mi |
| 6131 N 27th Ave Phoenix, AZ | 2.0 | 1.0–2.0 | 661 | $1,142 | $1.73 | 1d | 28 | 1.06mi |
| 3221 W El Camino Dr Phoenix, AZ | 2.0 | 1.0–2.0 | 650 | $1,403 | $2.16 | 1d | 32 | 1.24mi |
| 4141 W Glendale Ave Phoenix, AZ | 2.0 | 1.0–2.0 | 589 | $1,626 | $2.76 | 1d | 20 | 1.25mi |
| 8135 N 35th Ave Phoenix, AZ | 1.0–2.0 | 1.0–2.0 | 750 | $1,515 | $2.02 | 1d | 36 | 1.29mi |
| 2020 W Glendale Ave Phoenix, AZ | 1.0–2.0 | 1.0–2.0 | 802 | $1,300 | $1.62 | 1d | 6 | 1.42mi |
| 7532 N 21st Ave Unit 2 Phoenix, AZ | 2.0 | 1.0 | 730 | $899 | $1.23 | 1d | 1 | 1.43mi |
| 7532 N 21st Ave Phoenix, AZ | 2.0 | 1.0 | 730 | $950 | $1.30 | 17d | 1 | 1.43mi |
| 6027 N 23rd Ave Phoenix, AZ | 1.0–3.0 | 1.0–2.0 | 995 | $1,555 | $1.56 | 1d | 1 | 1.46mi |
| 7102 N 43rd Ave Glendale, AZ | 2.0 | 1.0 | 537 | $1,475 | $2.74 | 1d | 30 | 1.49mi |
Listing history 16 events
-
2026-06-18days on market $28,000 Active 43 DOM
-
2026-06-17days on market $28,000 Active 42 DOM
-
2026-06-16days on market $28,000 Active 41 DOM
-
2026-06-15days on market $28,000 Active 40 DOM
-
2026-06-13days on market $28,000 Active 38 DOM
-
2026-06-09days on market $28,000 Active 34 DOM
-
2026-06-08days on market $28,000 Active 33 DOM
-
2026-06-07days on market $28,000 Active 32 DOM
-
2026-06-04days on market $28,000 Active 29 DOM
-
2026-06-03days on market $28,000 Active 28 DOM
-
2026-06-02days on market $28,000 Active 27 DOM
-
2026-06-01days on market $28,000 Active 26 DOM
-
2026-05-31days on market $28,000 Active 25 DOM
-
2026-05-17price $28,000
-
2026-05-10price $30,000
-
2026-05-06$35,000 Active
ⓘ Source: listings_history table (triggers on properties + properties_extension) + one-shot
backfill from property_details.listing_events for pre-trigger history.
Climate risk First Street
- Flood 1/10 Low FEMA zone X (shaded) · 0% chance over 30 yrs
- Wildfire 1/10 Low
- Heat 9/10 Extreme 7 d/yr ≥112°F today · 19 d/yr by 30 yrs out
- Wind 1/10 Low
- Air quality 3/10 Moderate 3 unhealthy d/yr today · 3 by 30 yrs out
Nearby sold comps map
Loading sold comps map…
Walkable amenities ~0.75 mi
Loading nearby amenities…
Taxation est. · year 1
- Rental income
- $15,177
- − Mortgage interest
- −$1,568
- − Property taxes
- −$420
- − Insurance
- −$140
- − Repairs & maintenance
- −$1,214
- − Management
- −$1,214
- − Depreciation
- −$815
- Taxable income
- $9,806
- Est. tax owed @ 24.0%
- −$2,353
- After-tax cash flow
- $7,315/yr
For passive investors: Depreciation is non-cash, so a rental often shows a tax loss while cash-flowing — sheltering income. Rental losses are passive: they offset passive income freely, and up to $25,000/yr can offset ordinary (W-2) income if you actively participate and your MAGI is under $100k (phasing out to $0 by $150k); unused losses carry forward. On sale, claimed depreciation is recaptured at up to 25%, and gains may owe capital-gains tax (a 1031 exchange can defer both). Figures are a year-1 estimate at your 24.0% rate — not tax advice; consult a CPA.
Condition & rehab AI · 5 photos
This 3-bedroom, 1.5-bathroom manufactured home requires moderate repairs and maintenance to improve its condition and value. Painting the exterior siding and updating the kitchen and bathroom can significantly enhance its appeal and marketability.
Repairs flagged
- Major roof — Exposed wooden beams and siding suggest potential water damage or wear.
- Major exterior siding — Metal siding may need repainting or replacement.
- Minor interior walls — Painted walls appear to be in good condition but may need touch-ups.
- Minor kitchen cabinets — Wooden cabinets appear to be in good condition but may need cleaning.
- Minor bathroom fixtures — Standard fixtures in the bathroom may need cleaning or minor repairs.
- Minor HVAC system — Standard appliances and fixtures may need cleaning or minor repairs.
- Minor landscaping — Simple landscaping in front of the home may need some maintenance or updates.
Value-add opportunities
- Resale Painting the exterior siding — Fresh paint can significantly improve curb appeal and home value.
- Resale Updating the kitchen cabinets — Modernizing the kitchen can attract more buyers.
- Resale Upgrading the bathroom fixtures — Modern fixtures can enhance the home's appeal and functionality.
- Rental Upgrading HVAC system — A more efficient HVAC system can attract renters and reduce utility costs.
- Both Landscaping improvements — A well-maintained and aesthetically pleasing landscape can increase both resale and rental value.
Renovation cost estimate screening
| Repair item | Severity | Est. cost |
|---|---|---|
| roof · Exposed wooden beams and siding suggest potential water damage or wear. | Major | $15,000–50,000 |
| exterior siding · Metal siding may need repainting or replacement. | Major | $15,000–50,000 |
| interior walls · Painted walls appear to be in good condition but may need touch-ups. | Minor | $500–3,000 |
| kitchen cabinets · Wooden cabinets appear to be in good condition but may need cleaning. | Minor | $500–3,000 |
| bathroom fixtures · Standard fixtures in the bathroom may need cleaning or minor repairs. | Minor | $500–3,000 |
| HVAC system · Standard appliances and fixtures may need cleaning or minor repairs. | Minor | $500–3,000 |
| landscaping · Simple landscaping in front of the home may need some maintenance or updates. | Minor | $500–3,000 |
| Total estimated repair cost · 7 items | $32,500–115,000 |
Value-add ROI direction
- Resale Painting the exterior siding — Fresh paint can significantly improve curb appeal and home value. ↑
- Resale Updating the kitchen cabinets — Modernizing the kitchen can attract more buyers. ↑
- Resale Upgrading the bathroom fixtures — Modern fixtures can enhance the home's appeal and functionality. ↑
- Rental Upgrading HVAC system — A more efficient HVAC system can attract renters and reduce utility costs. ↑
- Both Landscaping improvements — A well-maintained and aesthetically pleasing landscape can increase both resale and rental value. ↑
ⓘ Cost ranges are severity-bucket heuristics (US national rule-of-thumb). Get contractor quotes + a written scope before underwriting a rehab budget.
Schools (NCES district)
- District
- Glendale Union High School District (4285)
- NCES district ID
- 0403450
- Math proficiency
- 23% ▼ -38.00%
- Reading proficiency
- 31% ▼ -19.00%
- Median HH income
- $40,846
- Composite
- 22.81/100
- National rank
- #8020
- State rank
- #130 of 249 in AZ
Livability — Phoenix
- Score
- 75/100
- State rank
- #16
- US rank
- #3924
Category grades
Schools grade is shown separately in the Schools card above.
Census & demographics
- Census place
- Phoenix, AZ
- County
- Maricopa County · 4,537,380 people
- City population
- 1,500,198
- Metro
- Phoenix-Mesa-Chandler, AZ
- Population (ZIP)
- 45,768
- Household income
- $69,189
- Rent vs Own
- Severe rent burden
- 1546.0
Population outlook (Maricopa County) Hauer SSP2
- Today (2025)
- 4,979,203 people
- By 2030
- 5,378,229 · +8.0%
- By 2040
- 6,156,598 · +23.6%
- By 2050
- 6,872,376 · +38.0%
- By 2075
- 8,401,270 · +68.7%
- By 2100
- 9,247,439 · +85.7%
Race, ethnicity, and origin ACS 2023
- Neighborhood character
- Diverse neighborhood (Simpson 0.67)
- Race & ethnicity
- Hispanic / Latino 48% White 30% Two or more races 26% Black 8% Asian 5% Native American 4%
- Hispanic origin (detail)
- Mexican 42%
- Common ancestry
- Italian 2% Lithuanian 1% Slovak 1%
- Foreign-born
- 20% · Canada, Vietnam, Philippines
- Languages at home
- 57% English-only · Spanish 33% Other Asian/Pacific 3% Arabic 3%
Political lean MEDSL · Maricopa
- 2024 margin
- Toss-up / Even · D 47.7% · R 51.2% · Other 1.1%
- 2008→2024 swing
- +7.1pp toward D · 2008: -10.6pp · 2024: -3.5pp
- All cycles
- 2024: R+3.5 2020: D+2.2 2016: R+3.5 2012: R+12.0 2008: R+10.6
Not yet ingested
- Civics
- —
Market trends
- HPI YoY
- ▼ -113.72%
- Current HPI
- 393.886
- Rent YoY
- ▼ -3.04%
- Metro
- Phoenix-Mesa-Chandler, AZ
- State GDP YoY
- ▲ 4.54%
- F500 in state
- 20
Industry mix (Fortune 500 HQ in AZ)
| Industry | F500 HQs | Revenue |
|---|---|---|
| Technology | 2 | $13B |
|
||
| Mining / Metals | 1 | $23B |
|
||
| Environmental Services | 1 | $16B |
|
||
| Metals / Steel | 1 | $14B |
|
||
| Technology Distribution | 1 | $9B |
|
||
| Homebuilding | 1 | $8B |
|
||
Price history
-20.0% since first listed3 events — show timeline
- 2026-05-17 Price Changed $28,000 ARMLS
- 2026-05-10 Price Changed $30,000 ARMLS
- 2026-05-06 Listed $35,000 ARMLS
Cash-flow waterfall
monthlySold comps — $/sqft
last 12 mo · ≤1 miLoading sold comps…