 🏗️ New Construction
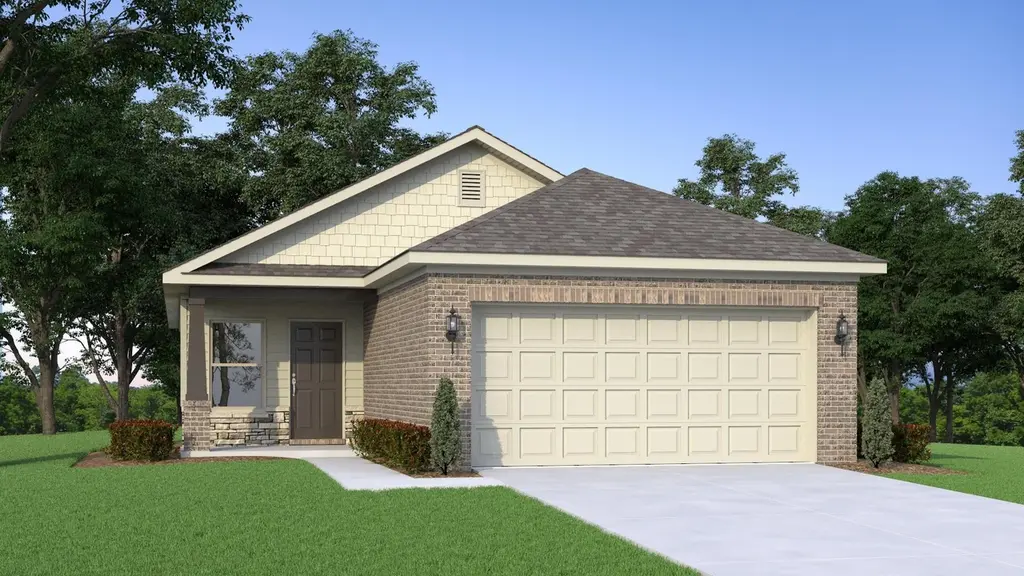
The 1400 Plan Plan · Huntsville, AL
Flood risk 1/10 · Minimal
- FEMA flood zone
- X (unshaded)
- Chance of flooding over 30 yrs
- 0.0%
- Est. flood insurance / yr
- $507 – $1,088
Fire risk 2/10 · Minimal
- Est. fire insurance / yr
- $916 – $1,700
Heat risk 5/10 · Moderate
- Hot days now (above 105°F)
- 7 days/yr
- Hot days in 30 yrs
- 19 days/yr
Wind risk 5/10 · Moderate
- Chance of severe wind over 30 yrs
- 23.0%
Air-quality risk 2/10 · Minimal
- Unhealthy air days now
- 1 days/yr
- Unhealthy air days in 30 yrs
- 1 days/yr
Risk factors via First Street. Map © Google.
Why this score? — see what drove the F grade
The composite is a weighted blend of 9 inputs, each scored 0–100. Each bar is that input's sub-score; the figure is the points it added to the 100-point composite (weight × sub-score).
- ARV discount +7.5/15.0
- Cash flow +6.1/30.0
- Livability +4.1/5.0
- Schools +2.8/10.0
- Rent growth +2.7/5.0
- Condition / age +2.5/5.0
- 1% rule +1.4/10.0
- DSCR +0.5/10.0
- Appreciation +0.0/10.0
$229,900
🖨 Deal sheet (PDF) 📄 Offer letter ✓ Due diligence
Listing remarks MLS
The 1400 Plan offers 3 beds, 2 baths, and an open concept living space!
Key facts
- Listed 89 days
Neighborhood map
What this means for you Summary
Snapshot
- This is a 3-bed/2.0-bath single-family listed at $230k.
Deal economics
- At list price, monthly cash flow is $-524 ($-6k/yr) — negative.
- To cash-flow at today's rent, offer at most $208k (9.4% below list).
- To meet the 1% rule (rent ≥ 1% of price), the offer needs to be $182k (20.7% below list).
- Recommended offer: $182k (20.7% below list) — sets the bar for 1% rule.
Location & tenants
- Location reads 82/100 on livability (#3 in AL, #1,082 nationally) — a professional / high-income tenant draw. Strengths: commute A+, cost of living A+, housing A+; Watch: crime F.
- Limestone County (rural): math 21% / reading 44% proficiency, ranked #52 of 129 in AL (top 40%) — families likely to look elsewhere, expect single-tenant / working-renter base with shorter leases.
- Zoned schools: Creekside Elementary School (math 42% / reading 66%, grade C, #96 of 627 statewide, top 16%, 560 students, 41% FRL) — zoned schools at 41% FRL track the district average.
- Zoned-school proficiency averages 54% at this address vs 32% district-wide (+22 pts) — the actual schools serving this property are materially stronger than the Limestone County average implies; a family-tenant draw the district grade alone would hide.
- Market conditions: Rents flat; 675 active listings in the ZIP; 1 comparable units currently listed for rent nearby; solid renter incomes; 494 units permitted in Limestone County in 2024 (0 in 5+ unit buildings).
Forward outlook
- Local home prices are declining (-3.0%/yr); year-one equity from $2k of loan paydown is wiped out by about $9k of value loss. Plan a longer hold.
- Limestone County population projected at +43% by 2050 — long-run rental-demand tailwind backs the buy-and-hold thesis.
Negotiation context
- It's been on market 89 days — a 6% lower offer ($216k) is reasonable based on typical stale-listing flexibility.
Risks & watch-outs
- Climate carrying-cost: moderate wind risk, 23% chance of damaging wind over 30y; extreme-heat days projected 7→19/yr by 2055 (HVAC capex compounding) — expect insurance premiums to compound above CPI over the hold.
Questions for the listing agent
- What do current leases actually rent for vs. the listed asking? Can we see a recent rent roll and the last 12 months of T-12 income?
- It's been on market 89 days. Have you received any prior offers? Is the seller open to a 21% concession, seller financing, or rate buy-down credit?
- Why hasn't it sold? Are there any deal-killer items the seller is aware of (foundation, flood, title, zoning, code violations)?
- Is there a deadline driving the sale (1031 exchange, divorce, estate, relocation)? That informs how much negotiation room exists.
- Crime grade is F in this area — have there been break-ins, vandalism, or insurance claims at this property in the last 3 years? What carrier currently insures it and at what premium?
- The area grade is low — what's the realistic commute time and amenity access for the typical tenant pool here? Any planned neighborhood developments (good or bad) we should know about?
- What's the average days-on-market for RENTAL listings here right now (not sales)? A rising rental-DOM trend means longer vacancies and softer asking-rent achievability than the comps imply.
- What's the recent tenant-quality profile in this submarket — average credit score on applications, eviction rate, late-payment / NSF rate, and stable-employment percentage? A property-management company in the area should have these aggregated.
- How much new for-sale + rental construction is in the pipeline within 1–3 miles? Heavy new supply typically softens prices + rents 12–24 months out; constrained supply supports both.
Investment metrics
- 1% rule
- 0.64% ✗
- Cap rate
- 4.08%
- Cash-on-cash
- -7.91%
- DSCR
- 0.65
- GRM
- 13.0
CMA / ARV
- ARV (median comp)
- $284,176
- List price
- $229,900
- Delta
- -19.10%
- Verdict
- UNDERPRICED
- Comps
- 20 within 1.0 mi
Show comp detail 9 sales within ~0.75 mi
| Address | Dist | Beds/Ba | Sqft | Sold | Price | $/sf | Match |
|---|---|---|---|---|---|---|---|
| 14701 Sara Beth Dr | 0.34mi | 3/2.0 | 1,401 (-0%) | 0mo | $264,000 | $188 | 84 |
| 28065 Caperton Dr | 0.34mi | 3/2.0 | 1,402 (0%) | 3mo | $253,900 | $181 | 81 |
| 28207 Ladson St | 0.05mi | 3/2.0 | 1,402 (0%) | 22mo | $261,900 | $187 | 79 |
| 14302 Sara Beth Dr | 0.33mi | 3/2.0 | 1,360 (-3%) | 13mo | $255,000 | $188 | 69 |
| 14700 Sara Beth Dr | 0.34mi | 3/2.0 | 1,432 (+2%) | 17mo | $279,000 | $195 | 66 |
| 28238 Dalewood Ln | 0.40mi | 3/2.0 | 1,330 (-5%) | 10mo | $250,000 | $188 | 65 |
| 28235 Ladson St | 0.07mi | 3/2.0 | 1,580 (+13%) | 22mo | $283,041 | $179 | 57 |
| 28114 Caperton Dr | 0.37mi | 3/2.0 | 1,580 (+13%) | 12mo | $285,661 | $181 | 52 |
| 15220 Knoll Dr | 0.62mi | 3/2.0 | 1,558 (+11%) | 24mo | $295,000 | $189 | 32 |
Match score weights: distance 35% · size 25% · config 20% · recency 20%. Top-matched comps best support the ARV.
Projected returns pro-forma
-3.0% appreciation · 0.81% rent growth · sell at horizon
- IRR
- -32.6%
- Equity multiple
- -0.05×
- Total profit
- $-83,348
- Equity at exit
- $42,372
- IRR
- -53.4%
- Equity multiple
- -0.65×
- Total profit
- $-130,901
- Equity at exit
- $24,570
Cash invested: $79,569 (down + closing). Projections, not guarantees.
Landlord ↔ Tenant lean methodology
- Overall (STATE)
- 90 Strongly Landlord-Friendly
- State Alabama
- 90 Strongly Landlord-Friendly · R+15
- County
- — inherits STATE
- City
- — inherits STATE
ZIP-level market 35749
- Home prices YoY
- -5.4%
- Rents YoY
- 0.8%
- Active inventory
- 675
- Price-to-rent
- 10.5×
Monthly cashflow live
- Estimated rent
- $1,822 medium interval (Pro) →
- Mortgage (P&I)
- −$1,490
- Tax est. 1.5%
- −$355 /mo · $4,263/yr
- Insurance
- −$118
- HOA
- −$0
- Vacancy / Maint / Mgmt
- −$383
- Net cashflow
- $-524
Break-even live
Sensitivity live
| Price | -10% $-328 | -5% $-426 | +0% $-524 | +5% $-623 | +10% $-721 |
|---|---|---|---|---|---|
| Rent | -10% $-668 | -5% $-596 | +0% $-524 | +5% $-452 | +10% $-380 |
| Rate | -1.0pp $-381 | -0.5pp $-452 | base $-524 | +0.5pp $-598 | +1.0pp $-673 |
UW: 25.0% down · 7.5% · 30yr · 1.5% tax · 5.0% vac · 8.0% maint · 8.0% mgmt
Financing live
Cash to close
- Down payment
- $71,044
- Closing costs
- $8,525
- Reserves months
- —
- Total cash needed
- —
Loan-product check · same deal, 3 products live
Conventional
25% down · 7.5% · 30yr
- Down + closing
- —
- Monthly P&I
- —
- Monthly cashflow
- —
- DSCR
- —
- Eligible?
- —
Personal DTI + credit; lowest rate.
DSCR
20% down · 8.5% · 30yr
- Down + closing
- —
- Monthly P&I
- —
- Monthly cashflow
- —
- DSCR
- —
- Eligible?
- —
No personal income docs; deal must DSCR.
Hard money
10% down · 12.0% · 12mo
- Down + closing
- —
- Monthly P&I
- —
- Monthly cashflow
- —
- DSCR
- —
- Eligible?
- —
Short-term bridge; refi at stabilization.
Rent comps 1 comps
| Address | Beds | Baths | Sqft | Rent | $/sqft | DOM | Units | Dist |
|---|---|---|---|---|---|---|---|---|
| 14287 Wildflower Dr Harvest, AL | 3.0 | 2.0 | 1717 | $1,800 | $1.05 | 45d | 1 | 0.76mi |
Listing history 17 events
-
2026-06-22days on market $229,900 Active 89 DOM
-
2026-06-18days on market $229,900 Active 86 DOM
-
2026-06-17days on market $229,900 Active 85 DOM
-
2026-06-16days on market $229,900 Active 84 DOM
-
2026-06-15days on market $229,900 Active 83 DOM
-
2026-06-14days on market $229,900 Active 81 DOM
-
2026-06-10days on market $229,900 Active 78 DOM
-
2026-06-09days on market $229,900 Active 77 DOM
-
2026-06-08days on market $229,900 Active 76 DOM
-
2026-06-07days on market $229,900 Active 75 DOM
-
2026-06-05days on market $229,900 Active 72 DOM
-
2026-06-03days on market $229,900 Active 71 DOM
-
2026-06-02days on market $229,900 Active 70 DOM
-
2026-06-01days on market $229,900 Active 69 DOM
-
2026-05-31days on market $229,900 Active 68 DOM
-
2026-05-30days on market $229,900 Active 67 DOM
-
2026-03-24$229,900 Active 71-char remark
Show marketing remark (71 chars)
The 1400 Plan offers 3 beds, 2 baths, and an open concept living space!
ⓘ Source: listings_history table (triggers on properties + properties_extension) + one-shot
backfill from property_details.listing_events for pre-trigger history.
Climate risk First Street
- Flood 1/10 Low FEMA zone X (unshaded) · 0% chance over 30 yrs
- Wildfire 2/10 Low
- Heat 5/10 Major 7 d/yr ≥105°F today · 19 d/yr by 30 yrs out
- Wind 5/10 Major 23% chance of damaging wind over 30 yrs
- Air quality 2/10 Low 1 unhealthy d/yr today · 1 by 30 yrs out
Nearby sold comps map
Loading sold comps map…
Walkable amenities ~0.75 mi
Loading nearby amenities…
Taxation est. · year 1
- Rental income
- $21,866
- − Mortgage interest
- −$15,918
- − Property taxes
- −$4,263
- − Insurance
- −$1,421
- − Repairs & maintenance
- −$1,749
- − Management
- −$1,749
- − Depreciation
- −$8,267
- Taxable loss
- −$11,501
- Est. tax savings @ 24.0%
- +$2,760
- After-tax cash flow
- $-3,532/yr
For passive investors: Depreciation is non-cash, so a rental often shows a tax loss while cash-flowing — sheltering income. Rental losses are passive: they offset passive income freely, and up to $25,000/yr can offset ordinary (W-2) income if you actively participate and your MAGI is under $100k (phasing out to $0 by $150k); unused losses carry forward. On sale, claimed depreciation is recaptured at up to 25%, and gains may owe capital-gains tax (a 1031 exchange can defer both). Figures are a year-1 estimate at your 24.0% rate — not tax advice; consult a CPA.
Schools (NCES district)
- District
- Limestone County
- NCES district ID
- 0102100
- Math proficiency
- 21% ▼ -23.00%
- Reading proficiency
- 44% ▼ -3.00%
- Median HH income
- $48,972
- Composite
- 28.09/100
- National rank
- #6829
- State rank
- #52 of 129 in AL
Livability — Huntsville
- Score
- 82/100
- State rank
- #3
- US rank
- #1082
Category grades
Schools grade is shown separately in the Schools card above.
Census & demographics
- County
- Madison County · 380,832 people
- City population
- 220,435
- Metro
- Huntsville, AL
- Population (ZIP)
- 30,710
- Household income
- $103,901
- Rent vs Own
- Severe rent burden
- 174.0
Population outlook (Limestone County) Hauer SSP2
- Today (2025)
- 111,441 people
- By 2030
- 121,272 · +8.8%
- By 2040
- 140,705 · +26.3%
- By 2050
- 159,069 · +42.7%
- By 2075
- 202,231 · +81.5%
- By 2100
- 230,608 · +106.9%
Race, ethnicity, and origin ACS 2023
- Neighborhood character
- Diverse neighborhood (Simpson 0.56)
- Race & ethnicity
- White 60% Black 29% Two or more races 7% Hispanic / Latino 4% Asian 2%
- Common ancestry
- Italian 2% Slovak 1% Serbian 1%
- Foreign-born
- 3% · Canada, South Korea
- Languages at home
- 95% English-only · Spanish 3% Korean 1% Other Indo-European 1%
Political lean MEDSL · Limestone
- 2024 margin
- Solid R (+43.9) · D 27.5% · R 71.4% · Other 1.2%
- 2008→2024 swing
- -2.0pp toward R · 2008: -41.9pp · 2024: -43.9pp
- All cycles
- 2024: R+43.9 2020: R+42.6 2016: R+49.5 2012: R+43.6 2008: R+41.9
Not yet ingested
- Civics
- —
Market trends
- HPI YoY
- ▼ -16.54%
- Current HPI
- 291.1184
- Rent YoY
- ▲ 0.81%
- Metro
- Huntsville, AL
- State GDP YoY
- ▲ 2.94%
- F500 in state
- 4
Industry mix (Fortune 500 HQ in AL)
| Industry | F500 HQs | Revenue |
|---|---|---|
| Financial Services | 1 | $8B |
|
||
| Healthcare | 1 | $5B |
|
||
Price history
1 event — show timeline
- 2026-03-24 Listed $229,900 Zillow
Cash-flow waterfall
monthlySold comps — $/sqft
last 12 mo · ≤1 miLoading sold comps…