 🏗️ New Construction
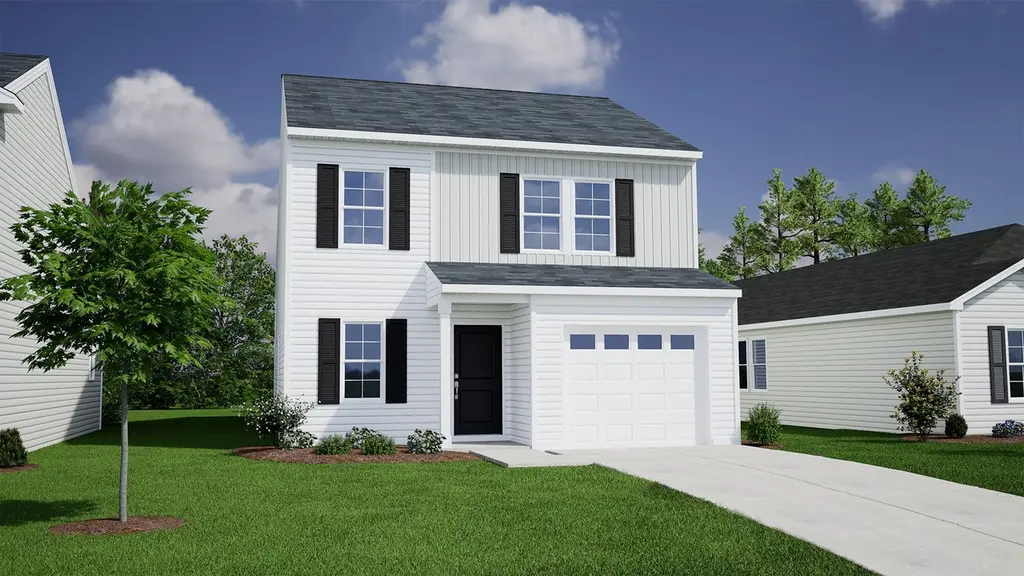
Evans Plan · Blythewood, SC
Flood risk No data
- FEMA flood zone
- —
- Chance of flooding over 30 yrs
- —
- Est. flood insurance / yr
- —
Fire risk No data
- Est. fire insurance / yr
- —
Heat risk No data
- Hot days now (above threshold)
- —
- Hot days in 30 yrs
- —
Wind risk No data
- Chance of severe wind over 30 yrs
- —
Air-quality risk No data
- Unhealthy air days now
- —
- Unhealthy air days in 30 yrs
- —
Risk factors via First Street. Map © Google.
Why this score? — see what drove the C grade
The composite is a weighted blend of 9 inputs, each scored 0–100. Each bar is that input's sub-score; the figure is the points it added to the 100-point composite (weight × sub-score).
- Cash flow +21.5/30.0
- ARV discount +7.5/15.0
- DSCR +6.9/10.0
- 1% rule +5.6/10.0
- Condition / age +4.0/5.0
- Schools +3.6/10.0
- Livability +3.5/5.0
- Rent growth +2.5/5.0
- Appreciation +0.0/10.0
$228,000
🖨 Deal sheet 📄 Offer letter ✓ Due diligence
Listing remarks
This two-story plan features three bedrooms and two-and-one-half bathrooms. The kitchen and laundry room sit immediately off the entryway, and an eat-in area and great room lead off the kitchen. The primary bedroom and bathroom, with walk-in linen and clothes closets, are located downstairs and next to the great room. Upstairs are a bonus room, another full bathroom, and two more bedrooms, each with a walk-in closet. You have several options for adapting this plan, including putting vaulted ceilings in the great room and primary bedroom, altering the primary bathroom, adding an optional fourth bedroom in lieu of the bonus room, and adding a fireplace, porch, and closet.
Key facts
- Listed 34 days
Property features AI
Finance
- Financial info: List price $228,000
Exterior
- Home design: Single-family plan (Evans); Located at 115 Kingsley Dr, Blythewood, SC 29016
- Construction: New construction (plan inventory)
- Exterior features: Living area approximately 1709
Interior
- Bedrooms: 3 bedrooms
- Bathrooms: 2 full bathrooms and 1 half bathroom (2.5 total)
- Interior features: Plan: Evans (new construction plan)
Neighborhood map
What this means for you Summary
Snapshot
- This is a 3-bed/2.5-bath single-family listed at $228k. Condition is rated good.
Deal economics
- At list price, monthly cash flow is $342 ($4k/yr) — positive.
- The deal already cash-flows at list — no discount required.
- Meets the 1% rule at list price ($2k rent vs $228k).
- Recommended offer: $221k (3.0% below list) — sets the bar for market timing.
Location & tenants
- Location reads 70/100 on livability (#58 in SC) — a middle-class / working-renter tenant base. Strengths: crime A+, employment A+, housing A+; Watch: amenities F, commute F, health & safety F.
- Richland 02 (suburban): math 35% / reading 47% proficiency, ranked #29 of 80 in SC (top 36%) — families likely to look elsewhere, expect single-tenant / working-renter base with shorter leases.
- Market conditions: 650 active listings in the ZIP; 7 comparable units currently listed for rent nearby; rentals leasing fast (median 4d on market — plan ~1-2 weeks tenant-placement turnaround); solid renter incomes; 3,472 units permitted in Richland County in 2024 (1,096 in 5+ unit buildings).
- This rent runs 31% of the median local income ($95k/yr) — at the standard rent-burdened threshold; future hikes will face affordability resistance.
Forward outlook
- Local home prices are declining (-3.0%/yr); year-one equity from $2k of loan paydown is wiped out by about $7k of value loss. Plan a longer hold.
- Richland County population projected at +30% by 2050 — long-run rental-demand tailwind backs the buy-and-hold thesis.
Negotiation context
- It's been on market 34 days — a 3% lower offer ($221k) is reasonable based on typical stale-listing flexibility.
Questions for the listing agent
- It's been on market 34 days. Have you received any prior offers? Is the seller open to a 3% concession, seller financing, or rate buy-down credit?
- Is there a deadline driving the sale (1031 exchange, divorce, estate, relocation)? That informs how much negotiation room exists.
- Schools are B-rated — typically a magnet for longer-tenancy family renters. What's the average tenant stay here, and is there a school-zone premium baked into asking?
- What's the average days-on-market for RENTAL listings here right now (not sales)? A rising rental-DOM trend means longer vacancies and softer asking-rent achievability than the comps imply.
- What's the recent tenant-quality profile in this submarket — average credit score on applications, eviction rate, late-payment / NSF rate, and stable-employment percentage? A property-management company in the area should have these aggregated.
- How much new for-sale + rental construction is in the pipeline within 1–3 miles? Heavy new supply typically softens prices + rents 12–24 months out; constrained supply supports both.
Investment metrics
- 1% rule
- 1.06% ✓
- Cap rate
- 8.09%
- Cash-on-cash
- 6.42%
- DSCR
- 1.29
- GRM
- 7.8
CMA / ARV
No comps found within radius.
Projected returns pro-forma
-3.0% appreciation · 3.0% rent growth · sell at horizon
- IRR
- -6.4%
- Equity multiple
- 0.76×
- Total profit
- $-15,142
- Equity at exit
- $33,996
- IRR
- 3.2%
- Equity multiple
- 1.23×
- Total profit
- $14,992
- Equity at exit
- $19,713
Cash invested: $63,840 (down + closing). Projections, not guarantees.
Landlord ↔ Tenant lean methodology
- Overall (STATE)
- 90 Strongly Landlord-Friendly
- State South Carolina
- 90 Strongly Landlord-Friendly · R+6
- County
- — inherits STATE
- City
- — inherits STATE
ZIP-level market 29016
- Home prices YoY
- -26.3%
- Active inventory
- 650
- Price-to-rent
- 7.8×
Monthly cashflow live
- Estimated rent
- $2,427 high interval (Pro) →
- Mortgage (P&I)
- −$1,196
- Tax est. 1.5%
- −$285 /mo · $3,420/yr
- Insurance
- −$95
- HOA
- −$0
- Vacancy / Maint / Mgmt
- −$510
- Net cashflow
- $342
Break-even live
UW: 25.0% down · 7.5% · 30yr · 1.5% tax · 5.0% vac · 8.0% maint · 8.0% mgmt
Financing live
Cash to close
- Down payment
- $57,000
- Closing costs
- $6,840
- Reserves months
- —
- Total cash needed
- —
Loan-product check · same deal, 3 products live
Conventional
25% down · 7.5% · 30yr
- Down + closing
- —
- Monthly P&I
- —
- Monthly cashflow
- —
- DSCR
- —
- Eligible?
- —
Personal DTI + credit; lowest rate.
DSCR
20% down · 8.5% · 30yr
- Down + closing
- —
- Monthly P&I
- —
- Monthly cashflow
- —
- DSCR
- —
- Eligible?
- —
No personal income docs; deal must DSCR.
Hard money
10% down · 12.0% · 12mo
- Down + closing
- —
- Monthly P&I
- —
- Monthly cashflow
- —
- DSCR
- —
- Eligible?
- —
Short-term bridge; refi at stabilization.
Rent comps 7 comps
| Address | Beds | Baths | Sqft | Rent | $/sqft | DOM | Units | Dist |
|---|---|---|---|---|---|---|---|---|
| 312 Joshua Tree Ct Blythewood, SC | 3.0 | 2.5 | 1731 | $1,945 | $1.12 | 23d | 1 | 0.63mi |
| 562 Vintage Pine Dr Blythewood, SC | 3.0 | 2.0 | 1814 | $2,195 | $1.21 | 23d | 1 | 0.72mi |
| 9641 Farrow Rd Columbia, SC | 2.0–3.0 | 2.0 | 1179 | $1,872 | $1.59 | 3d | 32 | 1.16mi |
| 61 Bluebead Ct Columbia, SC | 4.0 | 2.0 | 1515 | $2,249 | $1.48 | 3d | 1 | 1.31mi |
| 1800 Killian Lakes Dr Columbia, SC | 1.0–3.0 | 1.0–2.5 | 1401 | $2,657 | $1.90 | 3d | 47 | 1.33mi |
| 621 Heron Glen Dr Columbia, SC | 4.0 | 2.5 | 2195 | $2,095 | $0.95 | 3d | 1 | 1.47mi |
| 608 Cottontail Ct N Columbia, SC | 4.0 | 2.0 | 1701 | $2,139 | $1.26 | 3d | 1 | 1.47mi |
Listing history 15 events
-
2026-06-18days on market $228,000 Active 34 DOM
-
2026-06-17days on market $228,000 Active 33 DOM
-
2026-06-16days on market $228,000 Active 32 DOM
-
2026-06-15days on market $228,000 Active 31 DOM
-
2026-06-14days on market $228,000 Active 29 DOM
-
2026-06-13days on market $228,000 Active 28 DOM
-
2026-06-10days on market $228,000 Active 26 DOM
-
2026-06-09days on market $228,000 Active 25 DOM
-
2026-06-08days on market $228,000 Active 24 DOM
-
2026-06-07days on market $228,000 Active 23 DOM
-
2026-06-05days on market $228,000 Active 20 DOM
-
2026-06-03days on market $228,000 Active 19 DOM
-
2026-06-03days on market $228,000 Active 18 DOM
-
2026-06-01days on market $228,000 Active 17 DOM
-
2026-05-31days on market $228,000 Active 16 DOM
ⓘ Source: listings_history table (triggers on properties + properties_extension) + one-shot
backfill from property_details.listing_events for pre-trigger history.
Nearby sold comps map
Loading sold comps map…
Walkable amenities ~0.75 mi
Loading nearby amenities…
Taxation est. · year 1
- Rental income
- $29,125
- − Mortgage interest
- −$12,772
- − Property taxes
- −$3,420
- − Insurance
- −$1,140
- − Repairs & maintenance
- −$2,330
- − Management
- −$2,330
- − Depreciation
- −$6,633
- Taxable income
- $501
- Est. tax owed @ 24.0%
- −$120
- After-tax cash flow
- $3,981/yr
For passive investors: Depreciation is non-cash, so a rental often shows a tax loss while cash-flowing — sheltering income. Rental losses are passive: they offset passive income freely, and up to $25,000/yr can offset ordinary (W-2) income if you actively participate and your MAGI is under $100k (phasing out to $0 by $150k); unused losses carry forward. On sale, claimed depreciation is recaptured at up to 25%, and gains may owe capital-gains tax (a 1031 exchange can defer both). Figures are a year-1 estimate at your 24.0% rate — not tax advice; consult a CPA.
Condition & rehab AI · 12 photos
This two-story home is in good condition with a good condition score of 80. It has a cosmetic rehab level and requires minor repairs and maintenance. The highest-ROI updates include painting the exterior and replacing window seals to enhance curb appeal and energy efficiency.
Value-add opportunities
- Resale paint exterior — enhances curb appeal
- Resale replace window seals — improves energy efficiency
- Both install smart home features — attracts tech-savvy buyers
- Both add outdoor lighting — enhances safety and curb appeal
Renovation cost estimate screening
Value-add ROI direction
- Resale paint exterior — enhances curb appeal ↑
- Resale replace window seals — improves energy efficiency ↑
- Both install smart home features — attracts tech-savvy buyers ↑
- Both add outdoor lighting — enhances safety and curb appeal ↑
ⓘ Cost ranges are severity-bucket heuristics (US national rule-of-thumb). Get contractor quotes + a written scope before underwriting a rehab budget.
Schools (NCES district)
- District
- Richland 02
- NCES district ID
- 4503390
- Math proficiency
- 35% ▼ -15.00%
- Reading proficiency
- 47% ▼ -5.00%
- Median HH income
- $59,684
- Composite
- 36.2/100
- National rank
- #4730
- State rank
- #29 of 80 in SC
Livability — Blythewood
- Score
- 70/100
- State rank
- #58
- US rank
- #7406
Category grades
Schools grade is shown separately in the Schools card above.
Census & demographics
- County
- Richland County · 389,530 people
- City population
- 30,454
- Metro
- Columbia, SC
- Population (ZIP)
- 30,454
- Household income
- $95,082
- Rent vs Own
- Severe rent burden
- 559.0
Population outlook (Richland County) Hauer SSP2
- Today (2025)
- 459,667 people
- By 2030
- 487,524 · +6.1%
- By 2040
- 542,035 · +17.9%
- By 2050
- 595,371 · +29.5%
- By 2075
- 732,998 · +59.5%
- By 2100
- 820,415 · +78.5%
Race, ethnicity, and origin ACS 2023
- Neighborhood character
- Diverse neighborhood (Simpson 0.64)
- Race & ethnicity
- Black 43% White 42% Two or more races 7% Hispanic / Latino 7% Asian 3%
- Hispanic origin (detail)
- Mexican 1% Puerto Rican 2%
- Common ancestry
- Lithuanian 2% Romanian 2% Slovak 2%
- Foreign-born
- 5% · Canada, China
- Languages at home
- 90% English-only · Spanish 5% Other Indo-European 1% German/W. Germanic 1%
Political lean MEDSL · Richland
- 2024 margin
- Solid D (+34.6) · D 66.4% · R 31.8% · Other 1.8%
- 2008→2024 swing
- +5.7pp toward D · 2008: 28.9pp · 2024: 34.6pp
- All cycles
- 2024: D+34.6 2020: D+38.3 2016: D+32.9 2012: D+33.3 2008: D+28.9
Not yet ingested
- Civics
- —
Market trends
- HPI YoY
- ▼ -65.48%
- Current HPI
- 183.5933
- Rent YoY
- —
- Metro
- Columbia, SC
- State GDP YoY
- ▲ 4.51%
- F500 in state
- 2
Industry mix (Fortune 500 HQ in SC)
| Industry | F500 HQs | Revenue |
|---|---|---|
| Packaging | 1 | $7B |
|
||
Cash-flow waterfall
monthlySold comps — $/sqft
last 12 mo · ≤1 miLoading sold comps…