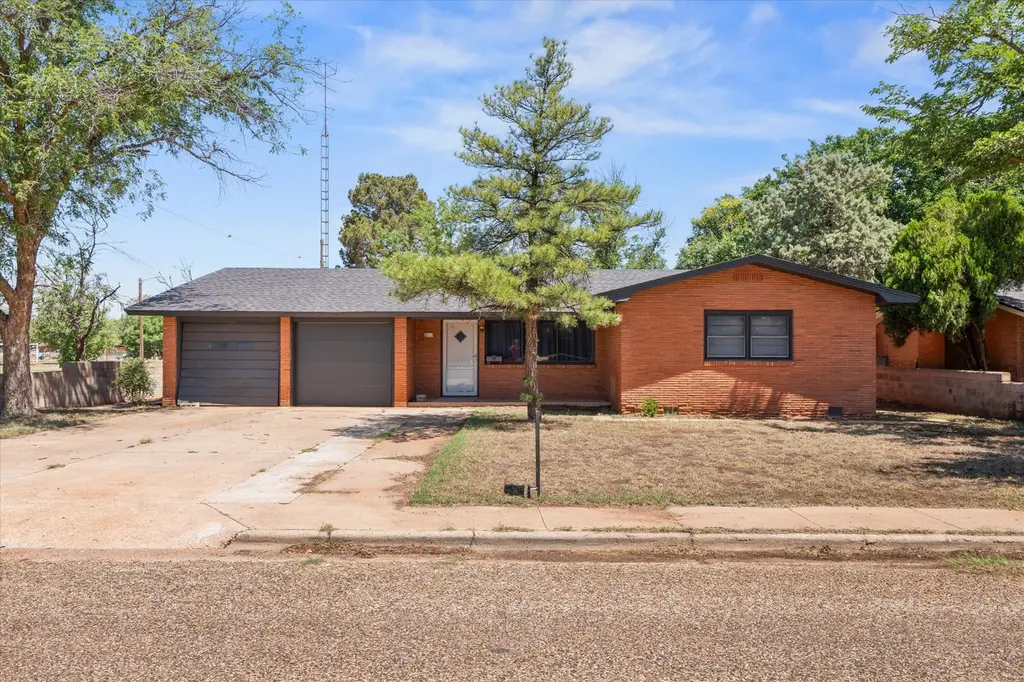
506 N 21st St · Lamesa, TX
Flood risk 1/10 · Minimal
- FEMA flood zone
- X (unshaded)
- Chance of flooding over 30 yrs
- 0.0%
- Est. flood insurance / yr
- $507 – $1,088
Fire risk 1/10 · Minimal
- Est. fire insurance / yr
- $1,222 – $2,270
Heat risk 5/10 · Moderate
- Hot days now (above 101°F)
- 6 days/yr
- Hot days in 30 yrs
- 19 days/yr
Wind risk 2/10 · Minimal
- Chance of severe wind over 30 yrs
- 2.0%
Air-quality risk 1/10 · Minimal
- Unhealthy air days now
- 0 days/yr
- Unhealthy air days in 30 yrs
- 0 days/yr
Risk factors via First Street. Map © Google.
Why this score? — see what drove the C grade
The composite is a weighted blend of 9 inputs, each scored 0–100. Each bar is that input's sub-score; the figure is the points it added to the 100-point composite (weight × sub-score).
- Cash flow +25.0/30.0
- DSCR +8.2/10.0
- ARV discount +7.5/15.0
- 1% rule +6.5/10.0
- Condition / age +3.8/5.0
- Livability +3.5/5.0
- Rent growth +2.5/5.0
- Schools +1.9/10.0
- Appreciation +0.0/10.0
$135,000
🖨 Deal sheet (PDF) 📄 Offer letter ✓ Due diligence
Listing remarks
Great home situated on a spacious corner lot featuring 3 bedrooms, 2 bathrooms, and a 2-car garage! This well-maintained property offers two living areas, providing plenty of space for relaxing or entertaining. Recent updates include a new roof, brand new luxury vinyl flooring, and fresh paint throughout. The large kitchen offers ample space for cooking and gathering with family and friends. Step outside to enjoy the spacious backyard complete with a storage/workshop area in the back perfect for hobbies, extra storage, or projects. Call today to schedule your private tour!
Key facts
- Spacious backyard
- Two living areas
- Corner lot
Tags
Property features AI
Exterior
- Parking: Attached 2-car garage
- Utilities: Standard utilities (water, sewer, power not specifically detailed)
- Home design: Single-family residence; Updated/remodeled; Corner lot
- Construction: Brick construction; Composition roof; Slab foundation; Built in -- year not provided
- Exterior features: Private yard; Exterior storage; Workshop
Interior
- Kitchen: Cooktop; Microwave; Range
- Flooring: Vinyl flooring
- Bathrooms: 2 full bathrooms
- Heating & cooling: Central heating (natural gas); Central air conditioning; Ceiling fans; Electric cooling components
- Interior features: Built-in features; Ceiling fans; Kitchen island; Storage
Neighborhood map
What this means for you Summary
Snapshot
- This is a 3-bed/2.0-bath single-family listed at $135k. Condition is rated good.
Deal economics
- At list price, monthly cash flow is $294 ($4k/yr) — positive.
- The deal already cash-flows at list — no discount required.
- Meets the 1% rule at list price ($2k rent vs $135k).
Location & tenants
- Location reads 69/100 on livability (#445 in TX) — a middle-class / working-renter tenant base. Strengths: cost of living A+, housing A+; Watch: health & safety C-, schools D, amenities F.
- Lamesa ISD (town): math 19% / reading 26% proficiency, ranked #755 of 826 in TX (top 91%) — low school quality limits family demand, transient renter base, plan for 1-2y turnover.
- Market conditions: 51 active listings in the ZIP; 2 comparable units currently listed for rent nearby; 1 units permitted in Dawson County in 2024 (0 in 5+ unit buildings).
Forward outlook
- Local home prices are declining (-3.0%/yr); year-one equity from $933 of loan paydown is wiped out by about $4k of value loss. Plan a longer hold.
Negotiation context
- Only 4 days on market — expect competitive offers; lowballing is unlikely to land.
Risks & watch-outs
- Climate carrying-cost: extreme-heat days projected 6→19/yr by 2055 (HVAC capex compounding) — expect insurance premiums to compound above CPI over the hold.
Questions for the listing agent
- Built in 1978 — when were the roof, HVAC, electrical panel, plumbing, and water heater last replaced?
- Is there a deadline driving the sale (1031 exchange, divorce, estate, relocation)? That informs how much negotiation room exists.
- Schools are D-rated, which usually means shorter tenancies and higher turnover. Who's the typical renter profile here, and what's been the actual vacancy rate?
- What's the average days-on-market for RENTAL listings here right now (not sales)? A rising rental-DOM trend means longer vacancies and softer asking-rent achievability than the comps imply.
- What's the recent tenant-quality profile in this submarket — average credit score on applications, eviction rate, late-payment / NSF rate, and stable-employment percentage? A property-management company in the area should have these aggregated.
- How much new for-sale + rental construction is in the pipeline within 1–3 miles? Heavy new supply typically softens prices + rents 12–24 months out; constrained supply supports both.
Investment metrics
- 1% rule
- 1.15% ✓
- Cap rate
- 8.91%
- Cash-on-cash
- 9.35%
- DSCR
- 1.42
- GRM
- 7.2
CMA / ARV
No comps found within radius.
Projected returns pro-forma
-3.0% appreciation · 3.0% rent growth · sell at horizon
- IRR
- -2.2%
- Equity multiple
- 0.92×
- Total profit
- $-3,104
- Equity at exit
- $20,129
- IRR
- 7.5%
- Equity multiple
- 1.57×
- Total profit
- $21,535
- Equity at exit
- $11,672
Cash invested: $37,800 (down + closing). Projections, not guarantees.
Landlord ↔ Tenant lean methodology
- Overall (STATE)
- 87 Strongly Landlord-Friendly
- State Texas
- 87 Strongly Landlord-Friendly · R+5
- County
- — inherits STATE
- City
- — inherits STATE
ZIP-level market 79331
- Active inventory
- 51
- Price-to-rent
- 7.2×
Monthly cashflow live
- Estimated rent
- $1,554 medium interval (Pro) →
- Mortgage (P&I)
- −$708
- Tax est. 1.5%
- −$169 /mo · $2,025/yr
- Insurance
- −$56
- HOA
- −$0
- Vacancy / Maint / Mgmt
- −$326
- Net cashflow
- $294
Break-even live
Sensitivity live
| Price | -10% $388 | -5% $341 | +0% $294 | +5% $248 | +10% $201 |
|---|---|---|---|---|---|
| Rent | -10% $172 | -5% $233 | +0% $294 | +5% $356 | +10% $417 |
| Rate | -1.0pp $362 | -0.5pp $329 | base $294 | +0.5pp $259 | +1.0pp $224 |
UW: 25.0% down · 7.5% · 30yr · 1.5% tax · 5.0% vac · 8.0% maint · 8.0% mgmt
Financing live
Cash to close
- Down payment
- $33,750
- Closing costs
- $4,050
- Reserves months
- —
- Total cash needed
- —
Loan-product check · same deal, 3 products live
Conventional
25% down · 7.5% · 30yr
- Down + closing
- —
- Monthly P&I
- —
- Monthly cashflow
- —
- DSCR
- —
- Eligible?
- —
Personal DTI + credit; lowest rate.
DSCR
20% down · 8.5% · 30yr
- Down + closing
- —
- Monthly P&I
- —
- Monthly cashflow
- —
- DSCR
- —
- Eligible?
- —
No personal income docs; deal must DSCR.
Hard money
10% down · 12.0% · 12mo
- Down + closing
- —
- Monthly P&I
- —
- Monthly cashflow
- —
- DSCR
- —
- Eligible?
- —
Short-term bridge; refi at stabilization.
Rent comps 2 comps
| Address | Beds | Baths | Sqft | Rent | $/sqft | DOM | Units | Dist |
|---|---|---|---|---|---|---|---|---|
| 803 N 18th St Lamesa, TX | 3.0 | 2.0 | 1539 | $1,600 | $1.04 | 45d | 1 | 0.33mi |
| 214 N 23rd St Lamesa, TX | 3.0 | 2.0 | 1962 | $1,500 | $0.76 | 45d | 1 | 0.34mi |
Listing history 6 events
-
2026-06-04status $135,000 Pending 4 DOM
-
2026-06-03days on market $135,000 Active 4 DOM
-
2026-06-02days on market $135,000 Active 3 DOM
-
2026-06-01days on market $135,000 Active 2 DOM
-
2026-05-31remarks 579-char remark
-
2026-05-31$135,000 Active 1 DOM
ⓘ Source: listings_history table (triggers on properties + properties_extension) + one-shot
backfill from property_details.listing_events for pre-trigger history.
Climate risk First Street
- Flood 1/10 Low FEMA zone X (unshaded) · 0% chance over 30 yrs
- Wildfire 1/10 Low
- Heat 5/10 Major 6 d/yr ≥101°F today · 19 d/yr by 30 yrs out
- Wind 2/10 Low 2% chance of damaging wind over 30 yrs
- Air quality 1/10 Low 0 unhealthy d/yr today · 0 by 30 yrs out
Nearby sold comps map
Loading sold comps map…
Walkable amenities ~0.75 mi
Loading nearby amenities…
Taxation est. · year 1
- Rental income
- $18,643
- − Mortgage interest
- −$7,562
- − Property taxes
- −$2,025
- − Insurance
- −$675
- − Repairs & maintenance
- −$1,491
- − Management
- −$1,491
- − Depreciation
- −$3,927
- Taxable income
- $1,471
- Est. tax owed @ 24.0%
- −$353
- After-tax cash flow
- $3,180/yr
For passive investors: Depreciation is non-cash, so a rental often shows a tax loss while cash-flowing — sheltering income. Rental losses are passive: they offset passive income freely, and up to $25,000/yr can offset ordinary (W-2) income if you actively participate and your MAGI is under $100k (phasing out to $0 by $150k); unused losses carry forward. On sale, claimed depreciation is recaptured at up to 25%, and gains may owe capital-gains tax (a 1031 exchange can defer both). Figures are a year-1 estimate at your 24.0% rate — not tax advice; consult a CPA.
Condition & rehab AI · 12 photos
This well-maintained home with recent updates and a spacious yard is ready for a new owner. Minor cosmetic improvements can further enhance its curb appeal and value.
Value-add opportunities
- Both Paint exterior — Enhances curb appeal and value
- Both Landscaping — Improves curb appeal and rental value
- Both Replace ceiling fans — Modernizes and improves air circulation
Renovation cost estimate screening
Value-add ROI direction
- Both Paint exterior — Enhances curb appeal and value ↑
- Both Landscaping — Improves curb appeal and rental value ↑
- Both Replace ceiling fans — Modernizes and improves air circulation ↑
ⓘ Cost ranges are severity-bucket heuristics (US national rule-of-thumb). Get contractor quotes + a written scope before underwriting a rehab budget.
Schools (NCES district)
- District
- Lamesa ISD
- NCES district ID
- 4826610
- Math proficiency
- 19% ▼ -15.00%
- Reading proficiency
- 26% ▬ 0.00%
- Median HH income
- $38,346
- Composite
- 18.85/100
- National rank
- #8862
- State rank
- #755 of 826 in TX
Livability — Lamesa
- Score
- 69/100
- State rank
- #445
- US rank
- #9067
Category grades
Schools grade is shown separately in the Schools card above.
Census & demographics
- Census place
- Lamesa, TX
- Population (ZIP)
- 11,751
Population outlook (Dawson County) Hauer SSP2
- Today (2025)
- 12,411 people
- By 2030
- 12,268 · -1.2%
- By 2040
- 12,260 · -1.2%
- By 2050
- 12,117 · -2.4%
- By 2075
- 11,504 · -7.3%
- By 2100
- 10,176 · -18.0%
Race, ethnicity, and origin ACS 2023
- Neighborhood character
- Diverse neighborhood (Simpson 0.57)
- Race & ethnicity
- Hispanic / Latino 56% White 34% Two or more races 24% Black 7%
- Hispanic origin (detail)
- Mexican 52%
- Common ancestry
- Lithuanian 2% Polish 2% Slovak 1%
- Foreign-born
- 6% · Canada
- Languages at home
- 65% English-only · Spanish 32% German/W. Germanic 2%
Political lean MEDSL · Dawson
- 2024 margin
- Solid R (+61.0) · D 19.0% · R 80.0%
- 2008→2024 swing
- -18.2pp toward R · 2008: -42.8pp · 2024: -61.0pp
- All cycles
- 2024: R+61.0 2020: R+56.6 2016: R+50.6 2012: R+43.2 2008: R+42.8
Not yet ingested
- Civics
- —
Market trends
- HPI YoY
- ▼ -76.06%
- Current HPI
- 135.9298
- Rent YoY
- —
- Metro
- —
- State GDP YoY
- ▲ 3.95%
- F500 in state
- 110
Industry mix (Fortune 500 HQ in TX)
| Industry | F500 HQs | Revenue |
|---|---|---|
| Energy | 16 | $1,198B |
|
||
| Technology | 5 | $198B |
|
||
| Engineering / Construction | 4 | $72B |
|
||
| Energy Services | 3 | $60B |
|
||
| Utilities | 3 | $41B |
|
||
| Healthcare | 2 | $330B |
|
||
Price history
1 event — show timeline
- 2026-05-30 Listed $135,000 LARMLS
Cash-flow waterfall
monthlySold comps — $/sqft
last 12 mo · ≤1 miLoading sold comps…