 🏗️ New Construction
11515 Heritage Wind Dr · Barrett, TX
Flood risk No data
- FEMA flood zone
- —
- Chance of flooding over 30 yrs
- —
- Est. flood insurance / yr
- —
Fire risk No data
- Est. fire insurance / yr
- —
Heat risk No data
- Hot days now (above threshold)
- —
- Hot days in 30 yrs
- —
Wind risk No data
- Chance of severe wind over 30 yrs
- —
Air-quality risk No data
- Unhealthy air days now
- —
- Unhealthy air days in 30 yrs
- —
Risk factors via First Street. Map © Google.
Why this score? — see what drove the D- grade
The composite is a weighted blend of 9 inputs, each scored 0–100. Each bar is that input's sub-score; the figure is the points it added to the 100-point composite (weight × sub-score).
- Cash flow +12.7/30.0
- ARV discount +7.5/15.0
- DSCR +3.8/10.0
- Schools +3.5/10.0
- Rent growth +2.9/5.0
- 1% rule +2.8/10.0
- Livability +2.8/5.0
- Condition / age +2.5/5.0
- Appreciation +0.0/10.0
$240,900
🖨 Deal sheet 📄 Offer letter ✓ Due diligence
Listing remarks MLS
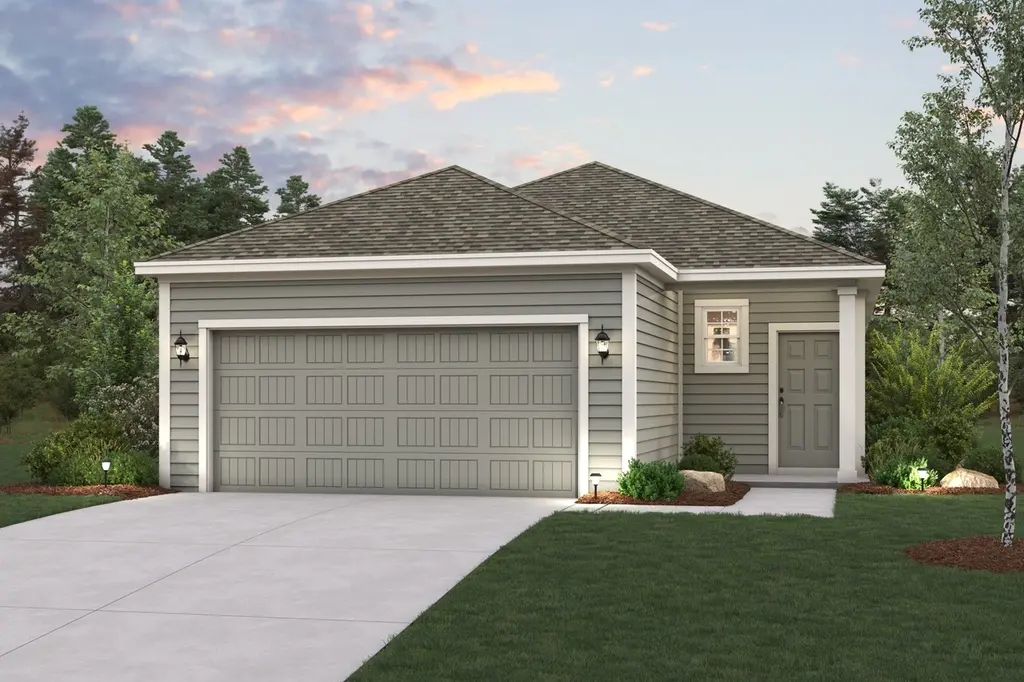
The attractive Aspen plan centers around a large open kitchen, complete with an island and a built-in pantry. An airy great room-ideal for relaxing and entertaining-is steps away, as is a dining area. There are three spacious bedrooms, including a primary suite with a walk-in closet and a private bath with dual vanities and a walk-in shower.
Key facts
- Built-in pantry
- Walk-in closet
- Private bath
Tags
Property features AI
Finance
- HOA & community: Community Solutions association; Annual association fee of $575
Exterior
- Parking: Attached 2-car garage
- Utilities: Public water; Public sewer; Tankless water heater
- Home design: Residential property; Under construction (new construction); Slab foundation; Composition roof; Built in 2026
- Construction: Cement siding
- Exterior features: Fence (back yard); Sprinkler/irrigation
Interior
- Kitchen: Dishwasher; Gas oven; Gas range; Microwave; Refrigerator; Kitchen island; Granite counters; Pantry; Breakfast bar
- Bedrooms: 3 total rooms
- Flooring: Carpet; Vinyl
- Bathrooms: 2 full bathrooms
- Heating & cooling: Central heating (gas); Central electric air conditioning; Programmable thermostat
- Interior features: Breakfast bar; Double vanity; Granite counters; Kitchen island; Kitchen and family room combo; Pantry; Window treatments; Ceiling fans; Kitchen and dining combo; Programmable thermostat; Low emissivity windows; Window coverings; Tankless water heater
- Laundry & utility: Washer hookup; Electric dryer hookup; Washer included; Dryer included
Neighborhood map
What this means for you Summary
Snapshot
- This is a 3-bed/2.0-bath land listed at $241k.
Deal economics
- At list price, monthly cash flow is $-27 ($-318/yr) — negative.
- To cash-flow at today's rent, offer at most $240k (0.3% below list).
- To meet the 1% rule (rent ≥ 1% of price), the offer needs to be $192k (20.5% below list).
- Recommended offer: $192k (20.5% below list) — sets the bar for 1% rule.
Location & tenants
- Location reads 56/100 on livability (#1,335 in TX) — a working-class tenant base; expect higher turnover. Strengths: cost of living A+, housing A-, crime B+; Watch: employment D, amenities F, commute F.
- Crosby ISD (rural): math 39% / reading 40% proficiency, ranked #369 of 826 in TX (top 45%) — families likely to look elsewhere, expect single-tenant / working-renter base with shorter leases.
- Zoned schools: Crosby Middle (math 36% / reading 37%, grade F, #786 of 1,662 statewide, top 48%, 1,549 students, 60% FRL); Highpoint School East (Crosby) (20 students, 80% FRL) — zoned schools average 70% FRL vs 50% district-wide (20 pts higher); higher-poverty schools than district average — tighter screening recommended.
- Market conditions: Rents rising (+1.5%/yr); 1172 active listings in the ZIP; solid renter incomes; 29,883 units permitted in Harris County in 2024 (8,621 in 5+ unit buildings).
Forward outlook
- Local home prices are declining (-3.0%/yr); year-one equity from $2k of loan paydown is wiped out by about $7k of value loss. Plan a longer hold.
- Harris County population projected at +47% by 2050 — long-run rental-demand tailwind backs the buy-and-hold thesis.
Negotiation context
- It's been on market 23 days — a 2% lower offer ($237k) is reasonable based on typical stale-listing flexibility.
- 3 sale attempts with the ask held roughly flat each time — persistent listings suggest the price (not the market) is what's stuck; bring a comps-based counter.
Questions for the listing agent
- What do current leases actually rent for vs. the listed asking? Can we see a recent rent roll and the last 12 months of T-12 income?
- What does the HOA fee cover, when was the last increase, and are there any pending special assessments or reserve-fund shortfalls?
- Is there a deadline driving the sale (1031 exchange, divorce, estate, relocation)? That informs how much negotiation room exists.
- Schools are F-rated, which usually means shorter tenancies and higher turnover. Who's the typical renter profile here, and what's been the actual vacancy rate?
- The area grade is low — what's the realistic commute time and amenity access for the typical tenant pool here? Any planned neighborhood developments (good or bad) we should know about?
- What's the average days-on-market for RENTAL listings here right now (not sales)? A rising rental-DOM trend means longer vacancies and softer asking-rent achievability than the comps imply.
- What's the recent tenant-quality profile in this submarket — average credit score on applications, eviction rate, late-payment / NSF rate, and stable-employment percentage? A property-management company in the area should have these aggregated.
- How much new for-sale + rental construction is in the pipeline within 1–3 miles? Heavy new supply typically softens prices + rents 12–24 months out; constrained supply supports both.
Investment metrics
- 1% rule
- 0.78% ✗
- Cap rate
- 6.16%
- Cash-on-cash
- -0.46%
- DSCR
- 0.98
- GRM
- 10.6
CMA / ARV
- ARV (median comp)
- $244,764
- List price
- $240,900
- Delta
- -1.58%
- Verdict
- FAIR
- Comps
- 20 within 1.0 mi
Projected returns pro-forma
-3.0% appreciation · 1.48% rent growth · sell at horizon
- IRR
- -18.7%
- Equity multiple
- 0.35×
- Total profit
- $-44,303
- Equity at exit
- $36,495
- IRR
- -14.2%
- Equity multiple
- 0.23×
- Total profit
- $-52,504
- Equity at exit
- $21,163
Cash invested: $68,534 (down + closing). Projections, not guarantees.
Landlord ↔ Tenant lean methodology
- Overall (STATE)
- 87 Strongly Landlord-Friendly
- State Texas
- 87 Strongly Landlord-Friendly · R+5
- County
- — inherits STATE
- City
- — inherits STATE
ZIP-level market 77532
- Home prices YoY
- -28.6%
- Rents YoY
- 1.5%
- Active inventory
- 1172
- Price-to-rent
- 10.5×
Monthly cashflow live
- Estimated rent
- $1,916 medium interval (Pro) →
- Mortgage (P&I)
- −$1,284
- Tax from tax record
- −$107 /mo · $1,279/yr
- Insurance
- −$102
- HOA
- −$48
- Vacancy / Maint / Mgmt
- −$402
- Net cashflow
- $-27
Break-even live
UW: 25.0% down · 7.5% · 30yr · 1.5% tax · 5.0% vac · 8.0% maint · 8.0% mgmt
Financing live
Cash to close
- Down payment
- $61,191
- Closing costs
- $7,343
- Reserves months
- —
- Total cash needed
- —
Loan-product check · same deal, 3 products live
Conventional
25% down · 7.5% · 30yr
- Down + closing
- —
- Monthly P&I
- —
- Monthly cashflow
- —
- DSCR
- —
- Eligible?
- —
Personal DTI + credit; lowest rate.
DSCR
20% down · 8.5% · 30yr
- Down + closing
- —
- Monthly P&I
- —
- Monthly cashflow
- —
- DSCR
- —
- Eligible?
- —
No personal income docs; deal must DSCR.
Hard money
10% down · 12.0% · 12mo
- Down + closing
- —
- Monthly P&I
- —
- Monthly cashflow
- —
- DSCR
- —
- Eligible?
- —
Short-term bridge; refi at stabilization.
HOA detail
- Monthly dues
- $48 · $576/yr
Listing history 16 events
-
2026-06-18days on market $240,900 Active 23 DOM
-
2026-06-17days on market $240,900 Active 22 DOM
-
2026-06-16days on market $240,900 Active 21 DOM
-
2026-06-15days on market $240,900 Active 20 DOM
-
2026-06-13days on market $240,900 Active 18 DOM
-
2026-06-09days on market $240,900 Active 14 DOM
-
2026-06-08days on market $240,900 Active 13 DOM
-
2026-06-07days on market $240,900 Active 12 DOM
-
2026-06-04days on market $240,900 Active 9 DOM
-
2026-06-03days on market $240,900 Active 8 DOM
-
2026-06-02days on market $240,900 Active 7 DOM
-
2026-06-01days on market $240,900 Active 6 DOM
-
2026-05-31days on market $240,900 Active 5 DOM
-
2026-05-14status Active 194-char remark
Show marketing remark (343 chars)
The attractive Aspen plan centers around a large open kitchen, complete with an island and a built-in pantry. An airy great room-ideal for relaxing and entertaining-is steps away, as is a dining area. There are three spacious bedrooms, including a primary suite with a walk-in closet and a private bath with dual vanities and a walk-in shower.
-
2026-05-08historical 194-char remark
Show marketing remark (343 chars)
The attractive Aspen plan centers around a large open kitchen, complete with an island and a built-in pantry. An airy great room-ideal for relaxing and entertaining-is steps away, as is a dining area. There are three spacious bedrooms, including a primary suite with a walk-in closet and a private bath with dual vanities and a walk-in shower.
-
2026-04-29$240,900 Active 194-char remark
Show marketing remark (343 chars)
The attractive Aspen plan centers around a large open kitchen, complete with an island and a built-in pantry. An airy great room-ideal for relaxing and entertaining-is steps away, as is a dining area. There are three spacious bedrooms, including a primary suite with a walk-in closet and a private bath with dual vanities and a walk-in shower.
ⓘ Source: listings_history table (triggers on properties + properties_extension) + one-shot
backfill from property_details.listing_events for pre-trigger history.
Tax reassessment forecast TX · Resets to sale price
- Current annual tax
- $1,279 · $107/mo
- Projected year-2 tax
- $4,408 · $367/mo
- Expected delta
- +$3,129/yr (+$261/mo · 244.7%)
ⓘ Screening estimate from a state-policy table — verify with the county assessor before closing.
Nearby sold comps map
Loading sold comps map…
Walkable amenities ~0.75 mi
Loading nearby amenities…
Taxation est. · year 1
- Rental income
- $22,991
- − Mortgage interest
- −$13,711
- − Property taxes
- −$1,279
- − Insurance
- −$1,224
- − Repairs & maintenance
- −$1,839
- − Management
- −$1,839
- − HOA
- −$576
- − Depreciation
- −$7,120
- Taxable loss
- −$4,597
- Est. tax savings @ 24.0%
- +$1,103
- After-tax cash flow
- $785/yr
For passive investors: Depreciation is non-cash, so a rental often shows a tax loss while cash-flowing — sheltering income. Rental losses are passive: they offset passive income freely, and up to $25,000/yr can offset ordinary (W-2) income if you actively participate and your MAGI is under $100k (phasing out to $0 by $150k); unused losses carry forward. On sale, claimed depreciation is recaptured at up to 25%, and gains may owe capital-gains tax (a 1031 exchange can defer both). Figures are a year-1 estimate at your 24.0% rate — not tax advice; consult a CPA.
Schools (NCES district)
- District
- Crosby ISD
- NCES district ID
- 4815750
- Math proficiency
- 39% ▼ -13.00%
- Reading proficiency
- 40% ▼ -5.00%
- Median HH income
- $61,079
- Composite
- 35.14/100
- National rank
- #5012
- State rank
- #369 of 826 in TX
Livability — Barrett
- Score
- 56/100
- State rank
- #1335
- US rank
- #22991
Category grades
Schools grade is shown separately in the Schools card above.
Census & demographics
- Census place
- Barrett, TX
- County
- Harris County · 4,702,590 people
- Metro
- Houston-The Woodlands-Sugar Land, TX
- Population (ZIP)
- 33,780
- Household income
- $92,201
- Rent vs Own
- Severe rent burden
- 382.0
Population outlook (Harris County) Hauer SSP2
- Today (2025)
- 5,571,493 people
- By 2030
- 6,089,821 · +9.3%
- By 2040
- 7,142,806 · +28.2%
- By 2050
- 8,185,864 · +46.9%
- By 2075
- 10,574,329 · +89.8%
- By 2100
- 12,109,958 · +117.4%
Race, ethnicity, and origin ACS 2023
- Neighborhood character
- Diverse neighborhood (Simpson 0.60)
- Race & ethnicity
- White 54% Hispanic / Latino 31% Two or more races 16% Black 9%
- Hispanic origin (detail)
- Mexican 24%
- Common ancestry
- Lithuanian 4% Romanian 3% Italian 2%
- Foreign-born
- 10% · Canada
- Languages at home
- 78% English-only · Spanish 21%
Political lean MEDSL · Harris
- 2024 margin
- Lean D (+5.5) · D 52.0% · R 46.4% · Other 1.6%
- 2008→2024 swing
- +3.9pp toward D · 2008: 1.6pp · 2024: 5.5pp
- All cycles
- 2024: D+5.5 2020: D+13.3 2016: D+12.4 2012: D+0.1 2008: D+1.6
Not yet ingested
- Civics
- —
Market trends
- HPI YoY
- ▼ -105.63%
- Current HPI
- 264.0126
- Rent YoY
- ▲ 1.48%
- Metro
- Houston-The Woodlands-Sugar Land, TX
- State GDP YoY
- ▲ 3.95%
- F500 in state
- 110
Industry mix (Fortune 500 HQ in TX)
| Industry | F500 HQs | Revenue |
|---|---|---|
| Energy | 16 | $1,198B |
|
||
| Technology | 5 | $198B |
|
||
| Engineering / Construction | 4 | $72B |
|
||
| Energy Services | 3 | $60B |
|
||
| Utilities | 3 | $41B |
|
||
| Healthcare | 2 | $330B |
|
||
Price history
+0.0% since first listed4 events — show timeline
- 2026-05-26 Listed $240,900 HARMLS
- 2026-05-14 Relisted — Zillow
- 2026-05-08 Delisted — Zillow
- 2026-04-29 Listed $240,900 Zillow
Property tax history
-4.7%/yrLatest (2025): $1,279 · -4.7% YoY. Source: county tax records.
Cash-flow waterfall
monthlySold comps — $/sqft
last 12 mo · ≤1 miLoading sold comps…