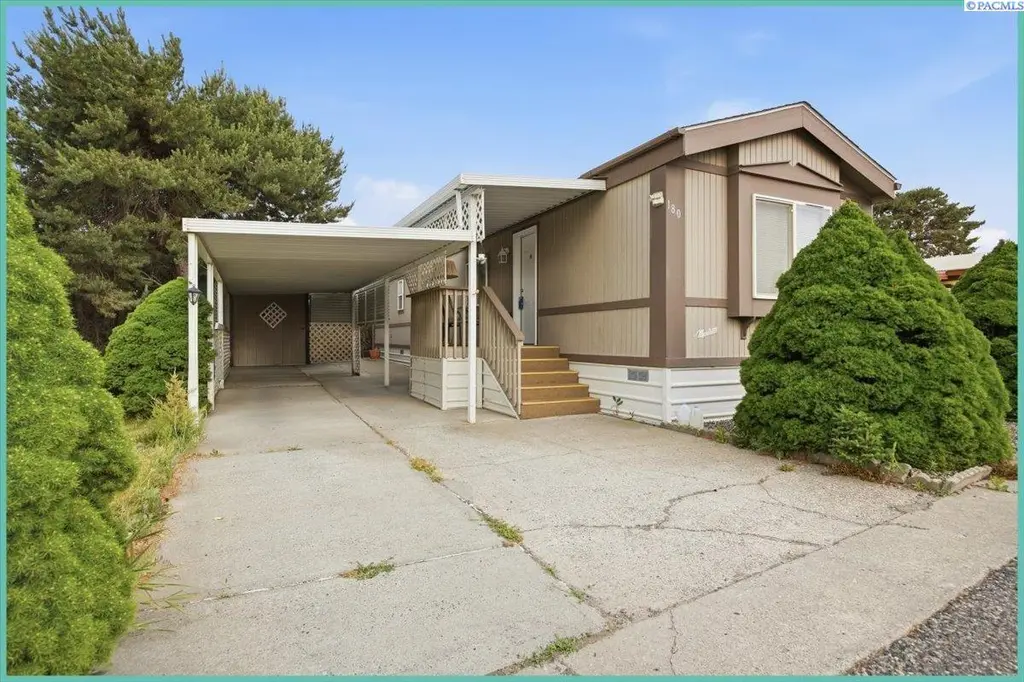
3324 W 19th Ave #180 Ave #180 · Kennewick, WA
Flood risk 1/10 · Minimal
- FEMA flood zone
- —
- Chance of flooding over 30 yrs
- 0.0%
- Est. flood insurance / yr
- —
Fire risk 4/10 · Minor
- Est. fire insurance / yr
- $604 – $1,122
Heat risk 4/10 · Minor
- Hot days now (above 99°F)
- 6 days/yr
- Hot days in 30 yrs
- 13 days/yr
Wind risk 1/10 · Minimal
- Chance of severe wind over 30 yrs
- —
Air-quality risk 8/10 · Major
- Unhealthy air days now
- 14 days/yr
- Unhealthy air days in 30 yrs
- 15 days/yr
Risk factors via First Street. Map © Google.
Why this score? — see what drove the B grade
The composite is a weighted blend of 9 inputs, each scored 0–100. Each bar is that input's sub-score; the figure is the points it added to the 100-point composite (weight × sub-score).
- Cash flow +30.0/30.0
- 1% rule +10.0/10.0
- DSCR +10.0/10.0
- ARV discount +7.5/15.0
- Schools +4.6/10.0
- Livability +3.9/5.0
- Rent growth +2.5/5.0
- Condition / age +2.5/5.0
- Appreciation +0.0/10.0
$80,000
🖨 Deal sheet 📄 Offer letter ✓ Due diligence
Listing remarks MLS
MLS# 272916 Your new HOME has been completely refreshed inside! You'll want to bring your things and move right in. Budget friendly and low maintenance. This home has everything you need. Freshly painted with updated kitchen and bathroom. New flooring, doors and trim throughout. Spend all your days at the beautiful community pool as soon as the sun comes out for summer! Then come home and relax in your own little bright and spacious oasis. With lots of windows, you'll have a cheery space to spend your days. The kitchen has a great picture window for natural light, new cupboards, sink, countertops and backsplash. Lots of space for cooking and entertaining and a cute little nook for a coffee bar or desk area. Down the hallway you'll find the cutest remodeled bathroom with a new tile shower/tub, two bedrooms and a laundry area. All complete with new closet doors, trim and blinds. Outside you will find a nice sized shed for storage. A covered porch and attached carport for parking is an added bonus. Plus LOCATION IS PRIMO with easy access to the highway, shopping, hospitals, schools and dining. Lot rent includes unlimited use of the inground swimming pool and community center. This home is a must see! Call your favorite Realtor and schedule your private showing today.
Key facts
- Community pool
- Built 1994
- Listed 19 days
Tags
Property features AI
Exterior
- Parking: Carport (no garage)
- Utilities: Public water; Electric on property; Sewer connected
- Home design: Manufactured home (single wide); One story; New construction; Located in a mobile home park
- Construction: Composition roof; Marlette manufacturer
- Exterior features: Front porch; Community pool; Shed(s)
Interior
- Kitchen: Dishwasher; Range; Oven; Water heater
- Flooring: Carpet; Laminate
- Bathrooms: One full bathroom
- Heating & cooling: Central air conditioning
- Interior features: Window coverings; Crawl space (no basement)
Neighborhood map
What this means for you Summary
Snapshot
- This is a 2-bed/1.0-bath manufactured listed at $80k.
Deal economics
- At list price, monthly cash flow is $708 ($8k/yr) — positive.
- The deal already cash-flows at list — no discount required.
- Meets the 1% rule at list price ($1k rent vs $80k).
- Recommended offer: $79k (1.5% below list) — sets the bar for market timing.
- Cap rate 16.9% vs local median 3.3% in Kennewick — top-decile yield for the area; either an underpriced asset or a hidden risk that comps aren't pricing in. Stress-test before assuming the spread holds.
Location & tenants
- Location reads 78/100 on livability (#131 in WA, #2,599 nationally) — a middle-class / working-renter tenant base. Strengths: commute A+, housing A+, health & safety A; Watch: schools D+, amenities D+, crime F.
- Kennewick School District (urban): math 43% / reading 58% proficiency, ranked #141 of 291 in WA (top 48%) — acceptable for families but not a draw, mixed tenant base, ~2y average lease.
- Market conditions: 309 active listings in the ZIP; 10 comparable units currently listed for rent nearby; rentals at typical pace (median 21d on market — plan ~3-4 weeks tenant-placement turnaround); high-income renter base; 1,532 units permitted in Benton County in 2024 (389 in 5+ unit buildings).
- This rent is only 16% of the median local income ($111k/yr) — well below the 30% rent-burden line; pricing power to push rent on renewal without tenant pushback.
Forward outlook
- Local home prices are declining (-3.0%/yr); year-one equity from $553 of loan paydown is wiped out by about $2k of value loss. Plan a longer hold.
- Benton County population projected at +32% by 2050 — long-run rental-demand tailwind backs the buy-and-hold thesis.
- At projected returns (-3.0% appreciation + 3.0% rent growth), your $22k cash investment doubles in ~4 years — after that, you're playing with house money.
Negotiation context
- It's been on market 19 days — a 2% lower offer ($79k) is reasonable based on typical stale-listing flexibility.
- 4 sale attempts since 5y ago with the ask held roughly flat each time — persistent listings suggest the price (not the market) is what's stuck; bring a comps-based counter.
- Current owner paid $69k; 16% above their basis — modest negotiation headroom, anchor on the comps not their cost.
Questions for the listing agent
- Is there a deadline driving the sale (1031 exchange, divorce, estate, relocation)? That informs how much negotiation room exists.
- Schools are D-rated, which usually means shorter tenancies and higher turnover. Who's the typical renter profile here, and what's been the actual vacancy rate?
- Crime grade is F in this area — have there been break-ins, vandalism, or insurance claims at this property in the last 3 years? What carrier currently insures it and at what premium?
- What's the average days-on-market for RENTAL listings here right now (not sales)? A rising rental-DOM trend means longer vacancies and softer asking-rent achievability than the comps imply.
- What's the recent tenant-quality profile in this submarket — average credit score on applications, eviction rate, late-payment / NSF rate, and stable-employment percentage? A property-management company in the area should have these aggregated.
- How much new for-sale + rental construction is in the pipeline within 1–3 miles? Heavy new supply typically softens prices + rents 12–24 months out; constrained supply supports both.
Investment metrics
- 1% rule
- 1.87% ✓
- Cap rate
- 16.91%
- Cash-on-cash
- 37.92%
- DSCR
- 2.69
- GRM
- 4.5
CMA / ARV
No comps found within radius.
Projected returns pro-forma
-3.0% appreciation · 3.0% rent growth · sell at horizon
- IRR
- 33.9%
- Equity multiple
- 2.43×
- Total profit
- $32,095
- Equity at exit
- $11,928
- IRR
- 40.8%
- Equity multiple
- 4.83×
- Total profit
- $85,899
- Equity at exit
- $6,917
Cash invested: $22,400 (down + closing). Projections, not guarantees.
Landlord ↔ Tenant lean methodology
- Overall (STATE)
- 28 Tenant-Leaning
- State Washington
- 28 Tenant-Leaning · D+8
- County
- — inherits STATE
- City
- — inherits STATE
ZIP-level market 99338
- Active inventory
- 309
- Price-to-rent
- 4.5×
Monthly cashflow live
- Estimated rent
- $1,497 high interval (Pro) →
- Mortgage (P&I)
- −$420
- Tax from tax record
- −$22 /mo · $265/yr
- Insurance
- −$33
- HOA
- −$0
- Vacancy / Maint / Mgmt
- −$314
- Net cashflow
- $708
Break-even live
UW: 25.0% down · 7.5% · 30yr · 1.5% tax · 5.0% vac · 8.0% maint · 8.0% mgmt
Financing live
Cash to close
- Down payment
- $20,000
- Closing costs
- $2,400
- Reserves months
- —
- Total cash needed
- —
Loan-product check · same deal, 3 products live
Conventional
25% down · 7.5% · 30yr
- Down + closing
- —
- Monthly P&I
- —
- Monthly cashflow
- —
- DSCR
- —
- Eligible?
- —
Personal DTI + credit; lowest rate.
DSCR
20% down · 8.5% · 30yr
- Down + closing
- —
- Monthly P&I
- —
- Monthly cashflow
- —
- DSCR
- —
- Eligible?
- —
No personal income docs; deal must DSCR.
Hard money
10% down · 12.0% · 12mo
- Down + closing
- —
- Monthly P&I
- —
- Monthly cashflow
- —
- DSCR
- —
- Eligible?
- —
Short-term bridge; refi at stabilization.
Rent comps 10 comps
| Address | Beds | Baths | Sqft | Rent | $/sqft | DOM | Units | Dist |
|---|---|---|---|---|---|---|---|---|
| 4112 W 24th Ave Kennewick, WA | 1.0–2.0 | 1.0–2.0 | 681 | $1,875 | $2.75 | 21d | 4 | 0.56mi |
| 337 S Johnson St Unit F Kennewick, WA | 1.0 | 1.0 | 550 | $875 | $1.59 | 21d | 1 | 0.92mi |
| 337 S Johnson St Unit A Kennewick, WA | 1.0 | 1.0 | 550 | $975 | $1.77 | 43d | 1 | 0.92mi |
| 513 S Anderson St Kennewick, WA | 2.0 | 1.0 | 720 | $1,495 | $2.08 | 21d | 1 | 1.00mi |
| 3703 W Kennewick Ave Kennewick, WA | 1.0–2.0 | 1.0 | 782 | $1,594 | $2.04 | 13d | 8 | 1.13mi |
| 12 S Morain St Kennewick, WA | 1.0–3.0 | 1.0 | 604 | $1,249 | $2.07 | 13d | 3 | 1.13mi |
| 119 S Conway Pl Kennewick, WA | 2.0 | 1.0 | 711 | $1,200 | $1.69 | 21d | 1 | 1.21mi |
| 1608 W 14th Ave Unit 1614 Kennewick, WA | 2.0 | 1.0 | 750 | $995 | $1.33 | 21d | 1 | 1.27mi |
| 9 N Waverly Pl Kennewick, WA | 1.0 | 1.0 | 600 | $1,222 | $2.04 | 13d | 2 | 1.39mi |
| 5207 W Hildebrand Blvd Kennewick, WA | 2.0 | 1.0 | 656 | $2,380 | $3.63 | 43d | 17 | 1.43mi |
Listing history 16 events
-
2026-06-18days on market $80,000 Active 19 DOM
-
2026-06-17days on market $80,000 Active 18 DOM
-
2026-06-16days on market $80,000 Active 17 DOM
-
2026-06-15days on market $80,000 Active 16 DOM
-
2026-06-14days on market $80,000 Active 14 DOM
-
2026-06-13days on market $80,000 Active 13 DOM
-
2026-06-10days on market $80,000 Active 11 DOM
-
2026-06-09days on market $80,000 Active 10 DOM
-
2026-06-08days on market $80,000 Active 9 DOM
-
2026-06-07days on market $80,000 Active 8 DOM
-
2026-06-05days on market $80,000 Active 5 DOM
-
2026-06-03days on market $80,000 Active 4 DOM
-
2026-06-02days on market $80,000 Active 3 DOM
-
2026-06-01days on market $80,000 Active 2 DOM
-
2026-05-30remarks 550-char remark
-
2026-05-30$80,000 Active 1 DOM
ⓘ Source: listings_history table (triggers on properties + properties_extension) + one-shot
backfill from property_details.listing_events for pre-trigger history.
Tax reassessment forecast WA · Resets to sale price
- Current annual tax
- $265 · $22/mo
- Projected year-2 tax
- $784 · $65/mo
- Expected delta
- +$519/yr (+$43/mo · 196.2%)
ⓘ Screening estimate from a state-policy table — verify with the county assessor before closing.
Climate risk First Street
- Flood 1/10 Low 0% chance over 30 yrs
- Wildfire 4/10 Moderate
- Heat 4/10 Moderate 6 d/yr ≥99°F today · 13 d/yr by 30 yrs out
- Wind 1/10 Low
- Air quality 8/10 Severe 14 unhealthy d/yr today · 15 by 30 yrs out
Nearby sold comps map
Loading sold comps map…
Walkable amenities ~0.75 mi
Loading nearby amenities…
Taxation est. · year 1
- Rental income
- $17,966
- − Mortgage interest
- −$4,481
- − Property taxes
- −$265
- − Insurance
- −$400
- − Repairs & maintenance
- −$1,437
- − Management
- −$1,437
- − Depreciation
- −$2,327
- Taxable income
- $7,619
- Est. tax owed @ 24.0%
- −$1,828
- After-tax cash flow
- $6,666/yr
For passive investors: Depreciation is non-cash, so a rental often shows a tax loss while cash-flowing — sheltering income. Rental losses are passive: they offset passive income freely, and up to $25,000/yr can offset ordinary (W-2) income if you actively participate and your MAGI is under $100k (phasing out to $0 by $150k); unused losses carry forward. On sale, claimed depreciation is recaptured at up to 25%, and gains may owe capital-gains tax (a 1031 exchange can defer both). Figures are a year-1 estimate at your 24.0% rate — not tax advice; consult a CPA.
Schools (NCES district)
- District
- Kennewick School District
- NCES district ID
- 5303930
- Math proficiency
- 43% ▼ -1.00%
- Reading proficiency
- 58% ▬ 0.00%
- Median HH income
- $54,191
- Composite
- 45.56/100
- National rank
- #5667
- State rank
- #141 of 291 in WA
Livability — Kennewick
- Score
- 78/100
- State rank
- #131
- US rank
- #2599
Category grades
Schools grade is shown separately in the Schools card above.
Census & demographics
- Census place
- Kennewick, WA
- County
- Benton County · 186,895 people
- City population
- 104,655
- Metro
- Kennewick-Richland, WA
- Population (ZIP)
- 20,633
- Household income
- $111,042
- Rent vs Own
- Severe rent burden
- 281.0
Population outlook (Benton County) Hauer SSP2
- Today (2025)
- 219,421 people
- By 2030
- 233,813 · +6.6%
- By 2040
- 262,134 · +19.5%
- By 2050
- 290,100 · +32.2%
- By 2075
- 363,525 · +65.7%
- By 2100
- 418,667 · +90.8%
Race, ethnicity, and origin ACS 2023
- Neighborhood character
- Predominantly White (74%)
- Race & ethnicity
- White 74% Hispanic / Latino 16% Two or more races 10% Black 2% Asian 2%
- Hispanic origin (detail)
- Mexican 15%
- Common ancestry
- Portuguese 3% Slovak 3% Iranian 2%
- Foreign-born
- 9% · Canada
- Languages at home
- 83% English-only · Spanish 10% Arabic 2% Other Indo-European 1%
Political lean MEDSL · Benton
- 2024 margin
- Strong R (+21.9) · D 37.7% · R 59.6% · Other 2.7%
- 2008→2024 swing
- +4.2pp toward D · 2008: -26.1pp · 2024: -21.9pp
- All cycles
- 2024: R+21.9 2020: R+21.0 2016: R+26.6 2012: R+27.0 2008: R+26.1
Not yet ingested
- Civics
- —
Market trends
- HPI YoY
- ▼ -167.63%
- Current HPI
- 229.7474
- Rent YoY
- —
- Metro
- Kennewick-Richland, WA
- State GDP YoY
- ▲ 4.65%
- F500 in state
- 22
Industry mix (Fortune 500 HQ in WA)
| Industry | F500 HQs | Revenue |
|---|---|---|
| Retail | 2 | $269B |
|
||
| Technology / Retail | 1 | $638B |
|
||
| Technology | 1 | $245B |
|
||
| Telecommunications | 1 | $38B |
|
||
| Food / Beverage | 1 | $36B |
|
||
| Automotive / Trucks | 1 | $34B |
|
||
Price history
+166.7% since first listed10 events — show timeline
- 2026-05-29 Listed $80,000 PACMLS
- 2024-02-09 Sold (MLS) $69,000 PACMLS
- 2024-01-24 Pending — PACMLS
- 2024-01-06 Contingent — PACMLS
- 2023-12-18 Listed $69,000 PACMLS
- 2023-10-13 Sold (MLS) $41,000 PACMLS
- 2023-09-30 Listed $55,000 PACMLS
- 2023-09-30 Delisted — PACMLS
- 2021-05-04 Sold (MLS) $30,000 PACMLS
- 2021-04-15 Listed $30,000 PACMLS
Property tax history
+4.9%/yrLatest (2026): $265 · -5.7% YoY. Source: county tax records.
Cash-flow waterfall
monthlySold comps — $/sqft
last 12 mo · ≤1 miLoading sold comps…