 Multi-family
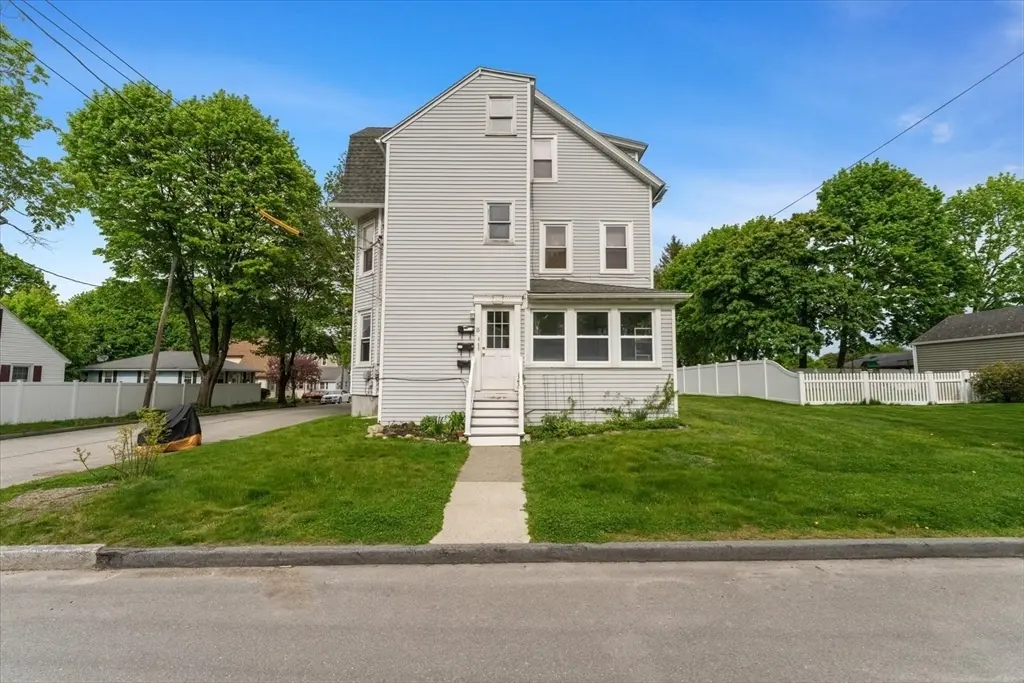
15 Steele St · Worcester, MA
Flood risk 1/10 · Minimal
- FEMA flood zone
- X (unshaded)
- Chance of flooding over 30 yrs
- 0.0%
- Est. flood insurance / yr
- $473 – $860
Fire risk 1/10 · Minimal
- Est. fire insurance / yr
- $915 – $1,699
Heat risk 4/10 · Minor
- Hot days now (above 94°F)
- 6 days/yr
- Hot days in 30 yrs
- 14 days/yr
Wind risk 6/10 · Moderate
- Chance of severe wind over 30 yrs
- 27.0%
Air-quality risk 2/10 · Minimal
- Unhealthy air days now
- 1 days/yr
- Unhealthy air days in 30 yrs
- 2 days/yr
Risk factors via First Street. Map © Google.
Why this score? — see what drove the D grade
The composite is a weighted blend of 9 inputs, each scored 0–100. Each bar is that input's sub-score; the figure is the points it added to the 100-point composite (weight × sub-score).
- Cash flow +18.8/30.0
- DSCR +5.9/10.0
- 1% rule +4.4/10.0
- Livability +4.4/5.0
- ARV discount +4.0/15.0
- Rent growth +2.5/5.0
- Condition / age +2.5/5.0
- Schools +2.0/10.0
- Appreciation +0.0/10.0
$619,900
🖨 Deal sheet (PDF) 📄 Offer letter ✓ Due diligence
Multi-family units
County records classify this as Multi-Family (2-4 Unit). Listing-text estimate: 1 unit. estimate disagrees with records
Listing remarks MLS
*INVESTORS* take notice! Three family in a great area. Primarily owner occupied singe family homes residential neighborhood. Close to all major highways including Rts 290, 146, 20, and the mass pike! Seconds from the new Shoppes at Blackstone Valley! Without too much work this property will quickly be ready to rent out with very nice apartments!
Key facts
- Separate utilities
- Vinyl siding
- 2007 roof
Tags
Property features AI
Finance
- Other: Total building area 2,207; Lot size approximately 0.14 acres; Three leased units (each has leased status); Basement: full, interior entry, bulkhead, concrete, unfinished
- HOA & community: Access to public transportation, shopping, parks, highway, houses of worship, private and public schools, T-Station, and university
Exterior
- Parking: Open parking available
- Utilities: Public water; Public sewer; Electric for range
- Home design: 3-family property; 3 stories; Renovated since original construction; Built with stone foundation
- Construction: Stone foundation; Shingle roof; Year built per public records; renovated since
- Exterior features: Shingle roof; Porch (enclosed); Balcony/deck; Corner lot; Cleared, level yard
Interior
- Kitchen: Range; Dishwasher; Refrigerator; Pantry; Upgraded cabinets
- Flooring: Wood flooring; Vinyl flooring
- Bathrooms: Three full bathrooms
- Heating & cooling: Central forced air heating (natural gas); Heating present in three heat zones/units
- Interior features: Ceiling fans; Lead certification treated; Storage space; High-speed internet available; Upgraded cabinets; Bathroom with tub and shower; Remodeled; Pantry; Living room; Sunroom; Total of 11 rooms
- Laundry & utility: Sump pump in basement
Neighborhood map
What this means for you Summary
Snapshot
- This is a 5-bed/3.0-bath multifamily listed at $620k.
Deal economics
- At list price, monthly cash flow is $622 ($7k/yr) — positive.
- The deal already cash-flows at list — no discount required.
- To meet the 1% rule (rent ≥ 1% of price), the offer needs to be $582k (6.1% below list).
- Recommended offer: $582k (6.1% below list) — sets the bar for 1% rule.
- Cap rate 7.5% vs local median 4.1% in Worcester — top-decile yield for the area; either an underpriced asset or a hidden risk that comps aren't pricing in. Stress-test before assuming the spread holds.
Location & tenants
- Location reads 87/100 on livability (#9 in MA, #312 nationally) — a professional / high-income tenant draw. Strengths: crime A+, amenities A+, commute A+; Watch: cost of living D.
- Worcester (urban): math 17% / reading 30% proficiency, ranked #280 of 302 in MA (top 93%) — low school quality limits family demand, transient renter base, plan for 1-2y turnover; 66% free/reduced lunch — lower-income household profile, screen leases tightly.
- Zoned schools: Quinsigamond (math 8% / reading 20%, grade F, #881 of 938 statewide, top 94%, 713 students, 0% FRL); Sullivan Middle (math 18% / reading 30%, grade F, #238 of 305 statewide, top 78%, 827 students, 0% FRL); South High Community (math 26% / reading 36%, grade F, #266 of 343 statewide, top 77%, 1,666 students, 0% FRL) — zoned schools average 0% FRL vs 66% district-wide (66 pts lower); this property's tenant base skews higher-income than the district average.
- Market conditions: 16 active listings in the ZIP; 5 comparable units currently listed for rent nearby; rentals lingering (median 46d on market — plan ~5-8 weeks vacancy on turnover, expect pricing pressure); 60% of comp listings sitting > 30 days — soft ceiling on asking rent; solid renter incomes; 2,293 units permitted in Worcester County in 2024 (1,205 in 5+ unit buildings).
- At $5,822/mo this rent would consume 89% of the median local household income ($79k/yr) (locally 379% of renters already pay >50% of income on rent) — very limited rent-growth headroom before tenants either downsize or default.
Forward outlook
- Local home prices are declining (-3.0%/yr); year-one equity from $4k of loan paydown is wiped out by about $19k of value loss. Plan a longer hold.
Negotiation context
- It's been on market 38 days — a 3% lower offer ($601k) is reasonable based on typical stale-listing flexibility.
- 3 sale attempts since 26y ago with the ask held roughly flat each time — persistent listings suggest the price (not the market) is what's stuck; bring a comps-based counter.
- Current owner paid $175k; list at $620k implies a 254% gain — meaningful room to come down on a strong offer.
Risks & watch-outs
- Watch-outs: built in 1890 — expect roof / HVAC / electrical / plumbing capex.
- Climate carrying-cost: major wind risk, 27% chance of damaging wind over 30y — expect insurance premiums to compound above CPI over the hold.
Questions for the listing agent
- It's been on market 38 days. Have you received any prior offers? Is the seller open to a 6% concession, seller financing, or rate buy-down credit?
- Built in 1890 — when were the roof, HVAC, electrical panel, plumbing, and water heater last replaced?
- Is there a deadline driving the sale (1031 exchange, divorce, estate, relocation)? That informs how much negotiation room exists.
- The area grade is low — what's the realistic commute time and amenity access for the typical tenant pool here? Any planned neighborhood developments (good or bad) we should know about?
- What's the average days-on-market for RENTAL listings here right now (not sales)? A rising rental-DOM trend means longer vacancies and softer asking-rent achievability than the comps imply.
- What's the recent tenant-quality profile in this submarket — average credit score on applications, eviction rate, late-payment / NSF rate, and stable-employment percentage? A property-management company in the area should have these aggregated.
- How much new apartment / multifamily construction is in the pipeline within 1–3 miles? Heavy new supply (>2% of stock underway) typically softens rents 12–24 months out; light construction supports rent growth.
Investment metrics
- 1% rule
- 0.94% ✗
- Cap rate
- 7.50%
- Cash-on-cash
- 4.30%
- DSCR
- 1.19
- GRM
- 8.9
CMA / ARV
- ARV (median comp)
- $574,760
- List price
- $619,900
- Delta
- 7.85%
- Verdict
- FAIR
- Comps
- 20 within 1.0 mi
Show comp detail 4 sales within ~0.75 mi
| Address | Dist | Beds/Ba | Sqft | Sold | Price | $/sf | Match |
|---|---|---|---|---|---|---|---|
| 6 Beckman St | 0.12mi | 5/3.0 | 2,313 (+5%) | 3mo | $615,000 | $266 | 84 |
| 30 Whipple St | 0.22mi | 4/2.0 (-1) | 2,212 (+0%) | 11mo | $565,000 | $255 | 71 |
| 92 Greenwood St | 0.38mi | 6/2.0 (+1) | 2,363 (+7%) | 8mo | $690,000 | $292 | 54 |
| 12 Southold Rd | 0.65mi | 5/2.0 | 2,477 (+12%) | 19mo | $610,000 | $246 | 30 |
Match score weights: distance 35% · size 25% · config 20% · recency 20%. Top-matched comps best support the ARV.
Projected returns pro-forma
-3.0% appreciation · 3.0% rent growth · sell at horizon
- IRR
- -9.6%
- Equity multiple
- 0.65×
- Total profit
- $-60,924
- Equity at exit
- $92,429
- IRR
- -0.2%
- Equity multiple
- 0.99×
- Total profit
- $-2,434
- Equity at exit
- $53,598
Cash invested: $173,572 (down + closing). Projections, not guarantees.
Landlord ↔ Tenant lean methodology
- Overall (STATE)
- 20 Strongly Tenant-Friendly
- State Massachusetts
- 20 Strongly Tenant-Friendly · D+15
- County
- — inherits STATE
- City
- — inherits STATE
ZIP-level market 01607
- Home prices YoY
- -5.3%
- Active inventory
- 16
- Price-to-rent
- 26.6×
Monthly cashflow live
- Estimated rent
- $5,822 high interval (Pro) →
- Mortgage (P&I)
- −$3,251
- Tax from tax record
- −$468 /mo · $5,617/yr
- Insurance
- −$258
- HOA
- −$0
- Vacancy / Maint / Mgmt
- −$1,223
- Net cashflow
- $622
Break-even live
Sensitivity live
| Price | -10% $973 | -5% $798 | +0% $622 | +5% $447 | +10% $271 |
|---|---|---|---|---|---|
| Rent | -10% $162 | -5% $392 | +0% $622 | +5% $852 | +10% $1,082 |
| Rate | -1.0pp $934 | -0.5pp $780 | base $622 | +0.5pp $462 | +1.0pp $298 |
3-unit breakdown (identical units grouped — click to expand)
| Units | Beds | Baths | Est. rent |
|---|---|---|---|
| 3× units | 2 | 1 | $5,823 |
| #1 | 2 | 1 | $1,941 |
| #2 | 2 | 1 | $1,941 |
| #3 | 2 | 1 | $1,941 |
| Total (3 units) | $5,822 | ||
UW: 25.0% down · 7.5% · 30yr · 1.5% tax · 5.0% vac · 8.0% maint · 8.0% mgmt
Financing live
Cash to close
- Down payment
- $154,975
- Closing costs
- $18,597
- Reserves months
- —
- Total cash needed
- —
Loan-product check · same deal, 3 products live
Conventional
25% down · 7.5% · 30yr
- Down + closing
- —
- Monthly P&I
- —
- Monthly cashflow
- —
- DSCR
- —
- Eligible?
- —
Personal DTI + credit; lowest rate.
DSCR
20% down · 8.5% · 30yr
- Down + closing
- —
- Monthly P&I
- —
- Monthly cashflow
- —
- DSCR
- —
- Eligible?
- —
No personal income docs; deal must DSCR.
Hard money
10% down · 12.0% · 12mo
- Down + closing
- —
- Monthly P&I
- —
- Monthly cashflow
- —
- DSCR
- —
- Eligible?
- —
Short-term bridge; refi at stabilization.
Rent comps 5 comps
| Address | Beds | Baths | Sqft | Rent | $/sqft | DOM | Units | Dist |
|---|---|---|---|---|---|---|---|---|
| 11 Clay St Worcester, MA | 4.0 | 2.0 | 1593 | $3,950 | $2.48 | 16d | 1 | 0.79mi |
| 74 Esther St Unit 1 Worcester, MA | 4.0 | 1.0 | 1500 | $2,400 | $1.60 | 23d | 1 | 0.85mi |
| 90 Fairfax Rd Unit 3 Worcester, MA | 4.0 | 1.0 | 1400 | $2,750 | $1.96 | 45d | 1 | 0.94mi |
| 70 Seymour St Unit 2 Worcester, MA | 4.0 | 1.0 | 1500 | $2,550 | $1.70 | 45d | 1 | 1.31mi |
| 70 Seymour St Unit 1 Worcester, MA | 4.0 | 1.0 | 1500 | $2,600 | $1.73 | 45d | 1 | 1.31mi |
Listing history 29 events
-
2026-06-22days on market $619,900 Active 38 DOM
-
2026-06-18days on market $619,900 Active 35 DOM
-
2026-06-17days on market $619,900 Active 34 DOM
-
2026-06-16days on market $619,900 Active 33 DOM
-
2026-06-15days on market $619,900 Active 32 DOM
-
2026-06-14days on market $619,900 Active 30 DOM
-
2026-06-10days on market $619,900 Active 27 DOM
-
2026-06-09days on market $619,900 Active 26 DOM
-
2026-06-08days on market $619,900 Active 25 DOM
-
2026-06-07days on market $619,900 Active 24 DOM
-
2026-06-05days on market $619,900 Active 21 DOM
-
2026-06-03days on market $619,900 Active 20 DOM
-
2026-06-02days on market $619,900 Active 19 DOM
-
2026-06-01days on market $619,900 Active 18 DOM
-
2026-05-31days on market $619,900 Active 17 DOM
-
2026-05-31days on market $619,900 Active 16 DOM
-
2026-05-14$619,900 New 1048-char remark
-
2007-07-12soldstatus $175,000 347-char remark
Show marketing remark (347 chars)
*INVESTORS* take notice! Three family in a great area. Primarily owner occupied singe family homes residential neighborhood. Close to all major highways including Rts 290, 146, 20, and the mass pike! Seconds from the new Shoppes at Blackstone Valley! Without too much work this property will quickly be ready to rent out with very nice apartments!
-
2007-07-12soldstatus $175,000
Show marketing remark (347 chars)
*INVESTORS* take notice! Three family in a great area. Primarily owner occupied singe family homes residential neighborhood. Close to all major highways including Rts 290, 146, 20, and the mass pike! Seconds from the new Shoppes at Blackstone Valley! Without too much work this property will quickly be ready to rent out with very nice apartments!
-
2007-06-28historical 347-char remark
Show marketing remark (347 chars)
*INVESTORS* take notice! Three family in a great area. Primarily owner occupied singe family homes residential neighborhood. Close to all major highways including Rts 290, 146, 20, and the mass pike! Seconds from the new Shoppes at Blackstone Valley! Without too much work this property will quickly be ready to rent out with very nice apartments!
-
2007-06-07$189,900 347-char remark
Show marketing remark (347 chars)
*INVESTORS* take notice! Three family in a great area. Primarily owner occupied singe family homes residential neighborhood. Close to all major highways including Rts 290, 146, 20, and the mass pike! Seconds from the new Shoppes at Blackstone Valley! Without too much work this property will quickly be ready to rent out with very nice apartments!
-
2006-08-02soldstatus $312,419
-
2004-04-30soldstatus $275,000
-
2004-04-30soldstatus $275,000
-
2000-09-05soldstatus $125,900
-
2000-09-05soldstatus $125,900
-
2000-06-26historical
-
2000-03-10$129,900
-
1987-06-24soldstatus $145,000
ⓘ Source: listings_history table (triggers on properties + properties_extension) + one-shot
backfill from property_details.listing_events for pre-trigger history.
Tax reassessment forecast MA · Partial reset (capped growth)
- Current annual tax
- $5,617 · $468/mo
- Projected year-2 tax
- $6,621 · $552/mo
- Expected delta
- +$1,004/yr (+$84/mo · 17.9%)
ⓘ Screening estimate from a state-policy table — verify with the county assessor before closing.
Climate risk First Street
- Flood 1/10 Low FEMA zone X (unshaded) · 0% chance over 30 yrs
- Wildfire 1/10 Low
- Heat 4/10 Moderate 6 d/yr ≥94°F today · 14 d/yr by 30 yrs out
- Wind 6/10 Major 27% chance of damaging wind over 30 yrs
- Air quality 2/10 Low 1 unhealthy d/yr today · 2 by 30 yrs out
Nearby sold comps map
Loading sold comps map…
Walkable amenities ~0.75 mi
Loading nearby amenities…
Taxation est. · year 1
- Rental income
- $69,864
- − Mortgage interest
- −$34,724
- − Property taxes
- −$5,617
- − Insurance
- −$3,100
- − Repairs & maintenance
- −$5,589
- − Management
- −$5,589
- − Depreciation
- −$18,033
- Taxable loss
- −$2,788
- Est. tax savings @ 24.0%
- +$669
- After-tax cash flow
- $8,135/yr
For passive investors: Depreciation is non-cash, so a rental often shows a tax loss while cash-flowing — sheltering income. Rental losses are passive: they offset passive income freely, and up to $25,000/yr can offset ordinary (W-2) income if you actively participate and your MAGI is under $100k (phasing out to $0 by $150k); unused losses carry forward. On sale, claimed depreciation is recaptured at up to 25%, and gains may owe capital-gains tax (a 1031 exchange can defer both). Figures are a year-1 estimate at your 24.0% rate — not tax advice; consult a CPA.
Schools (NCES district)
- District
- Worcester
- NCES district ID
- 2513230
- Math proficiency
- 17% ▼ -15.00%
- Reading proficiency
- 30% ▼ -8.00%
- Median HH income
- $45,063
- Composite
- 20.3/100
- National rank
- #8615
- State rank
- #280 of 302 in MA
Livability — Worcester
- Score
- 87/100
- State rank
- #9
- US rank
- #312
Category grades
Schools grade is shown separately in the Schools card above.
Census & demographics
- Census place
- Worcester, MA
- County
- Worcester County · 487,911 people
- City population
- 207,324
- Metro
- Worcester, MA-CT
- Population (ZIP)
- 8,706
- Household income
- $78,727
- Rent vs Own
- Severe rent burden
- 379.0
Population outlook (Worcester County) Hauer SSP2
- Today (2025)
- 850,858 people
- By 2030
- 860,403 · +1.1%
- By 2040
- 869,902 · +2.2%
- By 2050
- 869,110 · +2.1%
- By 2075
- 870,120 · +2.3%
- By 2100
- 829,703 · -2.5%
Race, ethnicity, and origin ACS 2023
- Neighborhood character
- Diverse neighborhood (Simpson 0.69)
- Race & ethnicity
- White 47% Hispanic / Latino 22% Two or more races 20% Black 19% Asian 3%
- Hispanic origin (detail)
- Puerto Rican 16% Dominican 2%
- Common ancestry
- Lithuanian 9% Romanian 3% Slovak 2%
- Foreign-born
- 24% · Canada, Vietnam, Jamaica
- Languages at home
- 62% English-only · Spanish 16% Other Indo-European 5% Russian/Polish/Slavic 3%
Political lean MEDSL · Worcester
- 2024 margin
- D (+10.0) · D 53.9% · R 43.9% · Other 2.2%
- 2008→2024 swing
- -3.8pp toward R · 2008: 13.8pp · 2024: 10.0pp
- All cycles
- 2024: D+10.0 2020: D+17.8 2016: D+10.5 2012: D+9.2 2008: D+13.8
Not yet ingested
- Civics
- —
Market trends
- HPI YoY
- ▼ -20.31%
- Current HPI
- 365.7055
- Rent YoY
- —
- Metro
- Worcester, MA-CT
- State GDP YoY
- ▲ 2.28%
- F500 in state
- 38
Industry mix (Fortune 500 HQ in MA)
| Industry | F500 HQs | Revenue |
|---|---|---|
| Technology | 3 | $17B |
|
||
| Insurance | 2 | $84B |
|
||
| Retail | 2 | $76B |
|
||
| Life Sciences | 1 | $43B |
|
||
| Energy Technology | 1 | $31B |
|
||
| Aerospace / Defense | 1 | $18B |
|
||
Price history
+327.5% since first listed13 events — show timeline
- 2026-05-14 Listed $619,900 MLS PIN
- 2007-07-12 Sold (Public Records) $175,000 Public Records
- 2007-07-12 Sold (MLS) $175,000 MLS PIN
- 2007-06-28 Listing Removed — MLS PIN
- 2007-06-07 Listed $189,900 MLS PIN
- 2006-08-02 Sold (Public Records) $312,419 Public Records
- 2004-04-30 Sold (Public Records) $275,000 Public Records
- 2004-04-30 Sold (Public Records) $275,000 Public Records
- 2000-09-05 Sold (Public Records) $125,900 Public Records
- 2000-09-05 Sold (MLS) $125,900 MLS PIN
- 2000-06-26 Listing Removed — MLS PIN
- 2000-03-10 Listed $129,900 MLS PIN
- 1987-06-24 Sold (Public Records) $145,000 Public Records
Property tax history
+4.6%/yrLatest (2023): $5,617 · -6.1% YoY. Source: county tax records.
Cash-flow waterfall
monthlySold comps — $/sqft
last 12 mo · ≤1 miLoading sold comps…