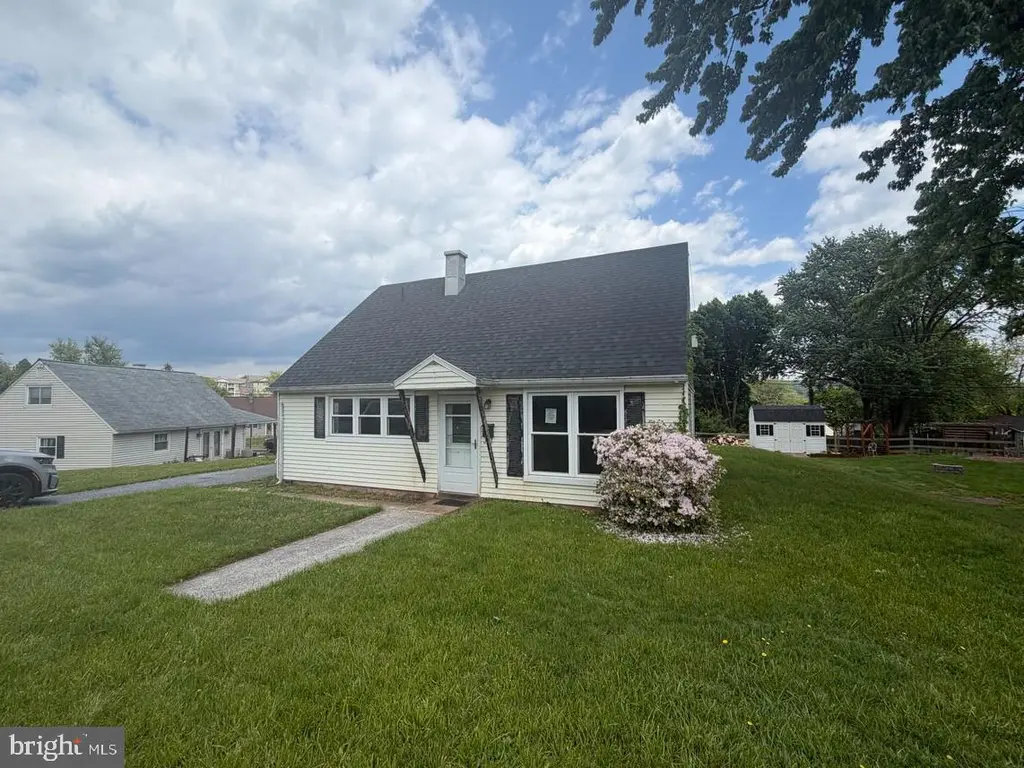
1058 N Pine St · Middletown, PA
Flood risk 1/10 · Minimal
- FEMA flood zone
- X (unshaded)
- Chance of flooding over 30 yrs
- 0.0%
- Est. flood insurance / yr
- $507 – $1,088
Fire risk 1/10 · Minimal
- Est. fire insurance / yr
- $511 – $949
Heat risk 5/10 · Moderate
- Hot days now (above 101°F)
- 7 days/yr
- Hot days in 30 yrs
- 15 days/yr
Wind risk 3/10 · Minor
- Chance of severe wind over 30 yrs
- 7.0%
Air-quality risk 3/10 · Minor
- Unhealthy air days now
- 2 days/yr
- Unhealthy air days in 30 yrs
- 4 days/yr
Risk factors via First Street. Map © Google.
Why this score? — see what drove the C+ grade
The composite is a weighted blend of 9 inputs, each scored 0–100. Each bar is that input's sub-score; the figure is the points it added to the 100-point composite (weight × sub-score).
- Cash flow +25.8/30.0
- DSCR +8.6/10.0
- ARV discount +7.5/15.0
- 1% rule +7.3/10.0
- Livability +4.0/5.0
- Schools +3.3/10.0
- Rent growth +2.9/5.0
- Condition / age +2.5/5.0
- Appreciation +0.0/10.0
$169,900
🖨 Deal sheet 📄 Offer letter ✓ Due diligence
Listing remarks
Great Opportunity to Build Sweat Equity Quickly! Super Value Detached Home In Middletown Area School District. Conveniently located close to all amenities such as Shopping Centers, Employment, International Airport, PA-283, I-83, and PA Turnpike. Easy commute to Baltimore, D. C, or Harrisburg. Over 1200 SqFt of finished living area. Open floor plan with great flow and 1.5-Story Living. Large Living Room/Dining Room combination, and Kitchen with plenty of cabinets. 4 Bedrooms. Full Bath, and Off-Street Parking in your Paved driveway. Great Back Yard that offers plenty of space for all of your backyard activities! Buyer pays all transfer costs. Sold As-Is. CASH OFFERS REQUIRE PROOF OF FUNDS.
Key facts
- 0.39 acre lot
- 2 parking spots
- Built 1954
Property features AI
Finance
- Other: Living area reported by assessor (822 finished above-grade)
- Financial info: Ownership via ground rent
- HOA & community: Ground rent paid annually
Exterior
- Parking: Two total parking spaces; Two driveway spaces; Paved driveway; On-street parking available
- Utilities: Public water; Public sewer; Natural gas hot water and heating
- Home design: Detached property; Not in a federal flood zone; Suburban location
- Construction: Vinyl siding; Asphalt roof; Slab foundation; Double-pane, vinyl-clad windows; Building winterized; Built year recorded by assessor
- Exterior features: Exterior lighting; Sidewalks; Front yard, rear yard and side yards
Interior
- Kitchen: Galley-style kitchen
- Bedrooms: Two main-level bedrooms; Two upper-level bedrooms
- Flooring: Carpet; Vinyl
- Bathrooms: One full bathroom (main level)
- Heating & cooling: Forced air heating
- Interior features: Stall shower and walk-in shower; Ceiling fans; Combination dining and living area; Traditional floor plan; Galley kitchen; Paneled walls
- Laundry & utility: Laundry on the main floor
Neighborhood map
What this means for you Summary
Snapshot
- This is a 4-bed/1.0-bath single-family listed at $170k.
Deal economics
- At list price, monthly cash flow is $410 ($5k/yr) — positive.
- The deal already cash-flows at list — no discount required.
- Meets the 1% rule at list price ($2k rent vs $170k).
- Recommended offer: $165k (3.0% below list) — sets the bar for market timing.
- Cap rate 9.2% vs local median 3.1% in Middletown — top-decile yield for the area; either an underpriced asset or a hidden risk that comps aren't pricing in. Stress-test before assuming the spread holds.
Location & tenants
- Location reads 80/100 on livability (#214 in PA, #1,886 nationally) — a professional / high-income tenant draw. Strengths: cost of living A+, housing A+, health & safety A+; Watch: amenities F.
- Middletown Area SD (suburban): math 31% / reading 45% proficiency, ranked #368 of 539 in PA (top 68%) — families likely to look elsewhere, expect single-tenant / working-renter base with shorter leases.
- Zoned schools: Middletown Area Ms (math 16% / reading 42%, grade F, #391 of 512 statewide, top 77%, 554 students, 63% FRL); Middletown Area Hs (math 72% / reading 10%, grade F, #251 of 437 statewide, top 58%, 747 students, 51% FRL) — zoned schools average 57% FRL vs 40% district-wide (17 pts higher); higher-poverty schools than district average — tighter screening recommended.
- Market conditions: Rents rising (+1.6%/yr); 146 active listings in the ZIP; 6 comparable units currently listed for rent nearby; rentals at typical pace (median 24d on market — plan ~3-4 weeks tenant-placement turnaround); 540 units permitted in Dauphin County in 2024 (194 in 5+ unit buildings).
- This rent runs 34% of the median local income ($73k/yr) — at the standard rent-burdened threshold; future hikes will face affordability resistance.
Forward outlook
- Local home prices are declining (-3.0%/yr); year-one equity from $1k of loan paydown is wiped out by about $5k of value loss. Plan a longer hold.
Negotiation context
- It's been on market 40 days — a 3% lower offer ($165k) is reasonable based on typical stale-listing flexibility.
Risks & watch-outs
- Watch-outs: built in 1954 — expect roof / HVAC / electrical / plumbing capex.
- Climate carrying-cost: extreme-heat days projected 7→15/yr by 2055 (HVAC capex compounding) — expect insurance premiums to compound above CPI over the hold.
Questions for the listing agent
- It's been on market 40 days. Have you received any prior offers? Is the seller open to a 3% concession, seller financing, or rate buy-down credit?
- Built in 1954 — when were the roof, HVAC, electrical panel, plumbing, and water heater last replaced?
- Is there a deadline driving the sale (1031 exchange, divorce, estate, relocation)? That informs how much negotiation room exists.
- What's the average days-on-market for RENTAL listings here right now (not sales)? A rising rental-DOM trend means longer vacancies and softer asking-rent achievability than the comps imply.
- What's the recent tenant-quality profile in this submarket — average credit score on applications, eviction rate, late-payment / NSF rate, and stable-employment percentage? A property-management company in the area should have these aggregated.
- How much new for-sale + rental construction is in the pipeline within 1–3 miles? Heavy new supply typically softens prices + rents 12–24 months out; constrained supply supports both.
Investment metrics
- 1% rule
- 1.23% ✓
- Cap rate
- 9.19%
- Cash-on-cash
- 10.34%
- DSCR
- 1.46
- GRM
- 6.8
CMA / ARV
- ARV (median comp)
- $78,561
- List price
- $169,900
- Delta
- 116.27%
- Verdict
- OVERPRICED
- Comps
- 14 within 1.0 mi
Show comp detail 12 sales within ~0.75 mi
| Address | Dist | Beds/Ba | Sqft | Sold | Price | $/sf | Match |
|---|---|---|---|---|---|---|---|
| 37 Wharton Ave | 0.32mi | 4/2.0 | 1,764 (+7%) | 1mo | $300,000 | $170 | 69 |
| 803 N Spring St N | 0.38mi | 3/1.0 (-1) | 1,718 (+4%) | 12mo | $250,000 | $146 | 61 |
| 910 Deatrich Ave | 0.58mi | 3/1.5 (-1) | 1,700 (+3%) | 3mo | $250,000 | $147 | 59 |
| 345 E High St | 0.55mi | 4/1.0 | 1,820 (+10%) | 1mo | $259,100 | $142 | 57 |
| 902 Deatrich Ave | 0.59mi | 3/1.0 (-1) | 1,695 (+2%) | 8mo | $281,500 | $166 | 57 |
| 168 Magnolia Dr | 0.39mi | 3/2.0 (-1) | 1,806 (+9%) | 1mo | $436,825 | $242 | 57 |
| 20 W Water St | 0.73mi | 4/1.0 | 1,692 (+2%) | 7mo | $110,000 | $65 | 56 |
| 258 E Water St | 0.71mi | 3/1.0 (-1) | 1,580 (-4%) | 3mo | $209,900 | $133 | 52 |
| 346 E Roosevelt Ave | 0.44mi | 4/1.0 | 1,416 (-14%) | 4mo | $205,000 | $145 | 52 |
| 126 Beechwood Dr | 0.33mi | 3/2.0 (-1) | 1,800 (+9%) | 12mo | $248,000 | $138 | 51 |
| 800 Deatrich Ave | 0.60mi | 4/2.0 | 1,762 (+6%) | 11mo | $230,000 | $131 | 48 |
| 921 Vine St | 0.47mi | 4/1.0 | 1,416 (-14%) | 9mo | $250,000 | $177 | 47 |
Match score weights: distance 35% · size 25% · config 20% · recency 20%. Top-matched comps best support the ARV.
Projected returns pro-forma
-3.0% appreciation · 1.58% rent growth · sell at horizon
- IRR
- -2.4%
- Equity multiple
- 0.91×
- Total profit
- $-4,299
- Equity at exit
- $25,333
- IRR
- 5.6%
- Equity multiple
- 1.39×
- Total profit
- $18,417
- Equity at exit
- $14,690
Cash invested: $47,572 (down + closing). Projections, not guarantees.
Landlord ↔ Tenant lean methodology
- Overall (STATE)
- 62 Landlord-Friendly
- State Pennsylvania
- 62 Landlord-Friendly · EVEN
- County
- — inherits STATE
- City
- — inherits STATE
ZIP-level market 17057
- Home prices YoY
- -23.9%
- Rents YoY
- 1.6%
- Active inventory
- 146
- Price-to-rent
- 6.8×
Monthly cashflow live
- Estimated rent
- $2,093 high interval (Pro) →
- Mortgage (P&I)
- −$891
- Tax from tax record
- −$282 /mo · $3,379/yr
- Insurance
- −$71
- HOA
- −$0
- Vacancy / Maint / Mgmt
- −$439
- Net cashflow
- $410
Break-even live
UW: 25.0% down · 7.5% · 30yr · 1.5% tax · 5.0% vac · 8.0% maint · 8.0% mgmt
Financing live
Cash to close
- Down payment
- $42,475
- Closing costs
- $5,097
- Reserves months
- —
- Total cash needed
- —
Loan-product check · same deal, 3 products live
Conventional
25% down · 7.5% · 30yr
- Down + closing
- —
- Monthly P&I
- —
- Monthly cashflow
- —
- DSCR
- —
- Eligible?
- —
Personal DTI + credit; lowest rate.
DSCR
20% down · 8.5% · 30yr
- Down + closing
- —
- Monthly P&I
- —
- Monthly cashflow
- —
- DSCR
- —
- Eligible?
- —
No personal income docs; deal must DSCR.
Hard money
10% down · 12.0% · 12mo
- Down + closing
- —
- Monthly P&I
- —
- Monthly cashflow
- —
- DSCR
- —
- Eligible?
- —
Short-term bridge; refi at stabilization.
Rent comps 6 comps
| Address | Beds | Baths | Sqft | Rent | $/sqft | DOM | Units | Dist |
|---|---|---|---|---|---|---|---|---|
| 221 N Spring St Unit A Middletown, PA | 5.0 | 2.5 | 1725 | $1,995 | $1.16 | 44d | 1 | 0.81mi |
| 5001 Walden WAY Middletown, PA | 3.0 | 2.5 | 1638 | $2,800 | $1.71 | 14d | 9 | 0.92mi |
| 144 Wilson St Middletown, PA | 3.0 | 1.0 | 1120 | $1,495 | $1.33 | 23d | 1 | 1.05mi |
| 1900 Pineford Dr Middletown, PA | 1.0–3.0 | 1.0–2.5 | 1020 | $1,690 | $1.66 | 14d | 1 | 1.06mi |
| 258 Ann St Middletown, PA | 5.0 | 1.5 | 2120 | $2,195 | $1.04 | 44d | 1 | 1.07mi |
| 125 Market St Middletown, PA | 3.0 | 1.5 | 1825 | $2,200 | $1.21 | 14d | 1 | 1.16mi |
Listing history 17 events
-
2026-06-18status $169,900 Pending 40 DOM
-
2026-06-18days on market $169,900 Active 40 DOM
-
2026-06-17days on market $169,900 Active 39 DOM
-
2026-06-16days on market $169,900 Active 38 DOM
-
2026-06-15days on market $169,900 Active 37 DOM
-
2026-06-14days on market $169,900 Active 35 DOM
-
2026-06-10days on market $169,900 Active 32 DOM
-
2026-06-09days on market $169,900 Active 31 DOM
-
2026-06-08days on market $169,900 Active 30 DOM
-
2026-06-07days on market $169,900 Active 29 DOM
-
2026-06-05days on market $169,900 Active 26 DOM
-
2026-06-03days on market $169,900 Active 25 DOM
-
2026-06-02days on market $169,900 Active 24 DOM
-
2026-06-01days on market $169,900 Active 23 DOM
-
2026-05-31days on market $169,900 Active 22 DOM
-
2026-05-31days on market $169,900 Active 21 DOM
-
2026-05-09$169,900 Active 1782-char remark
ⓘ Source: listings_history table (triggers on properties + properties_extension) + one-shot
backfill from property_details.listing_events for pre-trigger history.
Tax reassessment forecast PA · Partial reset (capped growth)
- Current annual tax
- $3,379 · $282/mo
- Projected year-2 tax
- $3,379 · $282/mo
- Expected delta
- $0/yr ($0/mo · 0.0%)
ⓘ Screening estimate from a state-policy table — verify with the county assessor before closing.
Climate risk First Street
- Flood 1/10 Low FEMA zone X (unshaded) · 0% chance over 30 yrs
- Wildfire 1/10 Low
- Heat 5/10 Major 7 d/yr ≥101°F today · 15 d/yr by 30 yrs out
- Wind 3/10 Moderate 7% chance of damaging wind over 30 yrs
- Air quality 3/10 Moderate 2 unhealthy d/yr today · 4 by 30 yrs out
Nearby sold comps map
Loading sold comps map…
Walkable amenities ~0.75 mi
Loading nearby amenities…
Taxation est. · year 1
- Rental income
- $25,113
- − Mortgage interest
- −$9,517
- − Property taxes
- −$3,379
- − Insurance
- −$850
- − Repairs & maintenance
- −$2,009
- − Management
- −$2,009
- − Depreciation
- −$4,943
- Taxable income
- $2,407
- Est. tax owed @ 24.0%
- −$578
- After-tax cash flow
- $4,341/yr
For passive investors: Depreciation is non-cash, so a rental often shows a tax loss while cash-flowing — sheltering income. Rental losses are passive: they offset passive income freely, and up to $25,000/yr can offset ordinary (W-2) income if you actively participate and your MAGI is under $100k (phasing out to $0 by $150k); unused losses carry forward. On sale, claimed depreciation is recaptured at up to 25%, and gains may owe capital-gains tax (a 1031 exchange can defer both). Figures are a year-1 estimate at your 24.0% rate — not tax advice; consult a CPA.
Schools (NCES district)
- District
- Middletown Area SD
- NCES district ID
- 4215240
- Math proficiency
- 31% ▼ -9.00%
- Reading proficiency
- 45% ▼ -11.00%
- Median HH income
- $53,128
- Composite
- 33.08/100
- National rank
- #5567
- State rank
- #368 of 539 in PA
Livability — Middletown
- Score
- 80/100
- State rank
- #214
- US rank
- #1886
Category grades
Schools grade is shown separately in the Schools card above.
Census & demographics
- Census place
- Middletown, PA
- County
- Dauphin County · 247,857 people
- City population
- 23,560
- Metro
- Harrisburg-Carlisle, PA
- Population (ZIP)
- 23,560
- Household income
- $73,407
- Rent vs Own
- Severe rent burden
- 748.0
Population outlook (Dauphin County) Hauer SSP2
- Today (2025)
- 281,628 people
- By 2030
- 283,549 · +0.7%
- By 2040
- 285,385 · +1.3%
- By 2050
- 286,188 · +1.6%
- By 2075
- 291,053 · +3.3%
- By 2100
- 282,374 · +0.3%
Race, ethnicity, and origin ACS 2023
- Neighborhood character
- Predominantly White (76%)
- Race & ethnicity
- White 76% Hispanic / Latino 11% Two or more races 8% Black 6% Asian 2%
- Hispanic origin (detail)
- Mexican 1% Puerto Rican 7%
- Common ancestry
- Romanian 3% Italian 2% Serbian 2%
- Foreign-born
- 5% · Canada, China, South Korea
- Languages at home
- 92% English-only · Spanish 4% Other Indo-European 1%
Political lean MEDSL · Dauphin
- 2024 margin
- Lean D (+5.9) · D 52.4% · R 46.5% · Other 1.1%
- 2008→2024 swing
- -3.1pp toward R · 2008: 9.1pp · 2024: 5.9pp
- All cycles
- 2024: D+5.9 2020: D+8.5 2016: D+2.8 2012: D+6.0 2008: D+9.1
Not yet ingested
- Civics
- —
Market trends
- HPI YoY
- ▼ -83.17%
- Current HPI
- 265.6077
- Rent YoY
- ▲ 1.58%
- Metro
- Harrisburg-Carlisle, PA
- State GDP YoY
- ▲ 1.68%
- F500 in state
- 34
Industry mix (Fortune 500 HQ in PA)
| Industry | F500 HQs | Revenue |
|---|---|---|
| Healthcare | 2 | $309B |
|
||
| Insurance | 2 | $27B |
|
||
| Telecommunications / Media | 1 | $124B |
|
||
| Industrial Distribution | 1 | $22B |
|
||
| Financial Services | 1 | $20B |
|
||
| Chemicals / Materials | 1 | $18B |
|
||
Price history
1 event — show timeline
- 2026-05-09 Listed $169,900 BRIGHT MLS
Property tax history
+2.6%/yrLatest (2026): $3,379 · +4.0% YoY. Source: county tax records.
Cash-flow waterfall
monthlySold comps — $/sqft
last 12 mo · ≤1 miLoading sold comps…