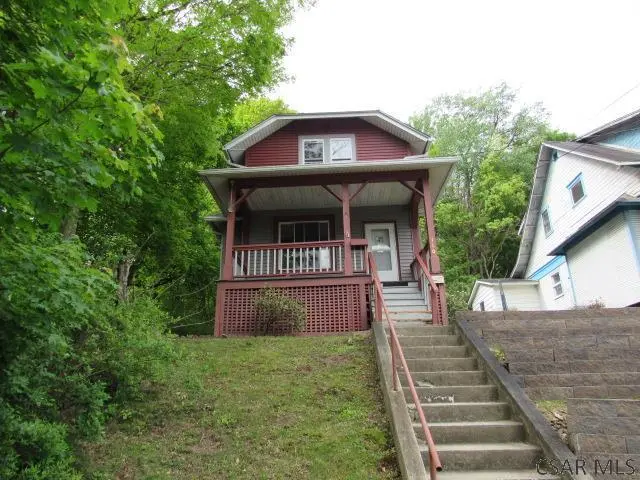
160 Tillman Ave · Ferndale, PA
Flood risk 1/10 · Minimal
- FEMA flood zone
- X (unshaded)
- Chance of flooding over 30 yrs
- 0.0%
- Est. flood insurance / yr
- $473 – $860
Fire risk 1/10 · Minimal
- Est. fire insurance / yr
- $511 – $949
Heat risk 3/10 · Minor
- Hot days now (above 93°F)
- 7 days/yr
- Hot days in 30 yrs
- 17 days/yr
Wind risk 2/10 · Minimal
- Chance of severe wind over 30 yrs
- —
Air-quality risk 2/10 · Minimal
- Unhealthy air days now
- 1 days/yr
- Unhealthy air days in 30 yrs
- 2 days/yr
Risk factors via First Street. Map © Google.
Why this score? — see what drove the B+ grade
The composite is a weighted blend of 9 inputs, each scored 0–100. Each bar is that input's sub-score; the figure is the points it added to the 100-point composite (weight × sub-score).
- Cash flow +30.0/30.0
- ARV discount +14.2/15.0
- 1% rule +10.0/10.0
- DSCR +10.0/10.0
- Schools +3.6/10.0
- Livability +3.6/5.0
- Rent growth +2.5/5.0
- Condition / age +2.5/5.0
- Appreciation +0.0/10.0
$44,000
🖨 Deal sheet 📄 Offer letter ✓ Due diligence
Listing remarks MLS
Cute 2 bed/1.5 bathroom located in Ferndale School District. Extras include a full basement, front and rear covered porch, and a small level backyard.
Key facts
- Covered porch
- Level backyard
- Full basement
Tags
Property features AI
Exterior
- Parking: On-street parking
- Utilities: Public water; Public sewer
- Home design: 2-story frame home; Asphalt roof; Resale property
- Construction: Frame construction; Asphalt roof
- Exterior features: 40 x 120 lot; Public transportation nearby
Interior
- Kitchen: Kitchen on main level
- Bedrooms: Upper-level bedrooms (2 total rooms identified as bedrooms)
- Flooring: Carpet; Ceramic tile; Hardwood
- Bathrooms: 1 full bathroom; 1 half bathroom
- Heating & cooling: Forced air heating; Gas heating
- Interior features: Carpet, ceramic tile, and hardwood flooring; Full, unfinished basement
Neighborhood map
What this means for you Summary
Snapshot
- This is a 2-bed/1.5-bath single-family listed at $44k.
Deal economics
- At list price, monthly cash flow is $324 ($4k/yr) — positive.
- The deal already cash-flows at list — no discount required.
- Meets the 1% rule at list price ($854 rent vs $44k).
Location & tenants
- Location reads 72/100 on livability (#649 in PA) — a middle-class / working-renter tenant base. Strengths: crime A+, cost of living A+, housing A+; Watch: employment C-, amenities F, commute F.
- Ferndale Area SD (suburban): math 31% / reading 56% proficiency, ranked #316 of 539 in PA (top 59%) — families likely to look elsewhere, expect single-tenant / working-renter base with shorter leases.
- Market conditions: 92 active listings in the ZIP; 10 comparable units currently listed for rent nearby; rentals lingering (median 44d on market — plan ~5-8 weeks vacancy on turnover, expect pricing pressure); 90% of comp listings sitting > 30 days — soft ceiling on asking rent; 64 units permitted in Cambria County in 2024 (0 in 5+ unit buildings).
- This rent is only 15% of the median local income ($69k/yr) — well below the 30% rent-burden line; pricing power to push rent on renewal without tenant pushback.
Forward outlook
- Local home prices are declining (-3.0%/yr); year-one equity from $304 of loan paydown is wiped out by about $1k of value loss. Plan a longer hold.
- Cambria County population projected at -28% by 2050 — secular population decline; favor cash flow + early exit over multi-decade hold.
- At projected returns (-3.0% appreciation + 3.0% rent growth), your $12k cash investment doubles in ~4 years — after that, you're playing with house money.
Negotiation context
- Only 14 days on market — expect competitive offers; lowballing is unlikely to land.
- 2 sale attempts with the ask held roughly flat each time — persistent listings suggest the price (not the market) is what's stuck; bring a comps-based counter.
Risks & watch-outs
- Watch-outs: property tax is 2.8% of price; built in 1900 — expect roof / HVAC / electrical / plumbing capex.
Questions for the listing agent
- Built in 1900 — when were the roof, HVAC, electrical panel, plumbing, and water heater last replaced?
- Property tax is high relative to price — has the assessment been appealed recently, and will the sale trigger a re-assessment?
- Is there a deadline driving the sale (1031 exchange, divorce, estate, relocation)? That informs how much negotiation room exists.
- What's the average days-on-market for RENTAL listings here right now (not sales)? A rising rental-DOM trend means longer vacancies and softer asking-rent achievability than the comps imply.
- What's the recent tenant-quality profile in this submarket — average credit score on applications, eviction rate, late-payment / NSF rate, and stable-employment percentage? A property-management company in the area should have these aggregated.
- How much new for-sale + rental construction is in the pipeline within 1–3 miles? Heavy new supply typically softens prices + rents 12–24 months out; constrained supply supports both.
Investment metrics
- 1% rule
- 1.94% ✓
- Cap rate
- 15.13%
- Cash-on-cash
- 31.58%
- DSCR
- 2.41
- GRM
- 4.3
CMA / ARV
- ARV (on-the-fly)
- $51,650
- Comps found
- 12
Show comp detail 12 sales within ~0.75 mi
| Address | Dist | Beds/Ba | Sqft | Sold | Price | $/sf | Match |
|---|---|---|---|---|---|---|---|
| 304 Midway Dr | 0.35mi | 3/2.0 (+1) | 1,026 (-1%) | 6mo | $29,900 | $29 | 70 |
| 817 Park Ave R Ave | 0.36mi | 2/1.0 | 960 (-7%) | 2mo | $20,000 | $21 | 68 |
| 394 Plainfield Ave | 0.25mi | 2/1.0 | 1,150 (+11%) | 2mo | $27,900 | $24 | 66 |
| 108 Woodruff St | 0.47mi | 2/1.0 | 1,120 (+8%) | 8mo | $25,000 | $22 | 56 |
| 1121 Boyd Ave | 0.52mi | 2/1.0 | 934 (-10%) | 4mo | $47,000 | $50 | 54 |
| 245 Sell St | 0.65mi | 2/1.0 | 960 (-7%) | 3mo | $57,000 | $59 | 54 |
| 717 Glenwood Ave | 0.62mi | 3/1.0 (+1) | 1,064 (+3%) | 8mo | $35,000 | $33 | 53 |
| 634 Russell Ave | 0.75mi | 2/1.0 | 956 (-8%) | 3mo | $51,000 | $53 | 48 |
| 267 Derby St | 0.67mi | 3/1.5 (+1) | 1,104 (+7%) | 8mo | $97,000 | $88 | 46 |
| 225 Sell St | 0.60mi | 2/1.5 | 1,159 (+12%) | 8mo | $39,500 | $34 | 45 |
| 545 Summit Ave | 0.48mi | 3/1.0 (+1) | 1,187 (+15%) | 3mo | $89,000 | $75 | 43 |
| 609 Highland Ave | 0.65mi | 2/1.0 | 900 (-13%) | 6mo | $45,000 | $50 | 41 |
Match score weights: distance 35% · size 25% · config 20% · recency 20%. Top-matched comps best support the ARV.
Projected returns pro-forma
-3.0% appreciation · 3.0% rent growth · sell at horizon
- IRR
- 26.5%
- Equity multiple
- 2.10×
- Total profit
- $13,560
- Equity at exit
- $6,561
- IRR
- 34.2%
- Equity multiple
- 4.13×
- Total profit
- $38,563
- Equity at exit
- $3,804
Cash invested: $12,320 (down + closing). Projections, not guarantees.
Landlord ↔ Tenant lean methodology
- Overall (STATE)
- 62 Landlord-Friendly
- State Pennsylvania
- 62 Landlord-Friendly · EVEN
- County
- — inherits STATE
- City
- — inherits STATE
ZIP-level market 15905
- Home prices YoY
- -31.1%
- Active inventory
- 92
- Price-to-rent
- 4.3×
Monthly cashflow live
- Estimated rent
- $854 high interval (Pro) →
- Mortgage (P&I)
- −$231
- Tax from tax record
- −$101 /mo · $1,212/yr
- Insurance
- −$18
- HOA
- −$0
- Vacancy / Maint / Mgmt
- −$179
- Net cashflow
- $324
Break-even live
UW: 25.0% down · 7.5% · 30yr · 1.5% tax · 5.0% vac · 8.0% maint · 8.0% mgmt
Financing live
Cash to close
- Down payment
- $11,000
- Closing costs
- $1,320
- Reserves months
- —
- Total cash needed
- —
Loan-product check · same deal, 3 products live
Conventional
25% down · 7.5% · 30yr
- Down + closing
- —
- Monthly P&I
- —
- Monthly cashflow
- —
- DSCR
- —
- Eligible?
- —
Personal DTI + credit; lowest rate.
DSCR
20% down · 8.5% · 30yr
- Down + closing
- —
- Monthly P&I
- —
- Monthly cashflow
- —
- DSCR
- —
- Eligible?
- —
No personal income docs; deal must DSCR.
Hard money
10% down · 12.0% · 12mo
- Down + closing
- —
- Monthly P&I
- —
- Monthly cashflow
- —
- DSCR
- —
- Eligible?
- —
Short-term bridge; refi at stabilization.
Rent comps 10 comps
| Address | Beds | Baths | Sqft | Rent | $/sqft | DOM | Units | Dist |
|---|---|---|---|---|---|---|---|---|
| 129-131 Plainfield Ave Johnstown, PA | 3.0 | 1.0 | 1300 | $850 | $0.65 | 44d | 1 | 0.11mi |
| 522 Vickroy Ave Johnstown, PA | 3.0 | 1.0 | 1125 | $850 | $0.76 | 44d | 1 | 0.40mi |
| 520 Vickroy Ave Johnstown, PA | 1.0 | 1.0 | 1125 | $500 | $0.44 | 44d | 1 | 0.41mi |
| 550 Ferndale Ave Johnstown, PA | 3.0 | 1.0 | 1300 | $1,100 | $0.85 | 44d | 1 | 0.43mi |
| 553 Vickroy Ave #555 Johnstown, PA | 3.0 | 1.0 | 1300 | $985 | $0.76 | 44d | 1 | 0.45mi |
| 619 Grove Ave Johnstown, PA | 2.0 | 2.0 | 1100 | $1,050 | $0.95 | 44d | 1 | 0.57mi |
| 343 Linden Ave Unit 2 Johnstown, PA | 1.0 | 1.0 | 850 | $675 | $0.79 | 44d | 1 | 0.90mi |
| 1201 Heeney Ave Johnstown, PA | 1.0–3.0 | 1.0 | 750 | $950 | $1.27 | 4d | 1 | 1.01mi |
| 906 Lemon St Johnstown, PA | 3.0 | 1.0 | 1128 | $750 | $0.66 | 44d | 1 | 1.42mi |
| 412 Oak St Unit 1 Johnstown, PA | 2.0 | 1.0 | 1100 | $900 | $0.82 | 44d | 1 | 1.50mi |
Listing history 11 events
-
2026-06-19days on market $44,000 Active 14 DOM
-
2026-06-18days on market $44,000 Active 13 DOM
-
2026-06-17days on market $44,000 Active 12 DOM
-
2026-06-16days on market $44,000 Active 11 DOM
-
2026-06-15days on market $44,000 Active 10 DOM
-
2026-06-14days on market $44,000 Active 8 DOM
-
2026-06-12days on market $44,000 Active 7 DOM
-
2026-06-09days on market $44,000 Active 4 DOM
-
2026-06-08days on market $44,000 Active 3 DOM
-
2026-06-07remarks 150-char remark
-
2026-06-07$44,000 Active 2 DOM
ⓘ Source: listings_history table (triggers on properties + properties_extension) + one-shot
backfill from property_details.listing_events for pre-trigger history.
Tax reassessment forecast PA · Partial reset (capped growth)
- Current annual tax
- $1,212 · $101/mo
- Projected year-2 tax
- $1,212 · $101/mo
- Expected delta
- $0/yr ($0/mo · 0.0%)
ⓘ Screening estimate from a state-policy table — verify with the county assessor before closing.
Climate risk First Street
- Flood 1/10 Low FEMA zone X (unshaded) · 0% chance over 30 yrs
- Wildfire 1/10 Low
- Heat 3/10 Moderate 7 d/yr ≥93°F today · 17 d/yr by 30 yrs out
- Wind 2/10 Low
- Air quality 2/10 Low 1 unhealthy d/yr today · 2 by 30 yrs out
Nearby sold comps map
Loading sold comps map…
Walkable amenities ~0.75 mi
Loading nearby amenities…
Taxation est. · year 1
- Rental income
- $10,243
- − Mortgage interest
- −$2,465
- − Property taxes
- −$1,212
- − Insurance
- −$220
- − Repairs & maintenance
- −$819
- − Management
- −$819
- − Depreciation
- −$1,280
- Taxable income
- $3,427
- Est. tax owed @ 24.0%
- −$822
- After-tax cash flow
- $3,068/yr
For passive investors: Depreciation is non-cash, so a rental often shows a tax loss while cash-flowing — sheltering income. Rental losses are passive: they offset passive income freely, and up to $25,000/yr can offset ordinary (W-2) income if you actively participate and your MAGI is under $100k (phasing out to $0 by $150k); unused losses carry forward. On sale, claimed depreciation is recaptured at up to 25%, and gains may owe capital-gains tax (a 1031 exchange can defer both). Figures are a year-1 estimate at your 24.0% rate — not tax advice; consult a CPA.
Schools (NCES district)
- District
- Ferndale Area SD
- NCES district ID
- 4209750
- Math proficiency
- 31% ▼ -13.00%
- Reading proficiency
- 56% ▼ -5.00%
- Median HH income
- $37,748
- Composite
- 36.12/100
- National rank
- #4750
- State rank
- #316 of 539 in PA
Livability — Ferndale
- Score
- 72/100
- State rank
- #649
- US rank
- #6305
Category grades
Schools grade is shown separately in the Schools card above.
Census & demographics
- Census place
- Ferndale, PA
- County
- Cambria County · 30,791 people
- City population
- 30,791
- Metro
- Johnstown, PA
- Population (ZIP)
- 19,329
- Household income
- $69,212
- Rent vs Own
- Severe rent burden
- 359.0
Population outlook (Cambria County) Hauer SSP2
- Today (2025)
- 122,754 people
- By 2030
- 115,827 · -5.6%
- By 2040
- 101,309 · -17.5%
- By 2050
- 88,379 · -28.0%
- By 2075
- 65,237 · -46.9%
- By 2100
- 46,909 · -61.8%
Race, ethnicity, and origin ACS 2023
- Neighborhood character
- Predominantly White (92%)
- Race & ethnicity
- White 92% Two or more races 3% Hispanic / Latino 2% Black 2%
- Common ancestry
- Romanian 7% Scotch-Irish 1% Italian 1%
- Foreign-born
- 2% · Canada
- Languages at home
- 96% English-only · Spanish 1%
Political lean MEDSL · Cambria
- 2024 margin
- Solid R (+39.7) · D 29.8% · R 69.5%
- 2008→2024 swing
- -40.4pp toward R · 2008: 0.7pp · 2024: -39.7pp
- All cycles
- 2024: R+39.7 2020: R+37.3 2016: R+37.8 2012: R+17.8 2008: D+0.7
Not yet ingested
- Civics
- —
Market trends
- HPI YoY
- ▼ -64.18%
- Current HPI
- 142.5218
- Rent YoY
- —
- Metro
- Johnstown, PA
- State GDP YoY
- ▲ 1.68%
- F500 in state
- 34
Industry mix (Fortune 500 HQ in PA)
| Industry | F500 HQs | Revenue |
|---|---|---|
| Healthcare | 2 | $309B |
|
||
| Insurance | 2 | $27B |
|
||
| Telecommunications / Media | 1 | $124B |
|
||
| Industrial Distribution | 1 | $22B |
|
||
| Financial Services | 1 | $20B |
|
||
| Chemicals / Materials | 1 | $18B |
|
||
Price history
-2.2% since first listed4 events — show timeline
- 2026-06-05 Listed $44,000 CSMLS
- 2026-06-05 Listed $44,000 West Penn MLS
- 2021-05-21 Sold (Public Records) $45,000 Public Records
- 2021-05-20 Sold (MLS) $45,000 CSMLS
Property tax history
+2.2%/yrLatest (2026): $1,212 · +4.0% YoY. Source: county tax records.
Cash-flow waterfall
monthlySold comps — $/sqft
last 12 mo · ≤1 miLoading sold comps…