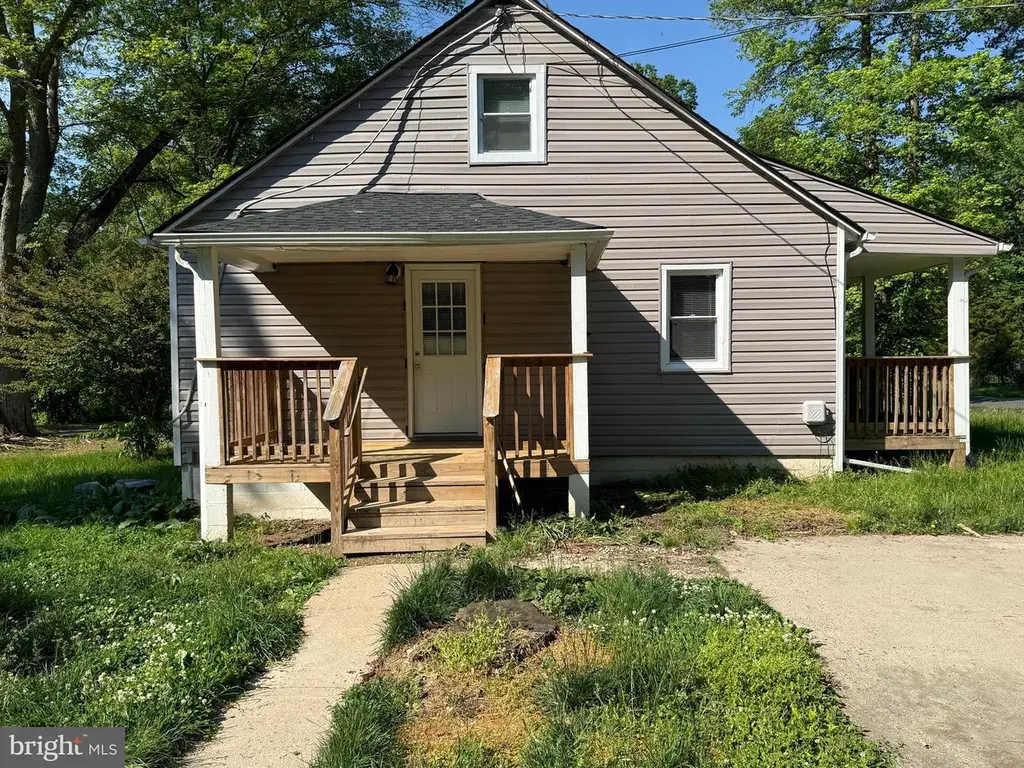
1535 Mitchell Ln · Perryman, MD
Flood risk 5/10 · Moderate
- FEMA flood zone
- X (unshaded)
- Chance of flooding over 30 yrs
- 0.26%
- Est. flood insurance / yr
- $473 – $860
Fire risk 3/10 · Minor
- Est. fire insurance / yr
- $755 – $1,403
Heat risk 7/10 · Major
- Hot days now (above 105°F)
- 7 days/yr
- Hot days in 30 yrs
- 15 days/yr
Wind risk 6/10 · Moderate
- Chance of severe wind over 30 yrs
- 27.0%
Air-quality risk 3/10 · Minor
- Unhealthy air days now
- 2 days/yr
- Unhealthy air days in 30 yrs
- 3 days/yr
Risk factors via First Street. Map © Google.
Why this score? — see what drove the C- grade
The composite is a weighted blend of 9 inputs, each scored 0–100. Each bar is that input's sub-score; the figure is the points it added to the 100-point composite (weight × sub-score).
- Cash flow +20.5/30.0
- ARV discount +9.7/15.0
- DSCR +6.5/10.0
- 1% rule +4.7/10.0
- Livability +3.2/5.0
- Schools +2.9/10.0
- Rent growth +2.6/5.0
- Condition / age +2.5/5.0
- Appreciation +0.0/10.0
$269,950
🖨 Deal sheet 📄 Offer letter ✓ Due diligence
Listing remarks
Updated 4-bedroom, 2-bath detached Cape Cod offering more space than meets the eye! Flexible floor plan includes two bedrooms and a full bath on the main level plus two additional upper-level bedrooms and second full bath upstairs. Recent updates include fresh paint, flooring, kitchen improvements, bath updates, and more, creating a move-in ready opportunity for owner occupants or investors alike. Situated on approximately 0.46 acres, the property also features a separate detached trailer structure offering additional flexible space ideal for storage, workshop, office, hobby space, guest overflow, or potential future use. Buyers to perform their own due diligence regarding zoning, permittin
Key facts
- Flexible floor plan
- Detached cape cod
- Bright living spaces
Tags
Property features AI
Finance
- Financial info: Fee simple ownership
Exterior
- Parking: Driveway
- Utilities: Public water; Public sewer; Electric service
- Home design: Detached property
- Construction: Vinyl siding; Other foundation type; Above-grade and below-grade structures; Approximately 1,790 finished above-grade square feet (assessor); Approximately 832 unfinished below-grade square feet (assessor)
- Exterior features: No tidal water
Interior
- Bedrooms: Four bedrooms on the upper level; Two bedrooms on the main level; Additional rooms listed: Bedroom 3, Bedroom 4
- Bathrooms: One full bathroom on the main level; One full bathroom total
- Heating & cooling: Heat pump heating; Central air conditioning; Electric heating and cooling; Electric hot water
- Interior features: Unfinished basement; Living area per assessor
Neighborhood map
What this means for you Summary
Snapshot
- This is a 4-bed/1.0-bath single-family listed at $270k.
Deal economics
- At list price, monthly cash flow is $355 ($4k/yr) — positive.
- The deal already cash-flows at list — no discount required.
- To meet the 1% rule (rent ≥ 1% of price), the offer needs to be $262k (3.0% below list).
- Recommended offer: $262k (3.0% below list) — sets the bar for 1% rule.
- Cap rate 7.9% vs local median 5.7% in Perryman — top-decile yield for the area; either an underpriced asset or a hidden risk that comps aren't pricing in. Stress-test before assuming the spread holds.
Location & tenants
- Location reads 63/100 on livability (#293 in MD) — a middle-class / working-renter tenant base. Strengths: housing A+, crime A-, cost of living A-; Watch: employment C-, commute D+, schools F.
- Harford County Public Schools (suburban): math 22% / reading 39% proficiency, ranked #9 of 24 in MD (top 38%) — families likely to look elsewhere, expect single-tenant / working-renter base with shorter leases.
- Market conditions: Rents flat; 186 active listings in the ZIP; 5 comparable units currently listed for rent nearby; rentals lingering (median 44d on market — plan ~5-8 weeks vacancy on turnover, expect pricing pressure); 60% of comp listings sitting > 30 days — soft ceiling on asking rent; solid renter incomes; 803 units permitted in Harford County in 2024 (26 in 5+ unit buildings).
- This rent runs 38% of the median local income ($83k/yr) — at the standard rent-burdened threshold; future hikes will face affordability resistance.
Forward outlook
- Local home prices are declining (-3.0%/yr); year-one equity from $2k of loan paydown is wiped out by about $8k of value loss. Plan a longer hold.
Negotiation context
- Only 13 days on market — expect competitive offers; lowballing is unlikely to land.
- 4 sale attempts since 10y ago with the ask held roughly flat each time — persistent listings suggest the price (not the market) is what's stuck; bring a comps-based counter.
- Current owner paid $69k; list at $270k implies a 291% gain — meaningful room to come down on a strong offer.
Risks & watch-outs
- Climate carrying-cost: moderate flood risk; major wind risk, 27% chance of damaging wind over 30y; extreme-heat days projected 7→15/yr by 2055 (HVAC capex compounding) — expect insurance premiums to compound above CPI over the hold.
Questions for the listing agent
- Built in 1963 — when were the roof, HVAC, electrical panel, plumbing, and water heater last replaced?
- Is there a deadline driving the sale (1031 exchange, divorce, estate, relocation)? That informs how much negotiation room exists.
- Schools are F-rated, which usually means shorter tenancies and higher turnover. Who's the typical renter profile here, and what's been the actual vacancy rate?
- What's the average days-on-market for RENTAL listings here right now (not sales)? A rising rental-DOM trend means longer vacancies and softer asking-rent achievability than the comps imply.
- What's the recent tenant-quality profile in this submarket — average credit score on applications, eviction rate, late-payment / NSF rate, and stable-employment percentage? A property-management company in the area should have these aggregated.
- How much new for-sale + rental construction is in the pipeline within 1–3 miles? Heavy new supply typically softens prices + rents 12–24 months out; constrained supply supports both.
Investment metrics
- 1% rule
- 0.97% ✗
- Cap rate
- 7.87%
- Cash-on-cash
- 5.63%
- DSCR
- 1.25
- GRM
- 8.6
CMA / ARV
- ARV (on-the-fly)
- $283,800
- Comps found
- 7
Show comp detail 7 sales within ~0.75 mi
| Address | Dist | Beds/Ba | Sqft | Sold | Price | $/sf | Match |
|---|---|---|---|---|---|---|---|
| 206 Teake Ln | 0.31mi | 3/1.5 (-1) | 1,352 (+2%) | 1mo | $330,000 | $244 | 74 |
| 1518 Mitchell Ln | 0.10mi | 4/1.0 | 1,374 (+4%) | 20mo | $289,000 | $210 | 72 |
| 1406 Willshire Dr | 0.37mi | 4/1.5 | 1,323 (+0%) | 14mo | $285,000 | $215 | 69 |
| 1412 Willshire Dr | 0.33mi | 3/1.5 (-1) | 1,352 (+2%) | 14mo | $265,000 | $196 | 62 |
| 15 Spesutia Rd | 0.26mi | 3/1.0 (-1) | 1,225 (-7%) | 15mo | $340,000 | $278 | 58 |
| 1536 Perryman Rd | 0.70mi | 4/2.0 | 1,466 (+11%) | 1mo | $329,000 | $224 | 44 |
| 1406 Cranberry Rd | 0.63mi | 3/2.0 (-1) | 1,512 (+14%) | 23mo | $300,000 | $198 | 18 |
Match score weights: distance 35% · size 25% · config 20% · recency 20%. Top-matched comps best support the ARV.
Projected returns pro-forma
-3.0% appreciation · 0.28% rent growth · sell at horizon
- IRR
- -10.5%
- Equity multiple
- 0.63×
- Total profit
- $-28,193
- Equity at exit
- $40,250
- IRR
- -5.2%
- Equity multiple
- 0.70×
- Total profit
- $-22,810
- Equity at exit
- $23,340
Cash invested: $75,586 (down + closing). Projections, not guarantees.
Landlord ↔ Tenant lean methodology
- Overall (STATE)
- 27 Tenant-Leaning
- State Maryland
- 27 Tenant-Leaning · D+14
- County
- — inherits STATE
- City
- — inherits STATE
ZIP-level market 21001
- Home prices YoY
- -30.5%
- Rents YoY
- 0.3%
- Active inventory
- 186
- Price-to-rent
- 8.6×
Monthly cashflow live
- Estimated rent
- $2,620 high interval (Pro) →
- Mortgage (P&I)
- −$1,416
- Tax from tax record
- −$187 /mo · $2,243/yr
- Insurance
- −$112
- HOA
- −$0
- Vacancy / Maint / Mgmt
- −$550
- Net cashflow
- $355
Break-even live
UW: 25.0% down · 7.5% · 30yr · 1.5% tax · 5.0% vac · 8.0% maint · 8.0% mgmt
Financing live
Cash to close
- Down payment
- $67,488
- Closing costs
- $8,098
- Reserves months
- —
- Total cash needed
- —
Loan-product check · same deal, 3 products live
Conventional
25% down · 7.5% · 30yr
- Down + closing
- —
- Monthly P&I
- —
- Monthly cashflow
- —
- DSCR
- —
- Eligible?
- —
Personal DTI + credit; lowest rate.
DSCR
20% down · 8.5% · 30yr
- Down + closing
- —
- Monthly P&I
- —
- Monthly cashflow
- —
- DSCR
- —
- Eligible?
- —
No personal income docs; deal must DSCR.
Hard money
10% down · 12.0% · 12mo
- Down + closing
- —
- Monthly P&I
- —
- Monthly cashflow
- —
- DSCR
- —
- Eligible?
- —
Short-term bridge; refi at stabilization.
Rent comps 5 comps
| Address | Beds | Baths | Sqft | Rent | $/sqft | DOM | Units | Dist |
|---|---|---|---|---|---|---|---|---|
| 4927 Bristle Cone Cir Aberdeen, MD | 3.0 | 2.5 | 1620 | $2,200 | $1.36 | 3d | 1 | 0.97mi |
| 5068 Bristle Cone Cir Aberdeen, MD | 3.0 | 2.5 | 1636 | $2,700 | $1.65 | 43d | 1 | 1.04mi |
| 5054 Bristle Cone Cir Aberdeen, MD | 3.0 | 2.5 | 1815 | $2,695 | $1.48 | 43d | 1 | 1.07mi |
| 1347 Spindrift Rd Aberdeen, MD | 3.0 | 2.5 | 1660 | $2,749 | $1.66 | 43d | 1 | 1.08mi |
| 4719 Witchhazel Way Aberdeen, MD | 3.0 | 2.5 | 1860 | $2,400 | $1.29 | 15d | 1 | 1.30mi |
Listing history 19 events
-
2026-06-13statusdays on market $269,950 Pending 13 DOM
-
2026-06-09days on market $269,950 Active 11 DOM
-
2026-06-08days on market $269,950 Active 10 DOM
-
2026-06-07days on market $269,950 Active 9 DOM
-
2026-06-04days on market $269,950 Active 6 DOM
-
2026-06-03days on market $269,950 Active 5 DOM
-
2026-06-02days on market $269,950 Active 4 DOM
-
2026-06-01days on market $269,950 Active 3 DOM
-
2026-05-31days on market $269,950 Active 2 DOM
-
2026-05-29$269,950 Active
-
2023-04-03soldstatus $69,000
-
2016-06-14historical Withdrawn
-
2016-06-14historical
-
2016-06-13price
-
2016-06-13status Active
-
2016-06-10
-
2016-06-10historical
-
2016-06-10$109,900
-
1996-10-30soldstatus $50,000
ⓘ Source: listings_history table (triggers on properties + properties_extension) + one-shot
backfill from property_details.listing_events for pre-trigger history.
Tax reassessment forecast MD · Partial reset (capped growth)
- Current annual tax
- $2,243 · $187/mo
- Projected year-2 tax
- $2,593 · $216/mo
- Expected delta
- +$350/yr (+$29/mo · 15.6%)
ⓘ Screening estimate from a state-policy table — verify with the county assessor before closing.
Climate risk First Street
- Flood 5/10 Major FEMA zone X (unshaded) · 26% chance over 30 yrs
- Wildfire 3/10 Moderate
- Heat 7/10 Severe 7 d/yr ≥105°F today · 15 d/yr by 30 yrs out
- Wind 6/10 Major 27% chance of damaging wind over 30 yrs
- Air quality 3/10 Moderate 2 unhealthy d/yr today · 3 by 30 yrs out
Nearby sold comps map
Loading sold comps map…
Walkable amenities ~0.75 mi
Loading nearby amenities…
Taxation est. · year 1
- Rental income
- $31,437
- − Mortgage interest
- −$15,121
- − Property taxes
- −$2,243
- − Insurance
- −$1,350
- − Repairs & maintenance
- −$2,515
- − Management
- −$2,515
- − Depreciation
- −$7,853
- Taxable loss
- −$160
- Est. tax savings @ 24.0%
- +$38
- After-tax cash flow
- $4,293/yr
For passive investors: Depreciation is non-cash, so a rental often shows a tax loss while cash-flowing — sheltering income. Rental losses are passive: they offset passive income freely, and up to $25,000/yr can offset ordinary (W-2) income if you actively participate and your MAGI is under $100k (phasing out to $0 by $150k); unused losses carry forward. On sale, claimed depreciation is recaptured at up to 25%, and gains may owe capital-gains tax (a 1031 exchange can defer both). Figures are a year-1 estimate at your 24.0% rate — not tax advice; consult a CPA.
Schools (NCES district)
- District
- Harford County Public Schools
- NCES district ID
- 2400390
- Math proficiency
- 22% ▼ -23.00%
- Reading proficiency
- 39% ▼ -12.00%
- Median HH income
- $79,569
- Composite
- 29.38/100
- National rank
- #6527
- State rank
- #9 of 24 in MD
Livability — Perryman
- Score
- 63/100
- State rank
- #293
- US rank
- #15253
Category grades
Schools grade is shown separately in the Schools card above.
Census & demographics
- Census place
- Perryman, MD
- County
- Harford County · 198,512 people
- City population
- 75
- Metro
- Baltimore-Columbia-Towson, MD
- Population (ZIP)
- 27,168
- Household income
- $83,238
- Rent vs Own
- Severe rent burden
- 736.0
Population outlook (Harford County) Hauer SSP2
- Today (2025)
- 262,292 people
- By 2030
- 266,437 · +1.6%
- By 2040
- 269,954 · +2.9%
- By 2050
- 265,659 · +1.3%
- By 2075
- 252,886 · -3.6%
- By 2100
- 224,014 · -14.6%
Race, ethnicity, and origin ACS 2023
- Neighborhood character
- Diverse neighborhood (Simpson 0.62)
- Race & ethnicity
- White 54% Black 28% Hispanic / Latino 9% Two or more races 9% Asian 3%
- Hispanic origin (detail)
- Mexican 3% Puerto Rican 2% Dominican 1%
- Common ancestry
- Romanian 3% Slovak 1% Scotch-Irish 1%
- Foreign-born
- 8% · Canada, China, South Korea
- Languages at home
- 89% English-only · Spanish 4% Other Indo-European 1% German/W. Germanic 1%
Political lean MEDSL · Harford
- 2024 margin
- R (+13.8) · D 41.9% · R 55.7% · Other 2.4%
- 2008→2024 swing
- +5.0pp toward D · 2008: -18.8pp · 2024: -13.8pp
- All cycles
- 2024: R+13.8 2020: R+12.0 2016: R+24.5 2012: R+19.5 2008: R+18.8
Not yet ingested
- Civics
- —
Market trends
- HPI YoY
- ▼ -108.65%
- Current HPI
- 247.668
- Rent YoY
- ▲ 0.28%
- Metro
- Baltimore-Columbia-Towson, MD
- State GDP YoY
- ▲ 2.97%
- F500 in state
- 12
Industry mix (Fortune 500 HQ in MD)
| Industry | F500 HQs | Revenue |
|---|---|---|
| Aerospace / Defense | 1 | $71B |
|
||
| Utilities | 1 | $25B |
|
||
| Hotels | 1 | $24B |
|
||
| Consumer Goods | 1 | $7B |
|
||
| Real Estate | 1 | $6B |
|
||
| Chemicals | 1 | $2B |
|
||
Price history
+439.9% since first listed10 events — show timeline
- 2026-05-29 Listed $269,950 BRIGHT MLS
- 2023-04-03 Sold (Public Records) $69,000 Public Records
- 2016-06-14 Listing Removed — BRIGHT MLS
- 2016-06-14 Delisted — MRIS
- 2016-06-13 Price Changed — MRIS
- 2016-06-13 Relisted — MRIS
- 2016-06-10 Listed $109,900 BRIGHT MLS
- 2016-06-10 Delisted — MRIS
- 2016-06-10 Listed — MRIS
- 1996-10-30 Sold (Public Records) $50,000 Public Records
Property tax history
+0.4%/yrLatest (2025): $2,243 · +6.4% YoY. Source: county tax records.
Cash-flow waterfall
monthlySold comps — $/sqft
last 12 mo · ≤1 miLoading sold comps…