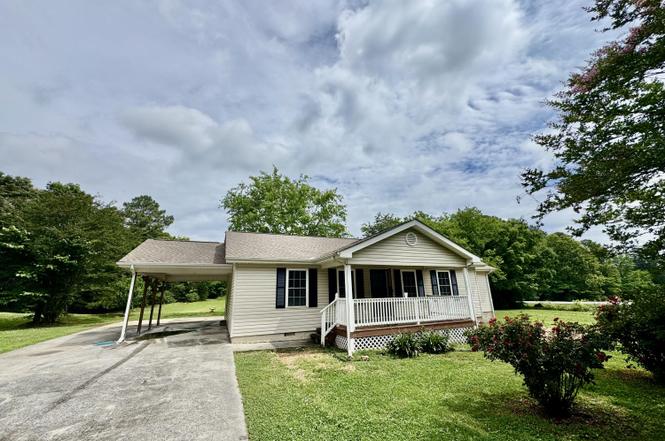
600 Pine Oaks Dr · Tunnel Hill, GA
Flood risk 1/10 · Minimal
- FEMA flood zone
- X (unshaded)
- Chance of flooding over 30 yrs
- 0.0%
- Est. flood insurance / yr
- $507 – $1,088
Fire risk 5/10 · Moderate
- Est. fire insurance / yr
- $963 – $1,789
Heat risk 6/10 · Moderate
- Hot days now (above 105°F)
- 7 days/yr
- Hot days in 30 yrs
- 19 days/yr
Wind risk 4/10 · Minor
- Chance of severe wind over 30 yrs
- 10.0%
Air-quality risk 3/10 · Minor
- Unhealthy air days now
- 2 days/yr
- Unhealthy air days in 30 yrs
- 2 days/yr
Risk factors via First Street. Map © Google.
Why this score? — see what drove the D- grade
The composite is a weighted blend of 9 inputs, each scored 0–100. Each bar is that input's sub-score; the figure is the points it added to the 100-point composite (weight × sub-score).
- Cash flow +13.8/30.0
- ARV discount +5.1/15.0
- DSCR +4.2/10.0
- Livability +3.4/5.0
- 1% rule +3.0/10.0
- Schools +3.0/10.0
- Rent growth +2.5/5.0
- Condition / age +2.5/5.0
- Appreciation +0.0/10.0
$219,900
🖨 Deal sheet 📄 Offer letter ✓ Due diligence
Listing remarks MLS
Charming 3/2 single-story residence in Tunnel Hill, offering convenience to schools, stores, and interstate access. Featuring a newer roof and laminate flooring throughout, this property boasts a spacious living area and generously sized bedrooms. The home is situated on a nice size corner lot.
Key facts
- Level yard
- Tunnel hill location
- Carport
Tags
Property features AI
Exterior
- Parking: Has carport (1 space); Driveway; Kitchen-level parking access
- Utilities: Public water; Septic tank; Electricity connected; Water connected; Sewer not available
- Home design: Single-family residence; One story
- Construction: Vinyl siding; Block foundation
- Exterior features: Level lot
Interior
- Kitchen: Refrigerator; Range hood
- Bedrooms: Total rooms: 8
- Bathrooms: 2 full bathrooms
- Heating & cooling: Central heating; Central air conditioning
- Interior features: Eat-in kitchen; Porch (covered)
- Laundry & utility: Main level laundry room
Neighborhood map
What this means for you Summary
Snapshot
- This is a 3-bed/1.5-bath single-family listed at $220k.
Deal economics
- At list price, monthly cash flow is $22 ($263/yr) — positive.
- The deal already cash-flows at list — no discount required.
- To meet the 1% rule (rent ≥ 1% of price), the offer needs to be $176k (19.7% below list).
- Recommended offer: $176k (19.7% below list) — sets the bar for 1% rule.
- Cap rate 6.4% vs local median 4.0% in Tunnel Hill — top-decile yield for the area; either an underpriced asset or a hidden risk that comps aren't pricing in. Stress-test before assuming the spread holds.
Location & tenants
- Location reads 67/100 on livability (#164 in GA) — a middle-class / working-renter tenant base. Strengths: crime A+, cost of living A+, housing A+; Watch: amenities F, commute F, health & safety F.
- Whitfield County (rural): math 37% / reading 34% proficiency, ranked #62 of 174 in GA (top 36%) — families likely to look elsewhere, expect single-tenant / working-renter base with shorter leases; 61% free/reduced lunch — lower-income household profile, screen leases tightly.
- Zoned schools: Tunnel Hill Elementary School (math 57% / reading 32%, grade F, #336 of 1,228 statewide, top 29%, 310 students, 55% FRL); Westside Middle School (math 46% / reading 51%, grade C-, #75 of 470 statewide, top 17%, 392 students, 59% FRL); Northwest Whitfield County High School (math 29% / reading 34%, grade F, #122 of 424 statewide, top 30%, 1,219 students, 49% FRL).
- Market conditions: 64 active listings in the ZIP; 2 comparable units currently listed for rent nearby; 374 units permitted in Whitfield County in 2024 (35 in 5+ unit buildings).
Forward outlook
- Local home prices are declining (-3.0%/yr); year-one equity from $2k of loan paydown is wiped out by about $7k of value loss. Plan a longer hold.
- Whitfield County population projected at +3% by 2050 — modest demand growth; plan on rents tracking national, not racing it.
Negotiation context
- Only 2 days on market — expect competitive offers; lowballing is unlikely to land.
- 6 sale attempts since 14y ago with the ask held roughly flat each time — persistent listings suggest the price (not the market) is what's stuck; bring a comps-based counter.
- Current owner paid $152k; 45% above their basis — modest negotiation headroom, anchor on the comps not their cost.
Risks & watch-outs
- Climate carrying-cost: moderate wildfire risk; extreme-heat days projected 7→19/yr by 2055 (HVAC capex compounding) — expect insurance premiums to compound above CPI over the hold.
Questions for the listing agent
- Is there a deadline driving the sale (1031 exchange, divorce, estate, relocation)? That informs how much negotiation room exists.
- Schools are D-rated, which usually means shorter tenancies and higher turnover. Who's the typical renter profile here, and what's been the actual vacancy rate?
- The area grade is low — what's the realistic commute time and amenity access for the typical tenant pool here? Any planned neighborhood developments (good or bad) we should know about?
- What's the average days-on-market for RENTAL listings here right now (not sales)? A rising rental-DOM trend means longer vacancies and softer asking-rent achievability than the comps imply.
- What's the recent tenant-quality profile in this submarket — average credit score on applications, eviction rate, late-payment / NSF rate, and stable-employment percentage? A property-management company in the area should have these aggregated.
- How much new for-sale + rental construction is in the pipeline within 1–3 miles? Heavy new supply typically softens prices + rents 12–24 months out; constrained supply supports both.
Investment metrics
- 1% rule
- 0.80% ✗
- Cap rate
- 6.41%
- Cash-on-cash
- 0.43%
- DSCR
- 1.02
- GRM
- 10.4
CMA / ARV
- ARV (on-the-fly)
- $208,600
- Comps found
- 9
Show comp detail 9 sales within ~0.75 mi
| Address | Dist | Beds/Ba | Sqft | Sold | Price | $/sf | Match |
|---|---|---|---|---|---|---|---|
| 600 Pine Oaks Drive Dr | 0.00mi | 3/2.0 | 1,400 (0%) | 2mo | $152,000 | $109 | 96 |
| 605 Pine Oaks Dr | 0.05mi | 3/2.0 | 1,245 (-11%) | 8mo | $236,000 | $190 | 70 |
| 295 Cody Way Way | 0.29mi | 3/1.0 | 1,533 (+10%) | 0mo | $225,000 | $147 | 68 |
| 191 Mayfield Drive Dr | 0.25mi | 3/2.0 | 1,210 (-14%) | 5mo | $180,000 | $149 | 60 |
| 841 Mountain Leaf Drive Dr | 0.43mi | 3/2.0 | 1,366 (-2%) | 19mo | $250,000 | $183 | 58 |
| 844 Mountain Leaf Dr | 0.41mi | 3/2.0 | 1,464 (+5%) | 18mo | $196,000 | $134 | 56 |
| 901 Raygan Dr | 0.57mi | 3/1.5 | 1,298 (-7%) | 8mo | $200,000 | $154 | 54 |
| 740 Shana Lane Ln | 0.68mi | 2/2.0 (-1) | 1,456 (+4%) | 11mo | $179,000 | $123 | 45 |
| 943 Morgan Dr | 0.45mi | 3/2.0 | 1,235 (-12%) | 19mo | $210,000 | $170 | 41 |
Match score weights: distance 35% · size 25% · config 20% · recency 20%. Top-matched comps best support the ARV.
Projected returns pro-forma
-3.0% appreciation · 3.0% rent growth · sell at horizon
- IRR
- -15.7%
- Equity multiple
- 0.44×
- Total profit
- $-34,299
- Equity at exit
- $32,788
- IRR
- -7.3%
- Equity multiple
- 0.54×
- Total profit
- $-28,327
- Equity at exit
- $19,013
Cash invested: $61,572 (down + closing). Projections, not guarantees.
Landlord ↔ Tenant lean methodology
- Overall (STATE)
- 90 Strongly Landlord-Friendly
- State Georgia
- 90 Strongly Landlord-Friendly · R+3
- County
- — inherits STATE
- City
- — inherits STATE
ZIP-level market 30755
- Home prices YoY
- -22.7%
- Active inventory
- 64
- Price-to-rent
- 10.4×
Monthly cashflow live
- Estimated rent
- $1,765 medium interval (Pro) →
- Mortgage (P&I)
- −$1,153
- Tax from tax record
- −$127 /mo · $1,529/yr
- Insurance
- −$92
- HOA
- −$0
- Vacancy / Maint / Mgmt
- −$371
- Net cashflow
- $22
Break-even live
UW: 25.0% down · 7.5% · 30yr · 1.5% tax · 5.0% vac · 8.0% maint · 8.0% mgmt
Financing live
Cash to close
- Down payment
- $54,975
- Closing costs
- $6,597
- Reserves months
- —
- Total cash needed
- —
Loan-product check · same deal, 3 products live
Conventional
25% down · 7.5% · 30yr
- Down + closing
- —
- Monthly P&I
- —
- Monthly cashflow
- —
- DSCR
- —
- Eligible?
- —
Personal DTI + credit; lowest rate.
DSCR
20% down · 8.5% · 30yr
- Down + closing
- —
- Monthly P&I
- —
- Monthly cashflow
- —
- DSCR
- —
- Eligible?
- —
No personal income docs; deal must DSCR.
Hard money
10% down · 12.0% · 12mo
- Down + closing
- —
- Monthly P&I
- —
- Monthly cashflow
- —
- DSCR
- —
- Eligible?
- —
Short-term bridge; refi at stabilization.
Rent comps 2 comps
| Address | Beds | Baths | Sqft | Rent | $/sqft | DOM | Units | Dist |
|---|---|---|---|---|---|---|---|---|
| 600 Pine Oaks Dr Tunnel Hill, GA | 3.0 | 2.0 | 1400 | $1,800 | $1.29 | 23d | 1 | 0.03mi |
| 3316 Chattanooga Rd Unit B Tunnel Hill, GA | 2.0 | 1.5 | 1000 | $1,350 | $1.35 | 44d | 1 | 0.84mi |
Listing history 3 events
-
2026-06-19days on market $219,900 Active 2 DOM
-
2026-06-18remarks 105-char remark
-
2026-06-18$219,900 Active 1 DOM
ⓘ Source: listings_history table (triggers on properties + properties_extension) + one-shot
backfill from property_details.listing_events for pre-trigger history.
Tax reassessment forecast GA · Resets to sale price
- Current annual tax
- $1,529 · $127/mo
- Projected year-2 tax
- $2,023 · $169/mo
- Expected delta
- +$494/yr (+$41/mo · 32.3%)
ⓘ Screening estimate from a state-policy table — verify with the county assessor before closing.
Climate risk First Street
- Flood 1/10 Low FEMA zone X (unshaded) · 0% chance over 30 yrs
- Wildfire 5/10 Major
- Heat 6/10 Major 7 d/yr ≥105°F today · 19 d/yr by 30 yrs out
- Wind 4/10 Moderate 10% chance of damaging wind over 30 yrs
- Air quality 3/10 Moderate 2 unhealthy d/yr today · 2 by 30 yrs out
Nearby sold comps map
Loading sold comps map…
Walkable amenities ~0.75 mi
Loading nearby amenities…
Taxation est. · year 1
- Rental income
- $21,177
- − Mortgage interest
- −$12,318
- − Property taxes
- −$1,529
- − Insurance
- −$1,100
- − Repairs & maintenance
- −$1,694
- − Management
- −$1,694
- − Depreciation
- −$6,397
- Taxable loss
- −$3,554
- Est. tax savings @ 24.0%
- +$853
- After-tax cash flow
- $1,116/yr
For passive investors: Depreciation is non-cash, so a rental often shows a tax loss while cash-flowing — sheltering income. Rental losses are passive: they offset passive income freely, and up to $25,000/yr can offset ordinary (W-2) income if you actively participate and your MAGI is under $100k (phasing out to $0 by $150k); unused losses carry forward. On sale, claimed depreciation is recaptured at up to 25%, and gains may owe capital-gains tax (a 1031 exchange can defer both). Figures are a year-1 estimate at your 24.0% rate — not tax advice; consult a CPA.
Schools (NCES district)
- District
- Whitfield County
- NCES district ID
- 1305700
- Math proficiency
- 37% ▼ -6.00%
- Reading proficiency
- 34% ▼ -9.00%
- Median HH income
- $44,296
- Composite
- 30.24/100
- National rank
- #6290
- State rank
- #62 of 174 in GA
Livability — Tunnel Hill
- Score
- 67/100
- State rank
- #164
- US rank
- #10419
Category grades
Schools grade is shown separately in the Schools card above.
Census & demographics
- Population (ZIP)
- 10,768
Population outlook (Whitfield County) Hauer SSP2
- Today (2025)
- 107,770 people
- By 2030
- 108,737 · +0.9%
- By 2040
- 110,260 · +2.3%
- By 2050
- 111,205 · +3.2%
- By 2075
- 113,014 · +4.9%
- By 2100
- 112,775 · +4.6%
Race, ethnicity, and origin ACS 2023
- Neighborhood character
- Predominantly White (78%)
- Race & ethnicity
- White 78% Hispanic / Latino 17% Two or more races 7% Black 2% Native American 1%
- Hispanic origin (detail)
- Mexican 10%
- Common ancestry
- Lithuanian 2% Italian 2% Slovak 1%
- Foreign-born
- 4% · Canada
- Languages at home
- 88% English-only · Spanish 12%
Political lean MEDSL · Whitfield
- 2024 margin
- Solid R (+44.5) · D 27.5% · R 72.0%
- 2008→2024 swing
- -4.5pp toward R · 2008: -40.0pp · 2024: -44.5pp
- All cycles
- 2024: R+44.5 2020: R+40.7 2016: R+44.8 2012: R+45.1 2008: R+40.0
Not yet ingested
- Civics
- —
Market trends
- HPI YoY
- ▼ -84.96%
- Current HPI
- 289.9653
- Rent YoY
- —
- Metro
- —
- State GDP YoY
- ▲ 2.66%
- F500 in state
- 28
Industry mix (Fortune 500 HQ in GA)
| Industry | F500 HQs | Revenue |
|---|---|---|
| Paper / Packaging | 2 | $29B |
|
||
| Retail | 1 | $160B |
|
||
| Transportation / Logistics | 1 | $91B |
|
||
| Airlines | 1 | $62B |
|
||
| Consumer Goods | 1 | $47B |
|
||
| Utilities | 1 | $25B |
|
||
Price history
+103.6% since first listed15 events — show timeline
- 2026-06-17 Listed $219,900 GCAR
- 2026-05-23 Listed for Rent $1,800 GCAR
- 2026-04-17 Sold (MLS) $152,000 CCARMLS
- 2026-04-02 Pending — CCARMLS
- 2026-03-30 Relisted — CCARMLS
- 2026-03-23 Pending — CCARMLS
- 2026-02-26 Price Changed $224,900 CCARMLS
- 2026-02-16 Price Changed $229,900 CCARMLS
- 2026-02-06 Listed $234,900 CCARMLS
- 2019-11-08 Sold (Public Records) $130,000 Public Records
- 2019-10-17 Sold (MLS) $130,000 CCARMLS
- 2019-08-15 Listed $125,000 CCARMLS
- 2012-08-08 Sold (MLS) $65,200 CCARMLS
- 2012-06-04 Listed $57,000 CCARMLS
- 2002-07-26 Sold (Public Records) $108,000 Public Records
Property tax history
+3.8%/yrLatest (2025): $1,529 · -9.0% YoY. Source: county tax records.
Cash-flow waterfall
monthlySold comps — $/sqft
last 12 mo · ≤1 miLoading sold comps…