 Multi-family
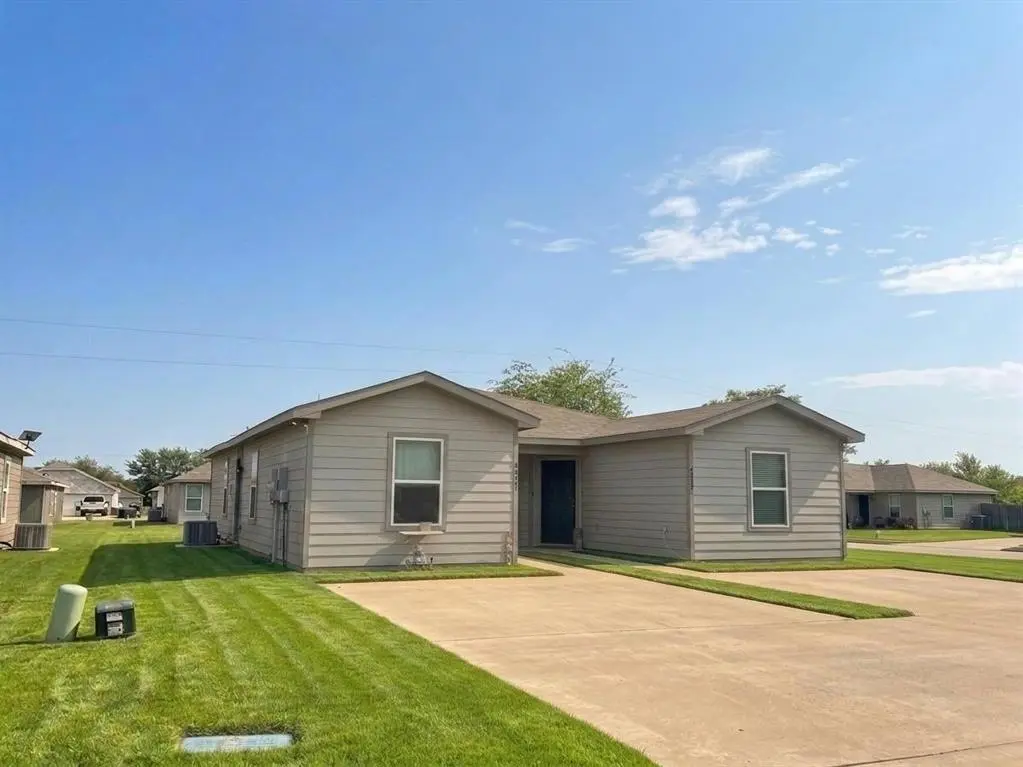
427 County Line Rd · Mabank, TX
Flood risk 1/10 · Minimal
- FEMA flood zone
- X (unshaded)
- Chance of flooding over 30 yrs
- 0.0%
- Est. flood insurance / yr
- $507 – $1,088
Fire risk 4/10 · Minor
- Est. fire insurance / yr
- $1,222 – $2,270
Heat risk 7/10 · Major
- Hot days now (above 110°F)
- 7 days/yr
- Hot days in 30 yrs
- 26 days/yr
Wind risk 6/10 · Moderate
- Chance of severe wind over 30 yrs
- 66.0%
Air-quality risk 2/10 · Minimal
- Unhealthy air days now
- 0 days/yr
- Unhealthy air days in 30 yrs
- 1 days/yr
Risk factors via First Street. Map © Google.
Why this score? — see what drove the B+ grade
The composite is a weighted blend of 9 inputs, each scored 0–100. Each bar is that input's sub-score; the figure is the points it added to the 100-point composite (weight × sub-score).
- Cash flow +27.8/30.0
- Appreciation +10.0/10.0
- DSCR +9.8/10.0
- 1% rule +7.8/10.0
- ARV discount +7.5/15.0
- Rent growth +4.5/5.0
- Schools +3.8/10.0
- Livability +3.5/5.0
- Condition / age +2.5/5.0
$249,000
🖨 Deal sheet 📄 Offer letter ✓ Due diligence
Multi-family units
County records classify this as Multi-Family (2-4 Unit). Listing-text estimate: 1 unit. estimate disagrees with records
Listing remarks
Discover a rare opportunity to own an entire 3-bed, 2-bath duplex, with both units offered together as one complete property. Ideal for multi-generational living, rental income, or expanding your investment portfolio, this full duplex provides versatility and long-term value. Each side features a practical layout with bright living areas, functional kitchens, and comfortable bedrooms designed for everyday living. The property sits in a family-friendly neighborhood, offering a peaceful atmosphere while remaining close to city amenities, shopping, dining, and schools. A private driveway provides convenient parking, and the setting adds a touch of country charm with a beautiful view of open fa
Key facts
- Private driveway
- 7,841 sq ft lot
- Built 2021
Tags
Property features AI
Finance
- Other: Property listed as part of a duplex parcel; Listing terms: Cash or Conventional; Possession at closing/funding
- Financial info: Treat as clear loan type; No second mortgage
- HOA & community: No homeowners association
Exterior
- Parking: Driveway
- Security: Smoke detector(s)
- Utilities: City water; City sewer; Not in a municipal utility district
- Home design: Single family residence (attached); One story; Built in 2021; New construction - complete
- Construction: Siding exterior; Slab foundation
- Exterior features: Lot under 0.5 acre (approximately 0.18 acre); Subdivision: Sutton Street Estates Ph 1; Directions: off city lake road to the left, home is first duplex on the left
Interior
- Kitchen: Dishwasher; Electric range; Refrigerator
- Bedrooms: 6 bedrooms (primary bedroom on level 1)
- Bathrooms: 4 full bathrooms
- Heating & cooling: Central heating (electric); Central air conditioning (electric)
- Interior features: Smart Home System; Two living areas; Room count listed as 2
- Laundry & utility: Washer hookup
Neighborhood map
What this means for you Summary
Snapshot
- This is a 6-bed/4.0-bath multifamily listed at $249k.
Deal economics
- At list price, monthly cash flow is $759 ($9k/yr) — positive.
- The deal already cash-flows at list — no discount required.
- Meets the 1% rule at list price ($3k rent vs $249k).
- Cap rate 10.0% vs local median 3.1% in Mabank — top-decile yield for the area; either an underpriced asset or a hidden risk that comps aren't pricing in. Stress-test before assuming the spread holds.
Location & tenants
- Location reads 69/100 on livability (#446 in TX) — a middle-class / working-renter tenant base. Strengths: cost of living A+, housing A+, crime B+; Watch: amenities F, commute F, employment D-.
- Mabank ISD (town): math 47% / reading 44% proficiency, ranked #273 of 826 in TX (top 33%) — families likely to look elsewhere, expect single-tenant / working-renter base with shorter leases.
- Market conditions: Rents rising fast (+8.1%/yr); 214 active listings in the ZIP; 1,747 units permitted in Kaufman County in 2024 (180 in 5+ unit buildings).
- At $3,180/mo this rent would consume 67% of the median local household income ($57k/yr) (locally 279% of renters already pay >50% of income on rent) — very limited rent-growth headroom before tenants either downsize or default.
Forward outlook
- In year one you build about $27k of equity ($2k loan paydown + $25k appreciation (10.0% local appreciation)).
- Kaufman County population projected at +43% by 2050 — long-run rental-demand tailwind backs the buy-and-hold thesis.
- At projected returns (10.0% appreciation + 8.0% rent growth), your $70k cash investment doubles in ~2 years — after that, you're playing with house money.
- By year 2, paydown + projected appreciation supports a ~$43k cash-out refi (75% LTV) — recoverable capital for the next deal without selling this one.
Negotiation context
- Only 9 days on market — expect competitive offers; lowballing is unlikely to land.
- 3 sale attempts since 2y ago with the ask held roughly flat each time — persistent listings suggest the price (not the market) is what's stuck; bring a comps-based counter.
Risks & watch-outs
- Climate carrying-cost: major wind risk, 66% chance of damaging wind over 30y; extreme-heat days projected 7→26/yr by 2055 (HVAC capex compounding) — expect insurance premiums to compound above CPI over the hold.
Questions for the listing agent
- Is there a deadline driving the sale (1031 exchange, divorce, estate, relocation)? That informs how much negotiation room exists.
- What's the average days-on-market for RENTAL listings here right now (not sales)? A rising rental-DOM trend means longer vacancies and softer asking-rent achievability than the comps imply.
- What's the recent tenant-quality profile in this submarket — average credit score on applications, eviction rate, late-payment / NSF rate, and stable-employment percentage? A property-management company in the area should have these aggregated.
- How much new apartment / multifamily construction is in the pipeline within 1–3 miles? Heavy new supply (>2% of stock underway) typically softens rents 12–24 months out; light construction supports rent growth.
Investment metrics
- 1% rule
- 1.28% ✓
- Cap rate
- 9.95%
- Cash-on-cash
- 13.06%
- DSCR
- 1.58
- GRM
- 6.5
CMA / ARV
No comps found within radius.
Projected returns pro-forma
10.0% appreciation · 8.0% rent growth · sell at horizon
- IRR
- 36.3%
- Equity multiple
- 3.88×
- Total profit
- $200,819
- Equity at exit
- $224,319
- IRR
- 33.1%
- Equity multiple
- 9.54×
- Total profit
- $595,139
- Equity at exit
- $483,752
Cash invested: $69,720 (down + closing). Projections, not guarantees.
Landlord ↔ Tenant lean methodology
- Overall (STATE)
- 87 Strongly Landlord-Friendly
- State Texas
- 87 Strongly Landlord-Friendly · R+5
- County
- — inherits STATE
- City
- — inherits STATE
ZIP-level market 75147
- Home prices YoY
- 4.6%
- Rents YoY
- 8.1%
- Active inventory
- 214
- Price-to-rent
- 13.1×
Monthly cashflow live
- Estimated rent
- $3,180 medium interval (Pro) →
- Mortgage (P&I)
- −$1,306
- Tax from tax record
- −$344 /mo · $4,125/yr
- Insurance
- −$104
- HOA
- −$0
- Vacancy / Maint / Mgmt
- −$668
- Net cashflow
- $759
Break-even live
2-unit breakdown (identical units grouped — click to expand)
| Units | Beds | Baths | Est. rent |
|---|---|---|---|
| 2× units | 3 | 1 | $3,180 |
| #1 | 3 | 1 | $1,590 |
| #2 | 3 | 1 | $1,590 |
| Total (2 units) | $3,180 | ||
UW: 25.0% down · 7.5% · 30yr · 1.5% tax · 5.0% vac · 8.0% maint · 8.0% mgmt
Financing live
Cash to close
- Down payment
- $62,250
- Closing costs
- $7,470
- Reserves months
- —
- Total cash needed
- —
Loan-product check · same deal, 3 products live
Conventional
25% down · 7.5% · 30yr
- Down + closing
- —
- Monthly P&I
- —
- Monthly cashflow
- —
- DSCR
- —
- Eligible?
- —
Personal DTI + credit; lowest rate.
DSCR
20% down · 8.5% · 30yr
- Down + closing
- —
- Monthly P&I
- —
- Monthly cashflow
- —
- DSCR
- —
- Eligible?
- —
No personal income docs; deal must DSCR.
Hard money
10% down · 12.0% · 12mo
- Down + closing
- —
- Monthly P&I
- —
- Monthly cashflow
- —
- DSCR
- —
- Eligible?
- —
Short-term bridge; refi at stabilization.
Listing history 8 events
-
2026-06-19days on market $249,000 Active 9 DOM
-
2026-06-18days on market $249,000 Active 8 DOM
-
2026-06-17days on market $249,000 Active 7 DOM
-
2026-06-16days on market $249,000 Active 6 DOM
-
2026-06-15days on market $249,000 Active 5 DOM
-
2026-06-14days on market $249,000 Active 3 DOM
-
2026-06-12remarks 699-char remark
-
2026-06-12$249,000 Active 2 DOM
ⓘ Source: listings_history table (triggers on properties + properties_extension) + one-shot
backfill from property_details.listing_events for pre-trigger history.
Tax reassessment forecast TX · Resets to sale price
- Current annual tax
- $4,125 · $344/mo
- Projected year-2 tax
- $4,557 · $380/mo
- Expected delta
- +$431/yr (+$36/mo · 10.5%)
ⓘ Screening estimate from a state-policy table — verify with the county assessor before closing.
Climate risk First Street
- Flood 1/10 Low FEMA zone X (unshaded) · 0% chance over 30 yrs
- Wildfire 4/10 Moderate
- Heat 7/10 Severe 7 d/yr ≥110°F today · 26 d/yr by 30 yrs out
- Wind 6/10 Major 66% chance of damaging wind over 30 yrs
- Air quality 2/10 Low 0 unhealthy d/yr today · 1 by 30 yrs out
Nearby sold comps map
Loading sold comps map…
Walkable amenities ~0.75 mi
Loading nearby amenities…
Taxation est. · year 1
- Rental income
- $38,160
- − Mortgage interest
- −$13,948
- − Property taxes
- −$4,125
- − Insurance
- −$1,245
- − Repairs & maintenance
- −$3,053
- − Management
- −$3,053
- − Depreciation
- −$7,244
- Taxable income
- $5,492
- Est. tax owed @ 24.0%
- −$1,318
- After-tax cash flow
- $7,788/yr
For passive investors: Depreciation is non-cash, so a rental often shows a tax loss while cash-flowing — sheltering income. Rental losses are passive: they offset passive income freely, and up to $25,000/yr can offset ordinary (W-2) income if you actively participate and your MAGI is under $100k (phasing out to $0 by $150k); unused losses carry forward. On sale, claimed depreciation is recaptured at up to 25%, and gains may owe capital-gains tax (a 1031 exchange can defer both). Figures are a year-1 estimate at your 24.0% rate — not tax advice; consult a CPA.
Schools (NCES district)
- District
- Mabank ISD
- NCES district ID
- 4828680
- Math proficiency
- 47% ▼ -19.00%
- Reading proficiency
- 44% ▼ -11.00%
- Median HH income
- $40,321
- Composite
- 38.15/100
- National rank
- #4267
- State rank
- #273 of 826 in TX
Livability — Mabank
- Score
- 69/100
- State rank
- #446
- US rank
- #9068
Category grades
Schools grade is shown separately in the Schools card above.
Census & demographics
- Census place
- Mabank, TX
- County
- Van Zandt County · 9,177 people
- Metro
- Dallas-Fort Worth-Arlington, TX
- Population (ZIP)
- 9,177
- Household income
- $56,940
- Rent vs Own
- Severe rent burden
- 279.0
Population outlook (Kaufman County) Hauer SSP2
- Today (2025)
- 138,716 people
- By 2030
- 150,815 · +8.7%
- By 2040
- 174,877 · +26.1%
- By 2050
- 198,020 · +42.8%
- By 2075
- 251,908 · +81.6%
- By 2100
- 285,325 · +105.7%
Race, ethnicity, and origin ACS 2023
- Neighborhood character
- Predominantly White (86%)
- Race & ethnicity
- White 86% Hispanic / Latino 10% Two or more races 8% Black 2%
- Hispanic origin (detail)
- Mexican 10%
- Common ancestry
- Lithuanian 2% Serbian 2% Romanian 1%
- Foreign-born
- 2% · Canada
- Languages at home
- 95% English-only · Spanish 4%
Political lean MEDSL · Kaufman
- 2024 margin
- Strong R (+27.9) · D 35.6% · R 63.5%
- 2008→2024 swing
- +7.9pp toward D · 2008: -35.8pp · 2024: -27.9pp
- All cycles
- 2024: R+27.9 2020: R+33.9 2016: R+47.0 2012: R+44.4 2008: R+35.8
Not yet ingested
- Civics
- —
Market trends
- HPI YoY
- ▲ 11.14%
- Current HPI
- 254.32
- Rent YoY
- ▲ 8.13%
- Metro
- Dallas-Fort Worth-Arlington, TX
- State GDP YoY
- ▲ 3.95%
- F500 in state
- 110
Industry mix (Fortune 500 HQ in TX)
| Industry | F500 HQs | Revenue |
|---|---|---|
| Energy | 16 | $1,198B |
|
||
| Technology | 5 | $198B |
|
||
| Engineering / Construction | 4 | $72B |
|
||
| Energy Services | 3 | $60B |
|
||
| Utilities | 3 | $41B |
|
||
| Healthcare | 2 | $330B |
|
||
Price history
+18141.8% since first listed8 events — show timeline
- 2026-06-09 Listed $249,000 NTREIS
- 2025-01-16 Rental Removed $1,745 ZUMPER1
- 2025-01-07 Listed for Rent $1,745 ZUMPER1
- 2024-10-17 Rental Removed $1,095 RENTALBEAST
- 2024-09-29 Price Changed $1,095 RENTALBEAST
- 2024-09-15 Price Changed $1,150 RENTALBEAST
- 2024-09-05 Listed for Rent $1,205 RENTALBEAST
- 2022-08-13 Price Changed $1,365 RENT.
Property tax history
+59.1%/yrLatest (2025): $4,125 · -1.1% YoY. Source: county tax records.
Cash-flow waterfall
monthlySold comps — $/sqft
last 12 mo · ≤1 miLoading sold comps…