4345 Wanda St · Flagler Estates, FL
Flood risk 1/10 · Minimal
- FEMA flood zone
- X (unshaded)
- Chance of flooding over 30 yrs
- 0.0%
- Est. flood insurance / yr
- $507 – $1,088
Fire risk 6/10 · Moderate
- Est. fire insurance / yr
- $947 – $1,759
Heat risk 9/10 · Severe
- Hot days now (above 107°F)
- 7 days/yr
- Hot days in 30 yrs
- 20 days/yr
Wind risk 9/10 · Severe
- Chance of severe wind over 30 yrs
- 99.0%
Air-quality risk 2/10 · Minimal
- Unhealthy air days now
- 1 days/yr
- Unhealthy air days in 30 yrs
- 2 days/yr
Risk factors via First Street. Map © Google.
Why this score? — see what drove the C+ grade
The composite is a weighted blend of 9 inputs, each scored 0–100. Each bar is that input's sub-score; the figure is the points it added to the 100-point composite (weight × sub-score).
- Cash flow +16.6/30.0
- ARV discount +15.0/15.0
- Appreciation +10.0/10.0
- Schools +6.4/10.0
- DSCR +5.1/10.0
- 1% rule +3.5/10.0
- Livability +3.1/5.0
- Rent growth +2.5/5.0
- Condition / age +2.5/5.0
$199,500
🖨 Deal sheet 📄 Offer letter ✓ Due diligence
Listing remarks MLS
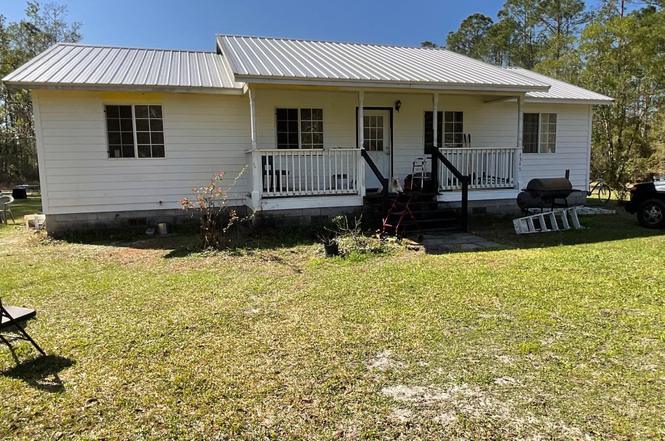
LOVELY HOME ON 1.25 ACRES. RECENTLY REMODELED FRAME HOME ON RAISED FOUNDATION. EXTERIOR IS DURABLE HARDY-BOARD SIDING. THIS HOME AND PROPERTY IS VERY WELL KEPT AND IS A STEAL FOR SOMEONE LOOKING FOR THE PEACE AND QUIET OF THE COUNTRY BUT STILL BEING CLOSE TO THE BEACHES AND SHOPPING.
Key facts
- Metal roof
- Country living
- 1.14 acre lot
Tags
Neighborhood map
What this means for you Summary
Snapshot
- This is a 3-bed/2.0-bath single-family listed at $200k.
Deal economics
- At list price, monthly cash flow is $119 ($1k/yr) — positive.
- The deal already cash-flows at list — no discount required.
- To meet the 1% rule (rent ≥ 1% of price), the offer needs to be $170k (14.6% below list).
- Recommended offer: $170k (14.6% below list) — sets the bar for 1% rule.
- Cap rate 7.0% vs local median 4.0% in Flagler Estates — top-decile yield for the area; either an underpriced asset or a hidden risk that comps aren't pricing in. Stress-test before assuming the spread holds.
Location & tenants
- Location reads 62/100 on livability (#763 in FL) — a middle-class / working-renter tenant base. Strengths: cost of living A+, housing A+, crime A-; Watch: health & safety C-, amenities F, commute F.
- St. Johns (rural): math 75% / reading 73% proficiency, ranked #2 of 73 in FL (top 3%) — strong family-tenant draw, lease renewals of 3-5y typical; only 20% free/reduced lunch — higher-income household profile.
- Zoned schools: South Woods Elementary School (math 51% / reading 46%, grade D, #1,152 of 2,144 statewide, top 55%, 689 students, 66% FRL); Gamble Rogers Middle School (math 61% / reading 55%, grade B, #151 of 571 statewide, top 27%, 925 students, 47% FRL); Pedro Menendez High School (math 31% / reading 54%, grade F, #264 of 667 statewide, top 41%, 1,519 students, 39% FRL) — zoned schools average 51% FRL vs 20% district-wide (31 pts higher); higher-poverty schools than district average — tighter screening recommended.
- Zoned-school proficiency averages 50% at this address vs 74% district-wide (-24 pts) — the specific schools serving this property underperform the St. Johns average; the district grade overstates school quality for this exact location.
- Market conditions: 234 active listings in the ZIP; 5,575 units permitted in St. Johns County in 2024 (584 in 5+ unit buildings).
Forward outlook
- In year one you build about $21k of equity ($1k loan paydown + $20k appreciation (10.0% local appreciation)).
- St. Johns County population projected at +60% by 2050 — long-run rental-demand tailwind backs the buy-and-hold thesis.
- At projected returns (10.0% appreciation + 3.0% rent growth), your $56k cash investment doubles in ~3 years — after that, you're playing with house money.
- By year 2, paydown + projected appreciation supports a ~$34k cash-out refi (75% LTV) — recoverable capital for the next deal without selling this one.
Negotiation context
- Only 8 days on market — expect competitive offers; lowballing is unlikely to land.
- 7 sale attempts since 22y ago with the ask held roughly flat each time — persistent listings suggest the price (not the market) is what's stuck; bring a comps-based counter.
Risks & watch-outs
- Climate carrying-cost: severe wind risk, 99% chance of damaging wind over 30y; major wildfire risk; extreme-heat days projected 7→20/yr by 2055 (HVAC capex compounding) — expect insurance premiums to compound above CPI over the hold.
Questions for the listing agent
- Is there a deadline driving the sale (1031 exchange, divorce, estate, relocation)? That informs how much negotiation room exists.
- Schools are F-rated, which usually means shorter tenancies and higher turnover. Who's the typical renter profile here, and what's been the actual vacancy rate?
- What's the average days-on-market for RENTAL listings here right now (not sales)? A rising rental-DOM trend means longer vacancies and softer asking-rent achievability than the comps imply.
- What's the recent tenant-quality profile in this submarket — average credit score on applications, eviction rate, late-payment / NSF rate, and stable-employment percentage? A property-management company in the area should have these aggregated.
- How much new for-sale + rental construction is in the pipeline within 1–3 miles? Heavy new supply typically softens prices + rents 12–24 months out; constrained supply supports both.
Investment metrics
- 1% rule
- 0.85% ✗
- Cap rate
- 7.01%
- Cash-on-cash
- 2.56%
- DSCR
- 1.11
- GRM
- 9.8
CMA / ARV
- ARV (on-the-fly)
- $247,680
- Comps found
- 12
Show comp detail 12 sales within ~0.75 mi
| Address | Dist | Beds/Ba | Sqft | Sold | Price | $/sf | Match |
|---|---|---|---|---|---|---|---|
| 4345 Wanda St | 0.00mi | 3/2.0 | 1,152 (0%) | 1mo | $199,879 | $174 | 100 |
| 4310 Alvin St | 0.22mi | 3/2.0 | 1,060 (-8%) | 9mo | $249,990 | $236 | 69 |
| 4270 Alvin St | 0.26mi | 3/2.0 | 1,243 (+8%) | 8mo | $265,990 | $214 | 68 |
| 4255 Alvin St | 0.35mi | 3/2.0 | 1,240 (+8%) | 4mo | $295,000 | $238 | 68 |
| 4215 Wanda St | 0.34mi | 2/2.0 (-1) | 1,239 (+8%) | 1mo | $258,990 | $209 | 66 |
| 4200 Wanda St | 0.37mi | 3/2.0 | 1,243 (+8%) | 8mo | $261,990 | $211 | 62 |
| 4410 Vicki St | 0.23mi | 3/2.0 | 1,301 (+13%) | 10mo | $300,000 | $231 | 59 |
| 10340 Light Ave | 0.46mi | 2/2.0 (-1) | 1,239 (+8%) | 6mo | $265,990 | $215 | 56 |
| 10230 Crotty Ave | 0.72mi | 3/2.0 | 1,100 (-4%) | 9mo | $260,000 | $236 | 51 |
| 4415 Olga St | 0.63mi | 3/2.0 | 1,243 (+8%) | 8mo | $265,990 | $214 | 51 |
| 4210 Palatka Blvd | 0.67mi | 2/2.0 (-1) | 1,239 (+8%) | 0mo | $266,990 | $215 | 51 |
| 10350 Dillon Ave | 0.53mi | 3/2.0 | 1,302 (+13%) | 14mo | $295,000 | $227 | 42 |
Match score weights: distance 35% · size 25% · config 20% · recency 20%. Top-matched comps best support the ARV.
Projected returns pro-forma
10.0% appreciation · 3.0% rent growth · sell at horizon
- IRR
- 26.1%
- Equity multiple
- 3.08×
- Total profit
- $116,189
- Equity at exit
- $179,725
- IRR
- 22.9%
- Equity multiple
- 7.02×
- Total profit
- $336,044
- Equity at exit
- $387,585
Cash invested: $55,860 (down + closing). Projections, not guarantees.
Landlord ↔ Tenant lean methodology
- Overall (STATE)
- 87 Strongly Landlord-Friendly
- State Florida
- 87 Strongly Landlord-Friendly · R+3
- County
- — inherits STATE
- City
- — inherits STATE
ZIP-level market 32145
- Home prices YoY
- 19.1%
- Active inventory
- 234
- Price-to-rent
- 9.8×
Monthly cashflow live
- Estimated rent
- $1,705 medium interval (Pro) →
- Mortgage (P&I)
- −$1,046
- Tax from tax record
- −$98 /mo · $1,175/yr
- Insurance
- −$83
- HOA
- −$0
- Vacancy / Maint / Mgmt
- −$358
- Net cashflow
- $119
Break-even live
UW: 25.0% down · 7.5% · 30yr · 1.5% tax · 5.0% vac · 8.0% maint · 8.0% mgmt
Financing live
Cash to close
- Down payment
- $49,875
- Closing costs
- $5,985
- Reserves months
- —
- Total cash needed
- —
Loan-product check · same deal, 3 products live
Conventional
25% down · 7.5% · 30yr
- Down + closing
- —
- Monthly P&I
- —
- Monthly cashflow
- —
- DSCR
- —
- Eligible?
- —
Personal DTI + credit; lowest rate.
DSCR
20% down · 8.5% · 30yr
- Down + closing
- —
- Monthly P&I
- —
- Monthly cashflow
- —
- DSCR
- —
- Eligible?
- —
No personal income docs; deal must DSCR.
Hard money
10% down · 12.0% · 12mo
- Down + closing
- —
- Monthly P&I
- —
- Monthly cashflow
- —
- DSCR
- —
- Eligible?
- —
Short-term bridge; refi at stabilization.
Listing history 22 events
-
2026-04-17soldstatus $199,879
-
2026-03-22status Pending
-
2026-03-13$199,500 Active
-
2011-07-28historical 284-char remark
Show marketing remark (284 chars)
LOVELY HOME ON 1.25 ACRES. RECENTLY REMODELED FRAME HOME ON RAISED FOUNDATION. EXTERIOR IS DURABLE HARDY-BOARD SIDING. THIS HOME AND PROPERTY IS VERY WELL KEPT AND IS A STEAL FOR SOMEONE LOOKING FOR THE PEACE AND QUIET OF THE COUNTRY BUT STILL BEING CLOSE TO THE BEACHES AND SHOPPING.
-
2011-06-21soldstatus $73,900 284-char remark
Show marketing remark (284 chars)
LOVELY HOME ON 1.25 ACRES. RECENTLY REMODELED FRAME HOME ON RAISED FOUNDATION. EXTERIOR IS DURABLE HARDY-BOARD SIDING. THIS HOME AND PROPERTY IS VERY WELL KEPT AND IS A STEAL FOR SOMEONE LOOKING FOR THE PEACE AND QUIET OF THE COUNTRY BUT STILL BEING CLOSE TO THE BEACHES AND SHOPPING.
-
2011-05-12soldstatus $73,900
-
2011-02-17$69,900 284-char remark
Show marketing remark (284 chars)
LOVELY HOME ON 1.25 ACRES. RECENTLY REMODELED FRAME HOME ON RAISED FOUNDATION. EXTERIOR IS DURABLE HARDY-BOARD SIDING. THIS HOME AND PROPERTY IS VERY WELL KEPT AND IS A STEAL FOR SOMEONE LOOKING FOR THE PEACE AND QUIET OF THE COUNTRY BUT STILL BEING CLOSE TO THE BEACHES AND SHOPPING.
-
2010-12-16historical 108-char remark
Show marketing remark (108 chars)
Bank of America prequalification required on all offers. Please allow 2-3 business days for seller response.
-
2010-12-02soldstatus $30,000 108-char remark
Show marketing remark (108 chars)
Bank of America prequalification required on all offers. Please allow 2-3 business days for seller response.
-
2010-12-02soldstatus $30,000
Show marketing remark (108 chars)
Bank of America prequalification required on all offers. Please allow 2-3 business days for seller response.
-
2010-10-18$29,900 108-char remark
Show marketing remark (108 chars)
Bank of America prequalification required on all offers. Please allow 2-3 business days for seller response.
-
2010-10-18$29,900
Show marketing remark (108 chars)
Bank of America prequalification required on all offers. Please allow 2-3 business days for seller response.
-
2006-11-21historical
-
2006-11-07soldstatus $149,000
-
2006-11-03soldstatus $149,000
-
2006-08-29$149,900
-
2006-07-24historical
-
2006-06-06$143,500
-
2004-11-03soldstatus $87,600
-
2004-10-28historical
-
2004-10-27soldstatus $87,600
-
2004-06-28$85,000
ⓘ Source: listings_history table (triggers on properties + properties_extension) + one-shot
backfill from property_details.listing_events for pre-trigger history.
Tax reassessment forecast FL · Resets to sale price
- Current annual tax
- $1,175 · $98/mo
- Projected year-2 tax
- $1,656 · $138/mo
- Expected delta
- +$481/yr (+$40/mo · 41.0%)
ⓘ Screening estimate from a state-policy table — verify with the county assessor before closing.
Climate risk First Street
- Flood 1/10 Low FEMA zone X (unshaded) · 0% chance over 30 yrs
- Wildfire 6/10 Major
- Heat 9/10 Extreme 7 d/yr ≥107°F today · 20 d/yr by 30 yrs out
- Wind 9/10 Extreme 99% chance of damaging wind over 30 yrs
- Air quality 2/10 Low 1 unhealthy d/yr today · 2 by 30 yrs out
Nearby sold comps map
Loading sold comps map…
Walkable amenities ~0.75 mi
Loading nearby amenities…
Taxation est. · year 1
- Rental income
- $20,454
- − Mortgage interest
- −$11,175
- − Property taxes
- −$1,175
- − Insurance
- −$998
- − Repairs & maintenance
- −$1,636
- − Management
- −$1,636
- − Depreciation
- −$5,804
- Taxable loss
- −$1,969
- Est. tax savings @ 24.0%
- +$473
- After-tax cash flow
- $1,905/yr
For passive investors: Depreciation is non-cash, so a rental often shows a tax loss while cash-flowing — sheltering income. Rental losses are passive: they offset passive income freely, and up to $25,000/yr can offset ordinary (W-2) income if you actively participate and your MAGI is under $100k (phasing out to $0 by $150k); unused losses carry forward. On sale, claimed depreciation is recaptured at up to 25%, and gains may owe capital-gains tax (a 1031 exchange can defer both). Figures are a year-1 estimate at your 24.0% rate — not tax advice; consult a CPA.
Schools (NCES district)
- District
- St. Johns
- NCES district ID
- 1201740
- Math proficiency
- 75% ▼ -5.00%
- Reading proficiency
- 73% ▼ -2.00%
- Median HH income
- $66,842
- Composite
- 64.31/100
- National rank
- #556
- State rank
- #2 of 73 in FL
Livability — Flagler Estates
- Score
- 62/100
- State rank
- #763
- US rank
- #16863
Category grades
Schools grade is shown separately in the Schools card above.
Census & demographics
- Census place
- Flagler Estates, FL
- Population (ZIP)
- 5,750
Population outlook (St. Johns County) Hauer SSP2
- Today (2025)
- 303,941 people
- By 2030
- 342,590 · +12.7%
- By 2040
- 417,328 · +37.3%
- By 2050
- 487,011 · +60.2%
- By 2075
- 635,395 · +109.1%
- By 2100
- 717,469 · +136.1%
Race, ethnicity, and origin ACS 2023
- Neighborhood character
- Predominantly White (76%)
- Race & ethnicity
- White 76% Two or more races 16% Hispanic / Latino 9% Black 7%
- Hispanic origin (detail)
- Mexican 8%
- Common ancestry
- Lithuanian 3% Romanian 3% Estonian 3%
- Foreign-born
- 12% · Canada
- Languages at home
- 86% English-only · Spanish 9% Other Indo-European 5%
Political lean MEDSL · St. Johns
- 2024 margin
- Solid R (+31.4) · D 33.9% · R 65.2%
- 2008→2024 swing
- +0.2pp no change · 2008: -31.6pp · 2024: -31.4pp
- All cycles
- 2024: R+31.4 2020: R+26.7 2016: R+33.4 2012: R+37.8 2008: R+31.6
Not yet ingested
- Civics
- —
Market trends
- HPI YoY
- ▲ 40.24%
- Current HPI
- 250.8035
- Rent YoY
- —
- Metro
- —
- State GDP YoY
- ▲ 3.28%
- F500 in state
- 36
Industry mix (Fortune 500 HQ in FL)
| Industry | F500 HQs | Revenue |
|---|---|---|
| Industrial Technology | 2 | $29B |
|
||
| Insurance | 2 | $17B |
|
||
| Retail | 1 | $60B |
|
||
| Technology Distribution | 1 | $58B |
|
||
| Homebuilding | 1 | $35B |
|
||
| Technology Manufacturing | 1 | $35B |
|
||
Price history
+135.2% since first listed22 events — show timeline
- 2026-04-17 Sold (Public Records) $199,879 Public Records
- 2026-03-22 Pending — realMLS
- 2026-03-13 Listed $199,500 realMLS
- 2011-07-28 Listing Removed — realMLS
- 2011-06-21 Sold (MLS) $73,900 realMLS
- 2011-05-12 Sold (Public Records) $73,900 Public Records
- 2011-02-17 Listed $69,900 realMLS
- 2010-12-16 Listing Removed — realMLS
- 2010-12-02 Sold (MLS) $30,000 Stellar MLS as Distributed by MLS Grid
- 2010-12-02 Sold (MLS) $30,000 realMLS
- 2010-10-18 Listed $29,900 Stellar MLS as Distributed by MLS Grid
- 2010-10-18 Listed $29,900 realMLS
- 2006-11-21 Listing Removed — realMLS
- 2006-11-07 Sold (Public Records) $149,000 Public Records
- 2006-11-03 Sold (MLS) $149,000 realMLS
- 2006-08-29 Listed $149,900 realMLS
- 2006-07-24 Listing Removed — realMLS
- 2006-06-06 Listed $143,500 realMLS
- 2004-11-03 Sold (Public Records) $87,600 Public Records
- 2004-10-28 Listing Removed — realMLS
- 2004-10-27 Sold (MLS) $87,600 realMLS
- 2004-06-28 Listed $85,000 realMLS
Property tax history
+2.7%/yrLatest (2025): $1,175 · +13.6% YoY. Source: county tax records.
Cash-flow waterfall
monthlySold comps — $/sqft
last 12 mo · ≤1 miLoading sold comps…