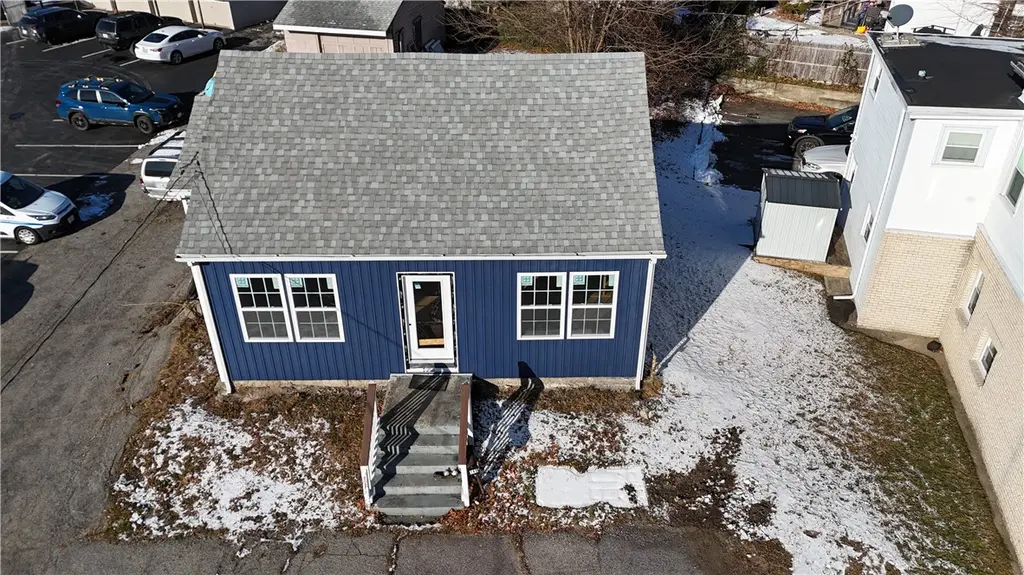
149 Front St · Lincoln, RI
Flood risk No data
- FEMA flood zone
- —
- Chance of flooding over 30 yrs
- —
- Est. flood insurance / yr
- —
Fire risk No data
- Est. fire insurance / yr
- —
Heat risk 5/10 · Moderate
- Hot days now (above threshold)
- 7 days/yr
- Hot days in 30 yrs
- 15 days/yr
Wind risk No data
- Chance of severe wind over 30 yrs
- —
Air-quality risk 2/10 · Minimal
- Unhealthy air days now
- 1 days/yr
- Unhealthy air days in 30 yrs
- 2 days/yr
Risk factors via First Street. Map © Google.
Why this score? — see what drove the C grade
The composite is a weighted blend of 9 inputs, each scored 0–100. Each bar is that input's sub-score; the figure is the points it added to the 100-point composite (weight × sub-score).
- Cash flow +19.6/30.0
- ARV discount +15.0/15.0
- DSCR +6.2/10.0
- 1% rule +5.2/10.0
- Schools +3.9/10.0
- Condition / age +3.8/5.0
- Rent growth +2.5/5.0
- Livability +2.5/5.0
- Appreciation +0.0/10.0
$319,000
🖨 Deal sheet 📄 Offer letter ✓ Due diligence
Listing remarks
Amazing opportunity for an investor, contractor, or family looking to add value and gain instant equity in a highly desirable Lincoln location. This property is currently configured as a two-family with 2 bedrooms and 1 bathroom, plus additional attic space offering expansion potential. The home has been fully gutted, providing a clean slate for you to bring your vision to life and customize to your needs. Significant upfront work has already been completed including survey, approved plans, engineering, and a letter from the town supporting conversion from a commercial office to a two-family. Conversion is contingent on pulling permits and completing required work per town approvals.
Key facts
- Fully gutted
- Attic space
- Off-street parking
Tags
Property features AI
Finance
- Other: Two-unit multi-family property (one building) — Unit A approx. 672 sq ft (2 bed, 1 bath), Unit B approx. 922 sq ft (2 bed, 1 bath)
- Financial info: Operating expense listed at $600 (multi-unit)
- HOA & community: Community offers highway access and nearby recreation area
Exterior
- Parking: Detached garage with 2 parking spaces (total)
- Utilities: Public water service; Cesspool sewer
- Home design: Three-story building; Under construction / New construction
- Construction: Vinyl siding; Combination foundation; New construction / currently under construction; Above-grade finished area approx. 2,266
- Exterior features: Public water; Cesspool sewer; Lot approximately 0.172 acres
Interior
- Kitchen: No hot water (appliance/equipment note)
- Bedrooms: Two 2-bedroom units (each unit described below includes bedrooms)
- Bathrooms: Two full bathrooms total in the building; each unit has 1 full bathroom
- Interior features: Has unfinished full basement with interior and exterior entry
- Laundry & utility: Basement provides interior access for utility/washer-dryer placement
Neighborhood map
What this means for you Summary
Snapshot
- This is a 4-bed/2.0-bath single-family listed at $319k. Condition is rated good.
Deal economics
- At list price, monthly cash flow is $367 ($4k/yr) — positive.
- The deal already cash-flows at list — no discount required.
- Meets the 1% rule at list price ($3k rent vs $319k).
- Recommended offer: $309k (3.0% below list) — sets the bar for market timing.
Location & tenants
- Location reads: area grade C — affects rentability + tenant quality, not the cash-flow math above.
- Lincoln (suburban): math 38% / reading 48% proficiency, ranked #13 of 39 in RI (top 33%) — families likely to look elsewhere, expect single-tenant / working-renter base with shorter leases.
- Market conditions: 93 active listings in the ZIP; 3 comparable units currently listed for rent nearby; rentals at typical pace (median 15d on market — plan ~3-4 weeks tenant-placement turnaround); 776 units permitted in Providence County in 2024 (229 in 5+ unit buildings).
Forward outlook
- Local home prices are declining (-3.0%/yr); year-one equity from $2k of loan paydown is wiped out by about $10k of value loss. Plan a longer hold.
- Providence County population projected at +5% by 2050 — modest demand growth; plan on rents tracking national, not racing it.
Negotiation context
- It's been on market 42 days — a 3% lower offer ($309k) is reasonable based on typical stale-listing flexibility.
- 8 sale attempts since 4y ago with the ask held roughly flat each time — persistent listings suggest the price (not the market) is what's stuck; bring a comps-based counter.
Risks & watch-outs
- Watch-outs: built in 1940 — expect roof / HVAC / electrical / plumbing capex.
- Climate carrying-cost: extreme-heat days projected 7→15/yr by 2055 (HVAC capex compounding) — expect insurance premiums to compound above CPI over the hold.
Questions for the listing agent
- It's been on market 42 days. Have you received any prior offers? Is the seller open to a 3% concession, seller financing, or rate buy-down credit?
- Built in 1940 — when were the roof, HVAC, electrical panel, plumbing, and water heater last replaced?
- Is there a deadline driving the sale (1031 exchange, divorce, estate, relocation)? That informs how much negotiation room exists.
- What's the average days-on-market for RENTAL listings here right now (not sales)? A rising rental-DOM trend means longer vacancies and softer asking-rent achievability than the comps imply.
- What's the recent tenant-quality profile in this submarket — average credit score on applications, eviction rate, late-payment / NSF rate, and stable-employment percentage? A property-management company in the area should have these aggregated.
- How much new for-sale + rental construction is in the pipeline within 1–3 miles? Heavy new supply typically softens prices + rents 12–24 months out; constrained supply supports both.
Investment metrics
- 1% rule
- 1.02% ✓
- Cap rate
- 7.67%
- Cash-on-cash
- 4.93%
- DSCR
- 1.22
- GRM
- 8.2
CMA / ARV
- ARV (median comp)
- $597,623
- List price
- $319,000
- Delta
- -46.62%
- Verdict
- UNDERPRICED
- Comps
- 20 within 1.0 mi
Show comp detail 11 sales within ~0.75 mi
| Address | Dist | Beds/Ba | Sqft | Sold | Price | $/sf | Match |
|---|---|---|---|---|---|---|---|
| 153 Grove St | 0.33mi | 3/2.0 (-1) | 2,308 (+2%) | 1mo | $505,000 | $219 | 75 |
| 2 Forest Way | 0.38mi | 3/1.5 (-1) | 2,312 (+2%) | 0mo | $642,500 | $278 | 72 |
| 1566 Lonsdale Ave | 0.19mi | 3/1.0 (-1) | 2,400 (+6%) | 12mo | $400,000 | $167 | 62 |
| 65 Boulevard Ave | 0.31mi | 3/1.5 (-1) | 1,998 (-12%) | 15mo | $452,000 | $226 | 46 |
| 40 River Rd | 0.43mi | 3/2.0 (-1) | 2,040 (-10%) | 18mo | $425,000 | $208 | 44 |
| 370 River Rd | 0.67mi | 3/1.0 (-1) | 2,280 (+1%) | 19mo | $485,000 | $213 | 42 |
| 2 Arlington Dr | 0.38mi | 3/2.0 (-1) | 2,502 (+10%) | 23mo | $535,000 | $214 | 40 |
| 26 Linda St | 0.67mi | 3/2.5 (-1) | 2,160 (-5%) | 23mo | $615,000 | $285 | 35 |
| 321 River Rd | 0.54mi | 4/2.5 | 2,531 (+12%) | 22mo | $725,000 | $286 | 35 |
| 3 Holiday Ct | 0.61mi | 3/1.0 (-1) | 1,952 (-14%) | 13mo | $476,000 | $244 | 29 |
| 7 Park Blvd | 0.50mi | 3/1.0 (-1) | 1,994 (-12%) | 23mo | $470,000 | $236 | 28 |
Match score weights: distance 35% · size 25% · config 20% · recency 20%. Top-matched comps best support the ARV.
Projected returns pro-forma
-3.0% appreciation · 3.0% rent growth · sell at horizon
- IRR
- -8.6%
- Equity multiple
- 0.68×
- Total profit
- $-28,255
- Equity at exit
- $47,564
- IRR
- 0.9%
- Equity multiple
- 1.06×
- Total profit
- $5,712
- Equity at exit
- $27,581
Cash invested: $89,320 (down + closing). Projections, not guarantees.
Landlord ↔ Tenant lean methodology
- Overall (STATE)
- 31 Tenant-Leaning
- State Rhode Island
- 31 Tenant-Leaning · D+8
- County
- — inherits STATE
- City
- — inherits STATE
ZIP-level market 02865
- Active inventory
- 93
- Price-to-rent
- 8.2×
Monthly cashflow live
- Estimated rent
- $3,255 medium interval (Pro) →
- Mortgage (P&I)
- −$1,673
- Tax est. 1.5%
- −$399 /mo · $4,785/yr
- Insurance
- −$133
- HOA
- −$0
- Vacancy / Maint / Mgmt
- −$684
- Net cashflow
- $367
Break-even live
UW: 25.0% down · 7.5% · 30yr · 1.5% tax · 5.0% vac · 8.0% maint · 8.0% mgmt
Financing live
Cash to close
- Down payment
- $79,750
- Closing costs
- $9,570
- Reserves months
- —
- Total cash needed
- —
Loan-product check · same deal, 3 products live
Conventional
25% down · 7.5% · 30yr
- Down + closing
- —
- Monthly P&I
- —
- Monthly cashflow
- —
- DSCR
- —
- Eligible?
- —
Personal DTI + credit; lowest rate.
DSCR
20% down · 8.5% · 30yr
- Down + closing
- —
- Monthly P&I
- —
- Monthly cashflow
- —
- DSCR
- —
- Eligible?
- —
No personal income docs; deal must DSCR.
Hard money
10% down · 12.0% · 12mo
- Down + closing
- —
- Monthly P&I
- —
- Monthly cashflow
- —
- DSCR
- —
- Eligible?
- —
Short-term bridge; refi at stabilization.
Rent comps 3 comps
| Address | Beds | Baths | Sqft | Rent | $/sqft | DOM | Units | Dist |
|---|---|---|---|---|---|---|---|---|
| 53 Hadwin St Unit 2 Central Falls, RI | 3.0 | 1.0 | 2800 | $2,150 | $0.77 | 4d | 1 | 1.16mi |
| 513 Mendon Rd Unit 1 Attleboro, MA | 3.0 | 2.5 | 1780 | $3,979 | $2.24 | 14d | 1 | 1.44mi |
| 515 Mendon Rd Unit 2 Attleboro, MA | 3.0 | 2.5 | 1780 | $3,950 | $2.22 | 43d | 1 | 1.44mi |
Listing history 25 events
-
2026-06-18days on market $319,000 Active 42 DOM
-
2026-06-17days on market $319,000 Active 41 DOM
-
2026-06-16days on market $319,000 Active 40 DOM
-
2026-06-15days on market $319,000 Active 39 DOM
-
2026-06-13days on market $319,000 Active 37 DOM
-
2026-06-13days on market $319,000 Active 36 DOM
-
2026-06-09days on market $319,000 Active 33 DOM
-
2026-06-08days on market $319,000 Active 32 DOM
-
2026-06-08status $319,000 Active 31 DOM
-
2026-06-02status $319,000 Pending 31 DOM
-
2026-06-01days on market $319,000 Active 31 DOM
-
2026-05-31days on market $319,000 Active 30 DOM
-
2026-05-01$319,000 Active 1088-char remark
-
2026-04-01historical
-
2026-01-02$449,900 Active
-
2023-02-07historical
-
2023-01-19$229,900 Active
-
2023-01-19historical
-
2022-11-22$249,900 Active
-
2022-11-22historical
-
2022-08-03$249,900 Active
-
2022-08-03historical
-
2022-06-28status Active
-
2022-05-14status Pending
-
2022-03-27$249,900 Active
ⓘ Source: listings_history table (triggers on properties + properties_extension) + one-shot
backfill from property_details.listing_events for pre-trigger history.
Climate risk First Street
- Heat 5/10 Major
- Air quality 2/10 Low 1 unhealthy d/yr today · 2 by 30 yrs out
Nearby sold comps map
Loading sold comps map…
Walkable amenities ~0.75 mi
Loading nearby amenities…
Taxation est. · year 1
- Rental income
- $39,065
- − Mortgage interest
- −$17,869
- − Property taxes
- −$4,785
- − Insurance
- −$1,595
- − Repairs & maintenance
- −$3,125
- − Management
- −$3,125
- − Depreciation
- −$9,280
- Taxable loss
- −$715
- Est. tax savings @ 24.0%
- +$172
- After-tax cash flow
- $4,578/yr
For passive investors: Depreciation is non-cash, so a rental often shows a tax loss while cash-flowing — sheltering income. Rental losses are passive: they offset passive income freely, and up to $25,000/yr can offset ordinary (W-2) income if you actively participate and your MAGI is under $100k (phasing out to $0 by $150k); unused losses carry forward. On sale, claimed depreciation is recaptured at up to 25%, and gains may owe capital-gains tax (a 1031 exchange can defer both). Figures are a year-1 estimate at your 24.0% rate — not tax advice; consult a CPA.
Condition & rehab AI · 2 photos
This property is in good condition with a cosmetic rehab level, featuring a well-maintained exterior and a fresh paint job. It offers significant potential for value enhancement through landscaping, interior updates, and HVAC improvements, making it an attractive investment opportunity.
Value-add opportunities
- Both Landscaping and curb appeal improvements — Enhanced landscaping can improve the home's curb appeal and attract more potential buyers or renters.
- Both Interior updates — Updating the interior can make the home more attractive and functional, increasing its value for both resale and rental.
- Both Kitchen and bathroom updates — Modernizing the kitchen and bathrooms can significantly increase the home's value and appeal to a broader range of buyers and renters.
- Both Painting and minor repairs — Fresh paint and minor repairs can make the home look more inviting and well-maintained, enhancing its value for both resale and rental.
- Both HVAC and mechanical updates — Upgrading the HVAC and mechanical systems can improve the home's comfort and energy efficiency, making it more attractive to potential buyers and renters.
- Both Foundation and structural inspection — Ensuring the foundation and structure are in good condition can provide peace of mind for potential buyers and renters, and may also increase the home's value if any issues are found and addressed.
Renovation cost estimate screening
Value-add ROI direction
- Both Landscaping and curb appeal improvements — Enhanced landscaping can improve the home's curb appeal and attract more potential buyers or renters. ↑
- Both Interior updates — Updating the interior can make the home more attractive and functional, increasing its value for both resale and rental. ↑
- Both Kitchen and bathroom updates — Modernizing the kitchen and bathrooms can significantly increase the home's value and appeal to a broader range of buyers and renters. ↑
- Both Painting and minor repairs — Fresh paint and minor repairs can make the home look more inviting and well-maintained, enhancing its value for both resale and rental. ↑
- Both HVAC and mechanical updates — Upgrading the HVAC and mechanical systems can improve the home's comfort and energy efficiency, making it more attractive to potential buyers and renters. ↑
- Both Foundation and structural inspection — Ensuring the foundation and structure are in good condition can provide peace of mind for potential buyers and renters, and may also increase the home's value if any issues are found and addressed. ↑
ⓘ Cost ranges are severity-bucket heuristics (US national rule-of-thumb). Get contractor quotes + a written scope before underwriting a rehab budget.
Schools (NCES district)
- District
- Lincoln
- NCES district ID
- 4400570
- Math proficiency
- 38% ▼ -8.00%
- Reading proficiency
- 48% ▼ -2.00%
- Median HH income
- $69,500
- Composite
- 38.81/100
- National rank
- #4115
- State rank
- #13 of 39 in RI
Livability — Lincoln
No livability data for this city. (Only ~50 U.S. cities are tracked.)
Census & demographics
- Population (ZIP)
- 18,033
Population outlook (Providence County) Hauer SSP2
- Today (2025)
- 653,469 people
- By 2030
- 660,819 · +1.1%
- By 2040
- 672,747 · +3.0%
- By 2050
- 683,741 · +4.6%
- By 2075
- 720,435 · +10.2%
- By 2100
- 741,582 · +13.5%
Race, ethnicity, and origin ACS 2023
- Neighborhood character
- Predominantly White (82%)
- Race & ethnicity
- White 82% Two or more races 9% Hispanic / Latino 6% Asian 5%
- Hispanic origin (detail)
- Mexican 2%
- Common ancestry
- Lithuanian 11% Russian 7% Romanian 4%
- Foreign-born
- 11% · Canada, China, Jamaica
- Languages at home
- 84% English-only · Other Indo-European 7% Spanish 3% Chinese 2%
Political lean MEDSL · Providence
- 2024 margin
- D (+14.4) · D 56.1% · R 41.7% · Other 2.2%
- 2008→2024 swing
- -20.0pp toward R · 2008: 34.4pp · 2024: 14.4pp
- All cycles
- 2024: D+14.4 2020: D+22.9 2016: D+21.2 2012: D+34.9 2008: D+34.4
Not yet ingested
- Civics
- —
Market trends
- HPI YoY
- ▼ -332.01%
- Current HPI
- 325.7543
- Rent YoY
- —
- Metro
- —
- State GDP YoY
- ▲ 2.25%
- F500 in state
- 10
Industry mix (Fortune 500 HQ in RI)
| Industry | F500 HQs | Revenue |
|---|---|---|
| Healthcare | 1 | $373B |
|
||
| Food Distribution | 1 | $31B |
|
||
| Aerospace / Defense | 1 | $14B |
|
||
| Financial Services | 1 | $8B |
|
||
| Consumer Goods | 1 | $4B |
|
||
Price history
+27.7% since first listed15 events — show timeline
- 2026-06-07 Relisted — RIS
- 2026-06-01 Pending — RIS
- 2026-05-01 Listed $319,000 RIS
- 2026-04-01 Listing Removed — RIS
- 2026-01-02 Listed $449,900 RIS
- 2023-02-07 Listing Removed — RIS
- 2023-01-19 Listing Removed — RIS
- 2023-01-19 Listed $229,900 RIS
- 2022-11-22 Listing Removed — RIS
- 2022-11-22 Listed $249,900 RIS
- 2022-08-03 Listing Removed — RIS
- 2022-08-03 Listed $249,900 RIS
- 2022-06-28 Relisted — RIS
- 2022-05-14 Pending — RIS
- 2022-03-27 Listed $249,900 RIS
Cash-flow waterfall
monthlySold comps — $/sqft
last 12 mo · ≤1 miLoading sold comps…