3126 Wallace Dr · Valdosta, GA
Flood risk 1/10 · Minimal
- FEMA flood zone
- X (unshaded)
- Chance of flooding over 30 yrs
- 0.0%
- Est. flood insurance / yr
- $507 – $1,088
Fire risk 6/10 · Moderate
- Est. fire insurance / yr
- $963 – $1,789
Heat risk 7/10 · Major
- Hot days now (above 108°F)
- 7 days/yr
- Hot days in 30 yrs
- 19 days/yr
Wind risk 8/10 · Major
- Chance of severe wind over 30 yrs
- 99.0%
Air-quality risk 6/10 · Moderate
- Unhealthy air days now
- 12 days/yr
- Unhealthy air days in 30 yrs
- 14 days/yr
Risk factors via First Street. Map © Google.
Why this score? — see what drove the D grade
The composite is a weighted blend of 9 inputs, each scored 0–100. Each bar is that input's sub-score; the figure is the points it added to the 100-point composite (weight × sub-score).
- ARV discount +12.5/15.0
- Cash flow +10.8/30.0
- Schools +4.7/10.0
- Rent growth +3.8/5.0
- DSCR +3.1/10.0
- Livability +3.0/5.0
- Condition / age +2.5/5.0
- 1% rule +2.3/10.0
- Appreciation +0.0/10.0
$244,900
🖨 Deal sheet (PDF) 📄 Offer letter ✓ Due diligence
Listing remarks
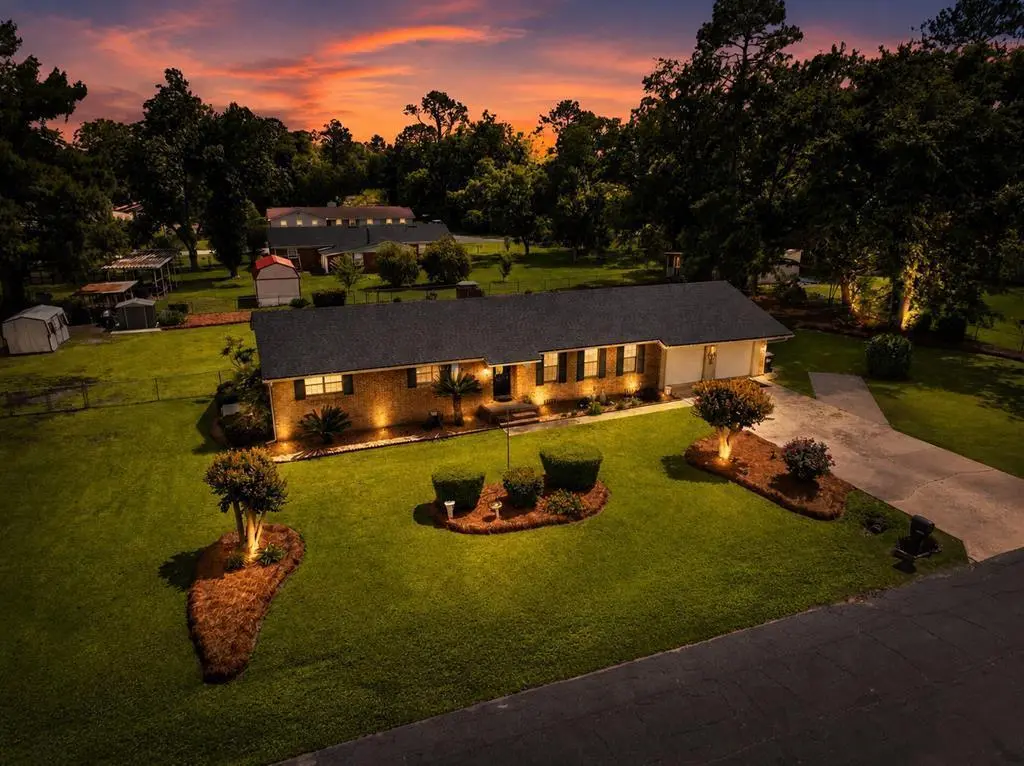
This charming 3 bedroom, 2 bathroom brick home offers the perfect blend of comfort, functionality, and major updates already completed for you. One of the standout features is the heated and cooled enclosed porch, creating the ideal flex space for a home office, media room, playroom, or second living area. The home saw extensive improvements in 2020 including beautifully updated bathrooms, recessed lighting, new interior doors, vinyl plank flooring, a new kitchen stovetop and dishwasher, garage doors, and a sprinkler system. To top it all off, the roof was replaced in 2025, giving buyers peace of mind for years to come. Outside, the beautifully maintained landscaping adds incredible curb ap
Key facts
- Updated bathrooms
- Replaced roof
- Recessed lighting
Tags
Property features AI
Finance
- Other: Subdivision: Academy Acres
Exterior
- Parking: 2-car garage
- Utilities: Septic tank sewer
- Home design: Single-family residence (house); One-story
- Construction: Brick veneer exterior
- Exterior features: Fenced yard; Irregular lot shape
Interior
- Kitchen: Dishwasher; Refrigerator
- Bathrooms: 2 full bathrooms
- Heating & cooling: Heat pump heating; Wall/window unit cooling
- Interior features: Dishwasher; Refrigerator
Neighborhood map
What this means for you Summary
Snapshot
- This is a 3-bed/2.0-bath single-family listed at $245k.
Deal economics
- At list price, monthly cash flow is $-113 ($-1k/yr) — negative.
- To cash-flow at today's rent, offer at most $225k (8.2% below list).
- To meet the 1% rule (rent ≥ 1% of price), the offer needs to be $178k (27.2% below list).
- Recommended offer: $178k (27.2% below list) — sets the bar for 1% rule.
- Cap rate 5.7% vs local median 4.3% in Valdosta — top-decile yield for the area; either an underpriced asset or a hidden risk that comps aren't pricing in. Stress-test before assuming the spread holds.
Location & tenants
- Location reads 60/100 on livability (#392 in GA) — a middle-class / working-renter tenant base. Strengths: cost of living A+, health & safety A+, housing A-; Watch: crime F, amenities F, commute F.
- Lowndes County (rural): math 59% / reading 52% proficiency, ranked #8 of 174 in GA (top 5%) — acceptable for families but not a draw, mixed tenant base, ~2y average lease.
- Zoned schools: Dewar Elementary (math 61% / reading 47%, grade C, #204 of 1,228 statewide, top 17%, 859 students, 50% FRL); Pine Grove Middle School (math 56% / reading 57%, grade B, #48 of 470 statewide, top 10%, 742 students, 50% FRL); Lowndes High School (math 69% / reading 51%, grade C+, #14 of 424 statewide, top 3%, 3,201 students, 39% FRL) — zoned schools at 46% FRL track the district average.
- Market conditions: Rents rising fast (+5.1%/yr); 233 active listings in the ZIP; 15 comparable units currently listed for rent nearby; rentals at typical pace (median 23d on market — plan ~3-4 weeks tenant-placement turnaround); solid renter incomes; 896 units permitted in Lowndes County in 2024 (0 in 5+ unit buildings).
Forward outlook
- Local home prices are declining (-3.0%/yr); year-one equity from $2k of loan paydown is wiped out by about $7k of value loss. Plan a longer hold.
- Lowndes County population projected at +10% by 2050 — modest demand growth; plan on rents tracking national, not racing it.
Negotiation context
- It's been on market 30 days — a 2% lower offer ($241k) is reasonable based on typical stale-listing flexibility.
- 2 sale attempts with the ask held roughly flat each time — persistent listings suggest the price (not the market) is what's stuck; bring a comps-based counter.
- Current owner paid $65k; list at $245k implies a 275% gain — meaningful room to come down on a strong offer.
Risks & watch-outs
- Climate carrying-cost: severe wind risk, 99% chance of damaging wind over 30y; major wildfire risk; extreme-heat days projected 7→19/yr by 2055 (HVAC capex compounding) — expect insurance premiums to compound above CPI over the hold.
Questions for the listing agent
- What do current leases actually rent for vs. the listed asking? Can we see a recent rent roll and the last 12 months of T-12 income?
- Built in 1971 — when were the roof, HVAC, electrical panel, plumbing, and water heater last replaced?
- Is there a deadline driving the sale (1031 exchange, divorce, estate, relocation)? That informs how much negotiation room exists.
- Schools are F-rated, which usually means shorter tenancies and higher turnover. Who's the typical renter profile here, and what's been the actual vacancy rate?
- Crime grade is F in this area — have there been break-ins, vandalism, or insurance claims at this property in the last 3 years? What carrier currently insures it and at what premium?
- The area grade is low — what's the realistic commute time and amenity access for the typical tenant pool here? Any planned neighborhood developments (good or bad) we should know about?
- What's the average days-on-market for RENTAL listings here right now (not sales)? A rising rental-DOM trend means longer vacancies and softer asking-rent achievability than the comps imply.
- What's the recent tenant-quality profile in this submarket — average credit score on applications, eviction rate, late-payment / NSF rate, and stable-employment percentage? A property-management company in the area should have these aggregated.
- How much new for-sale + rental construction is in the pipeline within 1–3 miles? Heavy new supply typically softens prices + rents 12–24 months out; constrained supply supports both.
Investment metrics
- 1% rule
- 0.73% ✗
- Cap rate
- 5.74%
- Cash-on-cash
- -1.98%
- DSCR
- 0.91
- GRM
- 11.5
CMA / ARV
- ARV (median comp)
- $275,603
- List price
- $244,900
- Delta
- -11.14%
- Verdict
- UNDERPRICED
- Comps
- 20 within 1.0 mi
Show comp detail 12 sales within ~0.75 mi
| Address | Dist | Beds/Ba | Sqft | Sold | Price | $/sf | Match |
|---|---|---|---|---|---|---|---|
| 3105 Wallace Dr | 0.11mi | 3/2.0 | 1,662 (-4%) | 4mo | $210,000 | $126 | 86 |
| 3538 Knights Mill Dr | 0.31mi | 3/2.0 | 1,836 (+7%) | 2mo | $335,000 | $182 | 73 |
| 2904 Tara Rd | 0.23mi | 3/2.0 | 1,817 (+6%) | 14mo | $243,500 | $134 | 69 |
| 2928 Sutucka Cir | 0.55mi | 3/2.0 | 1,750 (+2%) | 12mo | $275,900 | $158 | 61 |
| 2917 Willa Dr | 0.26mi | 4/2.0 (+1) | 1,900 (+10%) | 12mo | $349,900 | $184 | 55 |
| 3840 Thoreau Dr | 0.64mi | 3/2.0 | 1,690 (-2%) | 14mo | $248,000 | $147 | 55 |
| 3562 Beulah Cir | 0.62mi | 3/2.0 | 1,470 (-15%) | 3mo | $212,000 | $144 | 44 |
| 3228 Kelsee Cir | 0.57mi | 4/2.0 (+1) | 1,547 (-10%) | 13mo | $250,000 | $162 | 40 |
| 4009 Walden Rd | 0.57mi | 3/2.5 | 1,958 (+14%) | 12mo | $255,000 | $130 | 38 |
| 3863 Thoreau Dr | 0.72mi | 4/2.0 (+1) | 1,960 (+14%) | 1mo | $299,900 | $153 | 38 |
| 5303 Branch Point Dr | 0.61mi | 4/2.0 (+1) | 1,477 (-14%) | 7mo | $234,900 | $159 | 37 |
| 4013 Emerson Way | 0.72mi | 4/2.5 (+1) | 1,960 (+14%) | 9mo | $265,000 | $135 | 29 |
Match score weights: distance 35% · size 25% · config 20% · recency 20%. Top-matched comps best support the ARV.
Projected returns pro-forma
-3.0% appreciation · 5.07% rent growth · sell at horizon
- IRR
- -17.6%
- Equity multiple
- 0.37×
- Total profit
- $-43,194
- Equity at exit
- $36,515
- IRR
- -6.5%
- Equity multiple
- 0.55×
- Total profit
- $-31,013
- Equity at exit
- $21,174
Cash invested: $68,572 (down + closing). Projections, not guarantees.
Landlord ↔ Tenant lean methodology
- Overall (STATE)
- 90 Strongly Landlord-Friendly
- State Georgia
- 90 Strongly Landlord-Friendly · R+3
- County
- — inherits STATE
- City
- — inherits STATE
ZIP-level market 31605
- Home prices YoY
- -11.5%
- Rents YoY
- 5.1%
- Active inventory
- 233
- Price-to-rent
- 11.5×
Monthly cashflow live
- Estimated rent
- $1,782 high interval (Pro) →
- Mortgage (P&I)
- −$1,284
- Tax from tax record
- −$135 /mo · $1,614/yr
- Insurance
- −$102
- HOA
- −$0
- Vacancy / Maint / Mgmt
- −$374
- Net cashflow
- $-113
Break-even live
Sensitivity live
| Price | -10% $25 | -5% $-44 | +0% $-113 | +5% $-183 | +10% $-252 |
|---|---|---|---|---|---|
| Rent | -10% $-254 | -5% $-184 | +0% $-113 | +5% $-43 | +10% $27 |
| Rate | -1.0pp $10 | -0.5pp $-51 | base $-113 | +0.5pp $-177 | +1.0pp $-241 |
UW: 25.0% down · 7.5% · 30yr · 1.5% tax · 5.0% vac · 8.0% maint · 8.0% mgmt
Financing live
Cash to close
- Down payment
- $61,225
- Closing costs
- $7,347
- Reserves months
- —
- Total cash needed
- —
Loan-product check · same deal, 3 products live
Conventional
25% down · 7.5% · 30yr
- Down + closing
- —
- Monthly P&I
- —
- Monthly cashflow
- —
- DSCR
- —
- Eligible?
- —
Personal DTI + credit; lowest rate.
DSCR
20% down · 8.5% · 30yr
- Down + closing
- —
- Monthly P&I
- —
- Monthly cashflow
- —
- DSCR
- —
- Eligible?
- —
No personal income docs; deal must DSCR.
Hard money
10% down · 12.0% · 12mo
- Down + closing
- —
- Monthly P&I
- —
- Monthly cashflow
- —
- DSCR
- —
- Eligible?
- —
Short-term bridge; refi at stabilization.
Rent comps 15 comps
| Address | Beds | Baths | Sqft | Rent | $/sqft | DOM | Units | Dist |
|---|---|---|---|---|---|---|---|---|
| 3028 Academy Dr Valdosta, GA | 3.0 | 2.0 | 1922 | $1,600 | $0.83 | 23d | 1 | 0.29mi |
| 5275 Branch Point Dr Valdosta, GA | 3.0 | 2.0 | 1307 | $2,000 | $1.53 | 23d | 1 | 0.71mi |
| 4220 Wilshire Dr Valdosta, GA | 3.0 | 2.0 | 1207 | $1,400 | $1.16 | 23d | 1 | 0.76mi |
| 4125 Sedgwyck Ln Valdosta, GA | 3.0 | 2.0 | 1234 | $1,350 | $1.09 | 45d | 1 | 0.99mi |
| 4280 Shelby Ln Valdosta, GA | 3.0 | 2.0 | 1700 | $1,700 | $1.00 | 23d | 1 | 0.99mi |
| 5070 Branch Point Dr Valdosta, GA | 4.0–5.0 | 2.0–3.0 | 2190 | $2,188 | $1.00 | 23d | 2 | 1.02mi |
| 2047 Meadow Cove Dr Valdosta, GA | 4.0 | 2.0 | 1892 | $2,100 | $1.11 | 45d | 1 | 1.02mi |
| 5073 Branch Point Dr Valdosta, GA | 3.0 | 2.0 | 1321 | $1,950 | $1.48 | 23d | 1 | 1.04mi |
| 5121 Branch Point Dr Valdosta, GA | 3.0 | 2.0 | 1208 | $1,600 | $1.32 | 23d | 1 | 1.07mi |
| 3822 Edinburg Cir Valdosta, GA | 4.0 | 2.0 | 1635 | $2,100 | $1.28 | 45d | 1 | 1.11mi |
| 4059 Huntley Dr Valdosta, GA | 4.0 | 2.0 | 1965 | $1,925 | $0.98 | 23d | 1 | 1.12mi |
| 3120 Tyndall Dr Valdosta, GA | 3.0 | 3.0 | 1200 | $1,500 | $1.25 | 45d | 1 | 1.28mi |
| 2201 Houston Ave Valdosta, GA | 3.0 | 2.0 | 1090 | $1,375 | $1.26 | 23d | 1 | 1.36mi |
| 3902 Danube Cir Valdosta, GA | 3.0 | 2.0 | 1208 | $1,150 | $0.95 | 45d | 1 | 1.39mi |
| 3905 Heatherwoods Dr Valdosta, GA | 3.0 | 2.0 | 1250 | $1,350 | $1.08 | 23d | 1 | 1.41mi |
Listing history 20 events
-
2026-06-21statusdays on market $244,900 Pending 30 DOM
-
2026-06-19days on market $244,900 Active 29 DOM
-
2026-06-18days on market $244,900 Active 28 DOM
-
2026-06-17days on market $244,900 Active 27 DOM
-
2026-06-16days on market $244,900 Active 26 DOM
-
2026-06-15days on market $244,900 Active 25 DOM
-
2026-06-14days on market $244,900 Active 23 DOM
-
2026-06-13pricedays on market $244,900 Active 22 DOM
-
2026-06-10days on market $249,900 Active 20 DOM
-
2026-06-09days on market $249,900 Active 19 DOM
-
2026-06-08days on market $249,900 Active 18 DOM
-
2026-06-07days on market $249,900 Active 17 DOM
-
2026-06-05days on market $249,900 Active 14 DOM
-
2026-06-03days on market $249,900 Active 13 DOM
-
2026-06-02days on market $249,900 Active 12 DOM
-
2026-06-01days on market $249,900 Active 11 DOM
-
2026-05-31days on market $249,900 Active 10 DOM
-
2026-05-30days on market $249,900 Active 9 DOM
-
2026-05-14$249,900 Active 1038-char remark
-
1995-06-29soldstatus $65,361
ⓘ Source: listings_history table (triggers on properties + properties_extension) + one-shot
backfill from property_details.listing_events for pre-trigger history.
Tax reassessment forecast GA · Resets to sale price
- Current annual tax
- $1,614 · $135/mo
- Projected year-2 tax
- $2,253 · $188/mo
- Expected delta
- +$639/yr (+$53/mo · 39.6%)
ⓘ Screening estimate from a state-policy table — verify with the county assessor before closing.
Climate risk First Street
- Flood 1/10 Low FEMA zone X (unshaded) · 0% chance over 30 yrs
- Wildfire 6/10 Major
- Heat 7/10 Severe 7 d/yr ≥108°F today · 19 d/yr by 30 yrs out
- Wind 8/10 Severe 99% chance of damaging wind over 30 yrs
- Air quality 6/10 Major 12 unhealthy d/yr today · 14 by 30 yrs out
Nearby sold comps map
Loading sold comps map…
Walkable amenities ~0.75 mi
Loading nearby amenities…
Taxation est. · year 1
- Rental income
- $21,380
- − Mortgage interest
- −$13,718
- − Property taxes
- −$1,614
- − Insurance
- −$1,224
- − Repairs & maintenance
- −$1,710
- − Management
- −$1,710
- − Depreciation
- −$7,124
- Taxable loss
- −$5,722
- Est. tax savings @ 24.0%
- +$1,373
- After-tax cash flow
- $13/yr
For passive investors: Depreciation is non-cash, so a rental often shows a tax loss while cash-flowing — sheltering income. Rental losses are passive: they offset passive income freely, and up to $25,000/yr can offset ordinary (W-2) income if you actively participate and your MAGI is under $100k (phasing out to $0 by $150k); unused losses carry forward. On sale, claimed depreciation is recaptured at up to 25%, and gains may owe capital-gains tax (a 1031 exchange can defer both). Figures are a year-1 estimate at your 24.0% rate — not tax advice; consult a CPA.
Schools (NCES district)
- District
- Lowndes County
- NCES district ID
- 1303390
- Math proficiency
- 59% ▼ -1.00%
- Reading proficiency
- 52% ▼ -2.00%
- Median HH income
- $48,221
- Composite
- 47.21/100
- National rank
- #2317
- State rank
- #8 of 174 in GA
Livability — Valdosta
- Score
- 60/100
- State rank
- #392
- US rank
- #19544
Category grades
Schools grade is shown separately in the Schools card above.
Census & demographics
- County
- Lowndes County · 107,801 people
- City population
- 91,859
- Metro
- Valdosta, GA
- Population (ZIP)
- 24,829
- Household income
- $79,156
- Rent vs Own
- Severe rent burden
- 642.0
Population outlook (Lowndes County) Hauer SSP2
- Today (2025)
- 120,348 people
- By 2030
- 123,469 · +2.6%
- By 2040
- 128,482 · +6.8%
- By 2050
- 131,907 · +9.6%
- By 2075
- 139,080 · +15.6%
- By 2100
- 133,649 · +11.1%
Race, ethnicity, and origin ACS 2023
- Neighborhood character
- Diverse neighborhood (Simpson 0.58)
- Race & ethnicity
- White 58% Black 27% Two or more races 7% Hispanic / Latino 7% Asian 2%
- Hispanic origin (detail)
- Mexican 3% Puerto Rican 3%
- Common ancestry
- Italian 2% Slovak 2% Lithuanian 2%
- Foreign-born
- 4% · Canada, South Korea, Vietnam
- Languages at home
- 93% English-only · Spanish 3% German/W. Germanic 1%
Political lean MEDSL · Lowndes
- 2024 margin
- R (+18.0) · D 40.8% · R 58.8%
- 2008→2024 swing
- -8.6pp toward R · 2008: -9.4pp · 2024: -18.0pp
- All cycles
- 2024: R+18.0 2020: R+12.0 2016: R+18.2 2012: R+10.5 2008: R+9.4
Not yet ingested
- Civics
- —
Market trends
- HPI YoY
- ▼ -24.74%
- Current HPI
- 189.8471
- Rent YoY
- ▲ 5.07%
- Metro
- Valdosta, GA
- State GDP YoY
- ▲ 2.66%
- F500 in state
- 28
Industry mix (Fortune 500 HQ in GA)
| Industry | F500 HQs | Revenue |
|---|---|---|
| Paper / Packaging | 2 | $29B |
|
||
| Retail | 1 | $160B |
|
||
| Transportation / Logistics | 1 | $91B |
|
||
| Airlines | 1 | $62B |
|
||
| Consumer Goods | 1 | $47B |
|
||
| Utilities | 1 | $25B |
|
||
Price history
+274.7% since first listed5 events — show timeline
- 2026-06-11 Price Changed $244,900 SGMLS
- 2026-05-28 Relisted — SGMLS
- 2026-05-21 Pending — SGMLS
- 2026-05-14 Listed $249,900 SGMLS
- 1995-06-29 Sold (Public Records) $65,361 Public Records
Property tax history
+4.1%/yrLatest (2025): $1,614 · +5.0% YoY. Source: county tax records.
Cash-flow waterfall
monthlySold comps — $/sqft
last 12 mo · ≤1 miLoading sold comps…