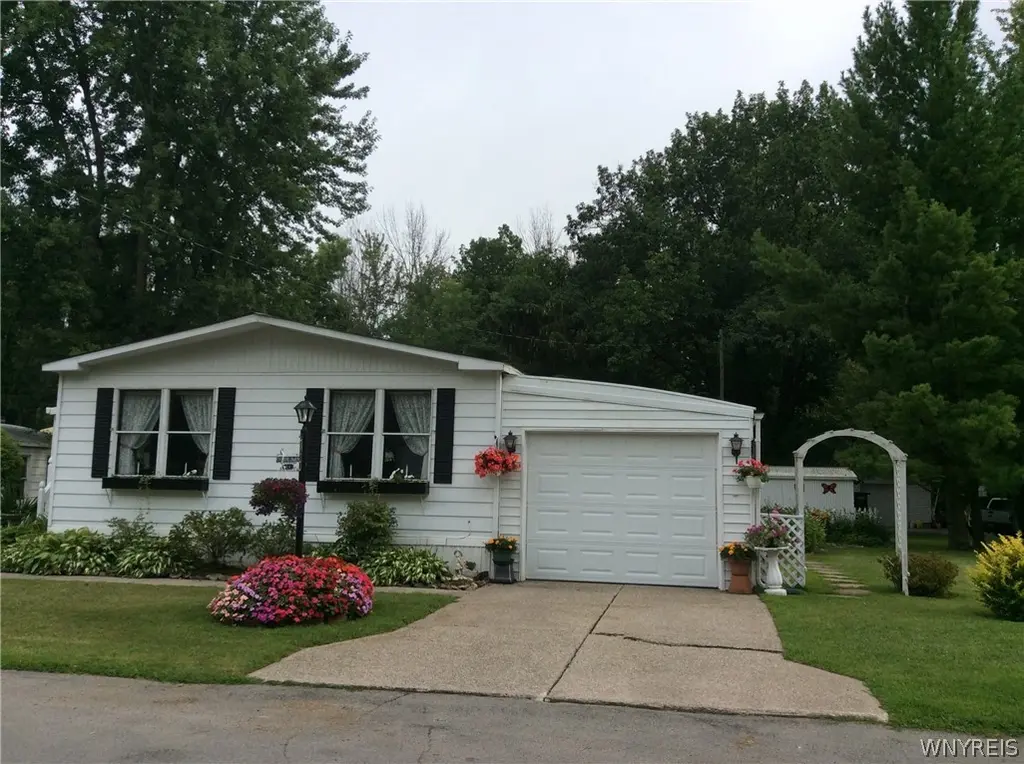
64 Aspen St · Clarence, NY
Flood risk 1/10 · Minimal
- FEMA flood zone
- X (unshaded)
- Chance of flooding over 30 yrs
- 0.0%
- Est. flood insurance / yr
- $507 – $1,088
Fire risk 1/10 · Minimal
- Est. fire insurance / yr
- $691 – $1,283
Heat risk 2/10 · Minimal
- Hot days now (above 93°F)
- 7 days/yr
- Hot days in 30 yrs
- 15 days/yr
Wind risk 1/10 · Minimal
- Chance of severe wind over 30 yrs
- —
Air-quality risk 2/10 · Minimal
- Unhealthy air days now
- 1 days/yr
- Unhealthy air days in 30 yrs
- 2 days/yr
Risk factors via First Street. Map © Google.
Why this score? — see what drove the B grade
The composite is a weighted blend of 9 inputs, each scored 0–100. Each bar is that input's sub-score; the figure is the points it added to the 100-point composite (weight × sub-score).
- Cash flow +30.0/30.0
- 1% rule +10.0/10.0
- DSCR +10.0/10.0
- ARV discount +6.8/15.0
- Schools +6.5/10.0
- Livability +3.2/5.0
- Rent growth +2.5/5.0
- Condition / age +2.2/5.0
- Appreciation +0.0/10.0
$64,900
🖨 Deal sheet (PDF) 📄 Offer letter ✓ Due diligence
Listing remarks MLS
Well-maintained and spacious 3-bedroom, 1-bath home in a 55+ community situated on a large, private corner lot. Enjoy the bright and inviting sunroom, filled with natural light from an abundance of windows and doors—truly living up to its name. With no neighbors behind or on one side, you’ll appreciate the peaceful setting surrounded by mature trees and natural landscape—perfect for relaxing with your morning coffee or evening tea. Inside, the home features cathedral ceilings and beautiful natural woodwork throughout the main open living areas, creating a warm and airy atmosphere. The generously sized kitchen offers ample cabinetry and comes fully equipped with all appliances, making it both functional and convenient. Updates include new furnace in Aug. 2020, new roof in Oct. 2021 , and new hot water tank in Dec. 2025
Key facts
- Garage
- Built 1978
- Listed 59 days
Neighborhood map
What this means for you Summary
Snapshot
- This is a 3-bed/1.0-bath manufactured listed at $65k. Condition is rated fair.
Deal economics
- At list price, monthly cash flow is $427 ($5k/yr) — positive.
- The deal already cash-flows at list — no discount required.
- Meets the 1% rule at list price ($1k rent vs $65k).
- Recommended offer: $63k (3.0% below list) — sets the bar for market timing.
- Cap rate 14.2% vs local median 1.3% in Clarence — top-decile yield for the area; either an underpriced asset or a hidden risk that comps aren't pricing in. Stress-test before assuming the spread holds.
Location & tenants
- Location reads 65/100 on livability (#707 in NY) — a middle-class / working-renter tenant base. Strengths: schools A+, crime A+, housing A+; Watch: cost of living D+, amenities F, commute F.
- Clarence Central School District (suburban): math 70% / reading 76% proficiency, ranked #94 of 590 in NY (top 16%) — strong family-tenant draw, lease renewals of 3-5y typical; only 7% free/reduced lunch — higher-income household profile.
- Market conditions: 85 active listings in the ZIP; 1,244 units permitted in Erie County in 2024 (563 in 5+ unit buildings).
Forward outlook
- Local home prices are declining (-3.0%/yr); year-one equity from $449 of loan paydown is wiped out by about $2k of value loss. Plan a longer hold.
- At projected returns (-3.0% appreciation + 3.0% rent growth), your $18k cash investment doubles in ~5 years — after that, you're playing with house money.
Negotiation context
- It's been on market 60 days — a 3% lower offer ($63k) is reasonable based on typical stale-listing flexibility.
Questions for the listing agent
- It's been on market 60 days. Have you received any prior offers? Is the seller open to a 3% concession, seller financing, or rate buy-down credit?
- Have any recent inspections been done? Can we get a copy of the seller's disclosures and any deferred-maintenance estimates?
- Built in 1978 — when were the roof, HVAC, electrical panel, plumbing, and water heater last replaced?
- Is there a deadline driving the sale (1031 exchange, divorce, estate, relocation)? That informs how much negotiation room exists.
- Schools are A-rated — typically a magnet for longer-tenancy family renters. What's the average tenant stay here, and is there a school-zone premium baked into asking?
- What's the average days-on-market for RENTAL listings here right now (not sales)? A rising rental-DOM trend means longer vacancies and softer asking-rent achievability than the comps imply.
- What's the recent tenant-quality profile in this submarket — average credit score on applications, eviction rate, late-payment / NSF rate, and stable-employment percentage? A property-management company in the area should have these aggregated.
- How much new for-sale + rental construction is in the pipeline within 1–3 miles? Heavy new supply typically softens prices + rents 12–24 months out; constrained supply supports both.
Investment metrics
- 1% rule
- 1.71% ✓
- Cap rate
- 14.19%
- Cash-on-cash
- 28.20%
- DSCR
- 2.25
- GRM
- 4.9
CMA / ARV
- ARV (median comp)
- $63,845
- List price
- $64,900
- Delta
- 1.65%
- Verdict
- FAIR
- Comps
- 4 within 1.0 mi
Show comp detail 6 sales within ~0.75 mi
| Address | Dist | Beds/Ba | Sqft | Sold | Price | $/sf | Match |
|---|---|---|---|---|---|---|---|
| 14 Quarry Hl | 0.12mi | 3/1.0 | 1,248 (+8%) | 6mo | $52,900 | $42 | 76 |
| 182 Quarry Hill Ests | 0.12mi | 3/2.0 | 1,056 (-8%) | 10mo | $77,000 | $73 | 68 |
| 136 Quarry Hill Ests | 0.12mi | 2/2.0 (-1) | 1,000 (-13%) | 1mo | $72,000 | $72 | 62 |
| — | 0.05mi | 3/2.0 | 1,056 (-8%) | 22mo | $60,000 | $57 | 61 |
| 181 Quarry Hl | 0.11mi | 2/1.0 (-1) | 980 (-15%) | 11mo | $38,900 | $40 | 56 |
| 110 Quarry Hl | 0.14mi | 2/1.5 (-1) | 980 (-15%) | 14mo | $12,500 | $13 | 50 |
Match score weights: distance 35% · size 25% · config 20% · recency 20%. Top-matched comps best support the ARV.
Projected returns pro-forma
-3.0% appreciation · 3.0% rent growth · sell at horizon
- IRR
- 22.4%
- Equity multiple
- 1.92×
- Total profit
- $16,694
- Equity at exit
- $9,677
- IRR
- 30.4%
- Equity multiple
- 3.73×
- Total profit
- $49,622
- Equity at exit
- $5,611
Cash invested: $18,172 (down + closing). Projections, not guarantees.
Landlord ↔ Tenant lean methodology
- Overall (STATE)
- 15 Strongly Tenant-Friendly
- State New York
- 15 Strongly Tenant-Friendly · D+10
- County
- — inherits STATE
- City
- — inherits STATE
ZIP-level market 14001
- Home prices YoY
- -7.1%
- Active inventory
- 85
- Price-to-rent
- 4.9×
Monthly cashflow live
- Estimated rent
- $1,108 medium interval (Pro) →
- Mortgage (P&I)
- −$340
- Tax est. 1.5%
- −$81 /mo · $974/yr
- Insurance
- −$27
- HOA
- −$0
- Vacancy / Maint / Mgmt
- −$233
- Net cashflow
- $427
Break-even live
Sensitivity live
| Price | -10% $472 | -5% $449 | +0% $427 | +5% $405 | +10% $382 |
|---|---|---|---|---|---|
| Rent | -10% $339 | -5% $383 | +0% $427 | +5% $471 | +10% $515 |
| Rate | -1.0pp $460 | -0.5pp $443 | base $427 | +0.5pp $410 | +1.0pp $393 |
UW: 25.0% down · 7.5% · 30yr · 1.5% tax · 5.0% vac · 8.0% maint · 8.0% mgmt
Financing live
Cash to close
- Down payment
- $16,225
- Closing costs
- $1,947
- Reserves months
- —
- Total cash needed
- —
Loan-product check · same deal, 3 products live
Conventional
25% down · 7.5% · 30yr
- Down + closing
- —
- Monthly P&I
- —
- Monthly cashflow
- —
- DSCR
- —
- Eligible?
- —
Personal DTI + credit; lowest rate.
DSCR
20% down · 8.5% · 30yr
- Down + closing
- —
- Monthly P&I
- —
- Monthly cashflow
- —
- DSCR
- —
- Eligible?
- —
No personal income docs; deal must DSCR.
Hard money
10% down · 12.0% · 12mo
- Down + closing
- —
- Monthly P&I
- —
- Monthly cashflow
- —
- DSCR
- —
- Eligible?
- —
Short-term bridge; refi at stabilization.
Listing history 16 events
-
2026-06-21days on market $64,900 Active 60 DOM
-
2026-06-18days on market $64,900 Active 57 DOM
-
2026-06-17days on market $64,900 Active 56 DOM
-
2026-06-16days on market $64,900 Active 55 DOM
-
2026-06-15days on market $64,900 Active 54 DOM
-
2026-06-13days on market $64,900 Active 52 DOM
-
2026-06-13days on market $64,900 Active 51 DOM
-
2026-06-10days on market $64,900 Active 49 DOM
-
2026-06-09days on market $64,900 Active 48 DOM
-
2026-06-08days on market $64,900 Active 47 DOM
-
2026-06-07days on market $64,900 Active 46 DOM
-
2026-06-03days on market $64,900 Active 42 DOM
-
2026-06-02days on market $64,900 Active 41 DOM
-
2026-06-01days on market $64,900 Active 40 DOM
-
2026-05-31days on market $64,900 Active 39 DOM
-
2026-04-23$67,900 Active 849-char remark
Show marketing remark (849 chars)
Well-maintained and spacious 3-bedroom, 1-bath home in a 55+ community situated on a large, private corner lot. Enjoy the bright and inviting sunroom, filled with natural light from an abundance of windows and doors—truly living up to its name. With no neighbors behind or on one side, you’ll appreciate the peaceful setting surrounded by mature trees and natural landscape—perfect for relaxing with your morning coffee or evening tea. Inside, the home features cathedral ceilings and beautiful natural woodwork throughout the main open living areas, creating a warm and airy atmosphere. The generously sized kitchen offers ample cabinetry and comes fully equipped with all appliances, making it both functional and convenient. Updates include new furnace in Aug. 2020, new roof in Oct. 2021 , and new hot water tank in Dec. 2025
ⓘ Source: listings_history table (triggers on properties + properties_extension) + one-shot
backfill from property_details.listing_events for pre-trigger history.
Climate risk First Street
- Flood 1/10 Low FEMA zone X (unshaded) · 0% chance over 30 yrs
- Wildfire 1/10 Low
- Heat 2/10 Low 7 d/yr ≥93°F today · 15 d/yr by 30 yrs out
- Wind 1/10 Low
- Air quality 2/10 Low 1 unhealthy d/yr today · 2 by 30 yrs out
Nearby sold comps map
Loading sold comps map…
Walkable amenities ~0.75 mi
Loading nearby amenities…
Taxation est. · year 1
- Rental income
- $13,299
- − Mortgage interest
- −$3,635
- − Property taxes
- −$974
- − Insurance
- −$324
- − Repairs & maintenance
- −$1,064
- − Management
- −$1,064
- − Depreciation
- −$1,888
- Taxable income
- $4,349
- Est. tax owed @ 24.0%
- −$1,044
- After-tax cash flow
- $4,080/yr
For passive investors: Depreciation is non-cash, so a rental often shows a tax loss while cash-flowing — sheltering income. Rental losses are passive: they offset passive income freely, and up to $25,000/yr can offset ordinary (W-2) income if you actively participate and your MAGI is under $100k (phasing out to $0 by $150k); unused losses carry forward. On sale, claimed depreciation is recaptured at up to 25%, and gains may owe capital-gains tax (a 1031 exchange can defer both). Figures are a year-1 estimate at your 24.0% rate — not tax advice; consult a CPA.
Condition & rehab AI · 2 photos
A well-maintained 3-bedroom mobile home with average exterior and interior conditions, offering a peaceful setting in a 55+ community. Simple exterior updates can significantly boost its resale and rental value.
Value-add opportunities
- Both Paint exterior — Enhances curb appeal and resale value
- Both Trim bushes — Improves landscaping and enhances curb appeal
Renovation cost estimate screening
Value-add ROI direction
- Both Paint exterior — Enhances curb appeal and resale value ↑
- Both Trim bushes — Improves landscaping and enhances curb appeal ↑
ⓘ Cost ranges are severity-bucket heuristics (US national rule-of-thumb). Get contractor quotes + a written scope before underwriting a rehab budget.
Schools (NCES district)
- District
- Clarence Central School District
- NCES district ID
- 3607590
- Math proficiency
- 70% ▼ -9.00%
- Reading proficiency
- 76% ▲ 2.00%
- Median HH income
- $81,568
- Composite
- 64.85/100
- National rank
- #514
- State rank
- #94 of 590 in NY
Livability — Clarence
- Score
- 65/100
- State rank
- #707
- US rank
- #13415
Category grades
Schools grade is shown separately in the Schools card above.
Census & demographics
- Population (ZIP)
- 9,122
Population outlook (Erie County) Hauer SSP2
- Today (2025)
- 933,037 people
- By 2030
- 935,181 · +0.2%
- By 2040
- 928,531 · -0.5%
- By 2050
- 905,725 · -2.9%
- By 2075
- 834,037 · -10.6%
- By 2100
- 708,033 · -24.1%
Race, ethnicity, and origin ACS 2023
- Neighborhood character
- Predominantly White (91%)
- Race & ethnicity
- White 91% Hispanic / Latino 5% Two or more races 4%
- Hispanic origin (detail)
- Mexican 1% Puerto Rican 2% Dominican 2%
- Common ancestry
- Romanian 21% Slovak 3% Lithuanian 2%
- Foreign-born
- 2% · Canada
- Languages at home
- 97% English-only · Spanish 2%
Political lean MEDSL · Erie
- 2024 margin
- Lean D (+9.7) · D 54.8% · R 45.2%
- 2008→2024 swing
- -7.9pp toward R · 2008: 17.5pp · 2024: 9.7pp
- All cycles
- 2024: D+9.7 2020: D+14.7 2016: D+4.8 2012: D+15.6 2008: D+17.5
Not yet ingested
- Civics
- —
Market trends
- HPI YoY
- ▼ -24.68%
- Current HPI
- 322.1897
- Rent YoY
- —
- Metro
- —
- State GDP YoY
- ▲ 2.60%
- F500 in state
- 92
Industry mix (Fortune 500 HQ in NY)
| Industry | F500 HQs | Revenue |
|---|---|---|
| Financial Services | 10 | $950B |
|
||
| Consumer Goods | 9 | $162B |
|
||
| Insurance | 4 | $225B |
|
||
| Telecommunications | 2 | $144B |
|
||
| Pharmaceuticals | 2 | $112B |
|
||
| Media / Entertainment | 2 | $69B |
|
||
Price history
1 event — show timeline
- 2026-04-23 Listed $67,900 WNYREIS
Cash-flow waterfall
monthlySold comps — $/sqft
last 12 mo · ≤1 miLoading sold comps…