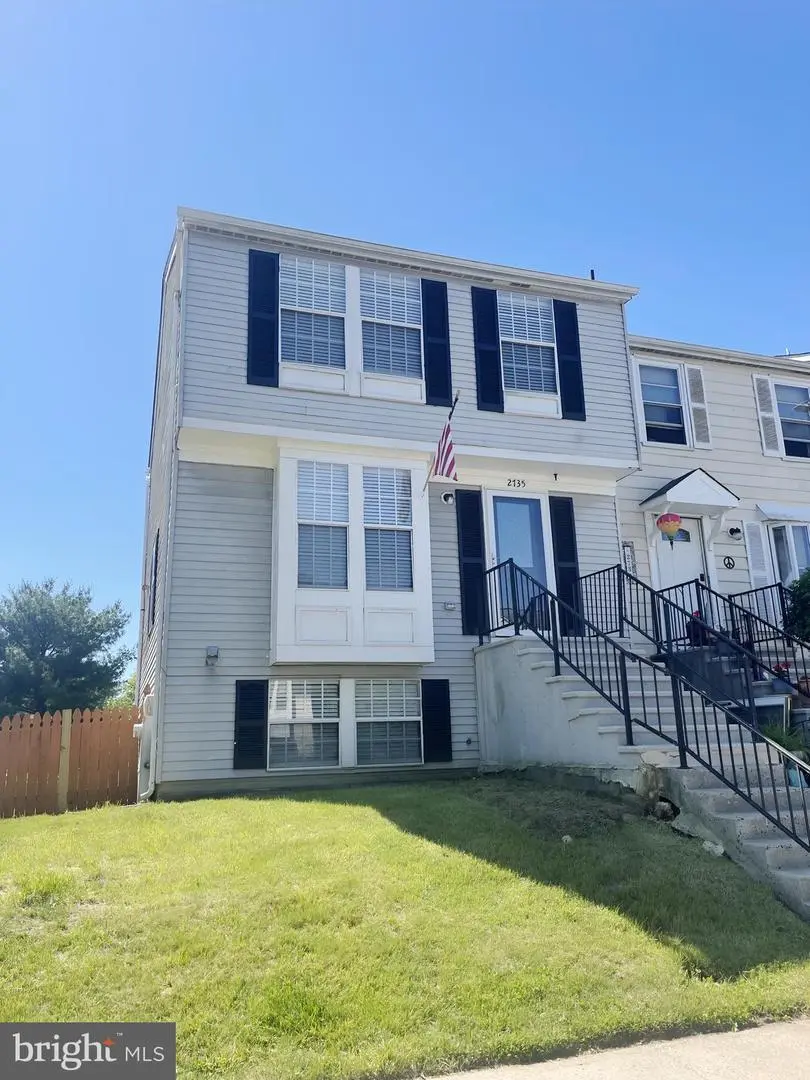
2735 Beckon Dr · Edgewood, MD
Flood risk 7/10 · Major
- FEMA flood zone
- X (unshaded)
- Chance of flooding over 30 yrs
- 0.99%
- Est. flood insurance / yr
- $473 – $860
Fire risk 2/10 · Minimal
- Est. fire insurance / yr
- $755 – $1,403
Heat risk 8/10 · Major
- Hot days now (above 104°F)
- 7 days/yr
- Hot days in 30 yrs
- 15 days/yr
Wind risk 6/10 · Moderate
- Chance of severe wind over 30 yrs
- 27.0%
Air-quality risk 4/10 · Minor
- Unhealthy air days now
- 4 days/yr
- Unhealthy air days in 30 yrs
- 6 days/yr
Risk factors via First Street. Map © Google.
Why this score? — see what drove the D- grade
The composite is a weighted blend of 9 inputs, each scored 0–100. Each bar is that input's sub-score; the figure is the points it added to the 100-point composite (weight × sub-score).
- Cash flow +14.7/30.0
- DSCR +4.5/10.0
- Rent growth +3.7/5.0
- Livability +3.7/5.0
- ARV discount +3.4/15.0
- 1% rule +3.3/10.0
- Schools +2.9/10.0
- Condition / age +2.5/5.0
- Appreciation +0.0/10.0
$275,000
🖨 Deal sheet (PDF) 📄 Offer letter ✓ Due diligence
Listing remarks MLS
End of group townhome in West Shore! Three finished levels * Eat in kitchen with stainless steel appliances. Family room with wood burning fireplace, full bath 4th bedroom/den and slider that leads to patio, fenced yard and deck. Roof approximately 5 years old. Schedule your showing today!
Key facts
- Built-in wet bar
- Ceramic backsplash
- Fenced rear yard
Tags
Property features AI
Finance
- Other: Property manager present; Not in a federal flood zone; Pets allowed (cats and dogs); Below-grade finished living area (estimated 500); Above-grade finished area reported by assessor
- HOA & community: HOA fee of $46.66 quarterly; HOA fees include common area maintenance
Exterior
- Parking: One assigned parking space; On-street parking available; Assigned parking
- Utilities: Public water; Public sewer
- Home design: End of row townhouse; Fee simple ownership; Property in good condition; Effective year of major renovation: 2023
- Construction: Vinyl siding; Asphalt roof; Other foundation type; Originally built (year source: assessor)
- Exterior features: Rear fencing; Deck(s); Patio(s); Corner property that backs to open common area; Walkout lower level
Interior
- Kitchen: Built-in microwave; Stainless steel appliances; Oven/Range - Electric; Refrigerator; Dishwasher; Exhaust fan; Butler's pantry (additional prep/storage space)
- Bedrooms: Three bedrooms on the upper level; One bedroom on the lower level
- Flooring: Carpet; Ceramic tile; Luxury vinyl tile
- Bathrooms: Two full bathrooms (one on upper level, one on lower level)
- Heating & cooling: Heat pump heating; Central air conditioning; Electric heating and cooling components; Electric hot water
- Interior features: Attic; Ceiling fans; Combination dining and living area; Traditional floor plan; Pantry; Recessed lighting; 2nd kitchen; Walk-in shower in bathroom; Built-in shelving/cabinetry; Butler's pantry; Combination kitchen and dining
- Laundry & utility: Washer; Dryer
Neighborhood map
What this means for you Summary
Snapshot
- This is a 4-bed/1.0-bath townhouse listed at $275k.
Deal economics
- At list price, monthly cash flow is $13 ($161/yr) — positive.
- The deal already cash-flows at list — no discount required.
- To meet the 1% rule (rent ≥ 1% of price), the offer needs to be $228k (17.0% below list).
- Recommended offer: $228k (17.0% below list) — sets the bar for 1% rule.
- Cap rate 6.6% vs local median 5.5% in Edgewood — meaningfully above typical; check what's discounted (condition, days-on-market, listing class) to confirm the premium yield is real.
Location & tenants
- Location reads 73/100 on livability (#118 in MD, #4,991 nationally) — a middle-class / working-renter tenant base. Strengths: commute A+, housing A+, health & safety A+; Watch: amenities D, crime F.
- Harford County Public Schools (suburban): math 22% / reading 39% proficiency, ranked #9 of 24 in MD (top 38%) — families likely to look elsewhere, expect single-tenant / working-renter base with shorter leases.
- Zoned schools: Deerfield Elementary (math 7% / reading 17%, grade F, #550 of 860 statewide, top 66%, 728 students, 78% FRL); Edgewood Middle (math 7% / reading 31%, grade F, #155 of 225 statewide, top 70%, 999 students, 72% FRL); Edgewood High (math 43% / reading 54%, grade D, #111 of 222 statewide, top 50%, 1,415 students, 62% FRL) — zoned schools average 71% FRL vs 24% district-wide (46 pts higher); higher-poverty schools than district average — tighter screening recommended.
- Market conditions: Rents rising fast (+4.9%/yr); 95 active listings in the ZIP; 11 comparable units currently listed for rent nearby; rentals lingering (median 46d on market — plan ~5-8 weeks vacancy on turnover, expect pricing pressure); 64% of comp listings sitting > 30 days — soft ceiling on asking rent; solid renter incomes; 803 units permitted in Harford County in 2024 (26 in 5+ unit buildings).
- This rent runs 34% of the median local income ($82k/yr) — at the standard rent-burdened threshold; future hikes will face affordability resistance.
Forward outlook
- Local home prices are declining (-3.0%/yr); year-one equity from $2k of loan paydown is wiped out by about $8k of value loss. Plan a longer hold.
Negotiation context
- Only 9 days on market — expect competitive offers; lowballing is unlikely to land.
- 9 sale attempts since 27y ago with the ask held roughly flat each time — persistent listings suggest the price (not the market) is what's stuck; bring a comps-based counter.
- Current owner paid $200k; 38% above their basis — modest negotiation headroom, anchor on the comps not their cost.
Risks & watch-outs
- Watch-outs: flood insurance adds $56/mo.
- Climate carrying-cost: major flood risk; major wind risk, 27% chance of damaging wind over 30y; extreme-heat days projected 7→15/yr by 2055 (HVAC capex compounding) — expect insurance premiums to compound above CPI over the hold.
Questions for the listing agent
- What's the actual annual flood-insurance premium (NFIP or private), and is the property in a SFHA with mandatory coverage?
- What does the HOA fee cover, when was the last increase, and are there any pending special assessments or reserve-fund shortfalls?
- Is there a deadline driving the sale (1031 exchange, divorce, estate, relocation)? That informs how much negotiation room exists.
- Schools are D-rated, which usually means shorter tenancies and higher turnover. Who's the typical renter profile here, and what's been the actual vacancy rate?
- Crime grade is F in this area — have there been break-ins, vandalism, or insurance claims at this property in the last 3 years? What carrier currently insures it and at what premium?
- The area grade is low — what's the realistic commute time and amenity access for the typical tenant pool here? Any planned neighborhood developments (good or bad) we should know about?
- What's the average days-on-market for RENTAL listings here right now (not sales)? A rising rental-DOM trend means longer vacancies and softer asking-rent achievability than the comps imply.
- What's the recent tenant-quality profile in this submarket — average credit score on applications, eviction rate, late-payment / NSF rate, and stable-employment percentage? A property-management company in the area should have these aggregated.
- How much new for-sale + rental construction is in the pipeline within 1–3 miles? Heavy new supply typically softens prices + rents 12–24 months out; constrained supply supports both.
Investment metrics
- 1% rule
- 0.83% ✗
- Cap rate
- 6.59%
- Cash-on-cash
- 1.07%
- DSCR
- 1.05
- GRM
- 10.0
CMA / ARV
- ARV (on-the-fly)
- $251,856
- Comps found
- 3
Show comp detail 3 sales within ~0.75 mi
| Address | Dist | Beds/Ba | Sqft | Sold | Price | $/sf | Match |
|---|---|---|---|---|---|---|---|
| 2811 Beckon Dr | 0.11mi | 4/1.5 | 1,440 (+13%) | 13mo | $285,000 | $198 | 60 |
| 925 Pirates Ct | 0.18mi | 3/3.0 (-1) | 1,461 (+15%) | 3mo | $270,000 | $185 | 51 |
| 2715 Beckon Dr | 0.05mi | 3/3.0 (-1) | 1,435 (+13%) | 21mo | $288,900 | $201 | 46 |
Match score weights: distance 35% · size 25% · config 20% · recency 20%. Top-matched comps best support the ARV.
Projected returns pro-forma
-3.0% appreciation · 4.92% rent growth · sell at horizon
- IRR
- -14.0%
- Equity multiple
- 0.49×
- Total profit
- $-39,249
- Equity at exit
- $41,003
- IRR
- -2.5%
- Equity multiple
- 0.82×
- Total profit
- $-14,040
- Equity at exit
- $23,777
Cash invested: $77,000 (down + closing). Projections, not guarantees.
Landlord ↔ Tenant lean methodology
- Overall (STATE)
- 27 Tenant-Leaning
- State Maryland
- 27 Tenant-Leaning · D+14
- County
- — inherits STATE
- City
- — inherits STATE
ZIP-level market 21040
- Home prices YoY
- -29.4%
- Rents YoY
- 4.9%
- Active inventory
- 95
- Price-to-rent
- 10.0×
Monthly cashflow live
- Estimated rent
- $2,282 high interval (Pro) →
- Mortgage (P&I)
- −$1,442
- Tax from tax record
- −$162 /mo · $1,949/yr
- Insurance
- −$115
- Flood insurance flood zone
- −$56 /mo · $666/yr
- HOA
- −$15
- Vacancy / Maint / Mgmt
- −$479
- Net cashflow
- $13
Break-even live
Sensitivity live
| Price | -10% $169 | -5% $91 | +0% $13 | +5% $-64 | +10% $-142 |
|---|---|---|---|---|---|
| Rent | -10% $-167 | -5% $-77 | +0% $13 | +5% $104 | +10% $194 |
| Rate | -1.0pp $152 | -0.5pp $83 | base $13 | +0.5pp $-58 | +1.0pp $-130 |
UW: 25.0% down · 7.5% · 30yr · 1.5% tax · 5.0% vac · 8.0% maint · 8.0% mgmt
Financing live
Cash to close
- Down payment
- $68,750
- Closing costs
- $8,250
- Reserves months
- —
- Total cash needed
- —
Loan-product check · same deal, 3 products live
Conventional
25% down · 7.5% · 30yr
- Down + closing
- —
- Monthly P&I
- —
- Monthly cashflow
- —
- DSCR
- —
- Eligible?
- —
Personal DTI + credit; lowest rate.
DSCR
20% down · 8.5% · 30yr
- Down + closing
- —
- Monthly P&I
- —
- Monthly cashflow
- —
- DSCR
- —
- Eligible?
- —
No personal income docs; deal must DSCR.
Hard money
10% down · 12.0% · 12mo
- Down + closing
- —
- Monthly P&I
- —
- Monthly cashflow
- —
- DSCR
- —
- Eligible?
- —
Short-term bridge; refi at stabilization.
Rent comps 11 comps
| Address | Beds | Baths | Sqft | Rent | $/sqft | DOM | Units | Dist |
|---|---|---|---|---|---|---|---|---|
| 1046 Agate Dr Unit 1 Edgewood, MD | 4.0 | 2.5 | 1440 | $2,150 | $1.49 | 19d | 1 | 0.09mi |
| 2828 Beckon Dr Edgewood, MD | 3.0 | 2.5 | 1764 | $2,300 | $1.30 | 45d | 1 | 0.20mi |
| 2842 Beckon Dr Unit 1 Edgewood, MD | 4.0 | 1.5 | 1296 | $2,100 | $1.62 | 45d | 1 | 0.23mi |
| 3184 Ebbtide Dr Edgewood, MD | 3.0 | 3.0 | 1224 | $2,600 | $2.12 | 22d | 1 | 0.79mi |
| 3184 Ebbtide Dr Edgewood, MD | 3.0 | 3.0 | 1224 | $2,600 | $2.12 | 45d | 1 | 0.79mi |
| 619 Hartwood Ln Edgewood, MD | 4.0 | 1.5 | 1716 | $2,300 | $1.34 | 45d | 1 | 0.84mi |
| 2816 Profitt Path Edgewood, MD | 4.0 | 3.0 | 1660 | $2,900 | $1.75 | 45d | 1 | 1.04mi |
| 2120 Cedar Dr Apt F Edgewood, MD | 3.0 | 1.5 | 1000 | $1,295 | $1.29 | 45d | 1 | 1.24mi |
| 313 Winterberry Dr Edgewood, MD | 3.0 | 2.5 | 1798 | $2,095 | $1.17 | 22d | 1 | 1.25mi |
| 1857 Simons Ct Edgewood, MD | 3.0 | 1.5 | 1240 | $1,700 | $1.37 | 45d | 1 | 1.36mi |
| 705 Bayberry Rd Edgewood, MD | 3.0 | 1.5 | 1657 | $2,600 | $1.57 | 19d | 1 | 1.36mi |
HOA detail
- Monthly dues
- $15 · $180/yr
Listing history 7 events
-
2026-06-21days on market $275,000 Active 9 DOM
-
2026-06-18days on market $275,000 Active 6 DOM
-
2026-06-17days on market $275,000 Active 5 DOM
-
2026-06-16days on market $275,000 Active 4 DOM
-
2026-06-15days on market $275,000 Active 3 DOM
-
2026-06-13remarks 699-char remark
-
2026-06-13$275,000 Active 1 DOM
ⓘ Source: listings_history table (triggers on properties + properties_extension) + one-shot
backfill from property_details.listing_events for pre-trigger history.
Tax reassessment forecast MD · Partial reset (capped growth)
- Current annual tax
- $1,949 · $162/mo
- Projected year-2 tax
- $2,473 · $206/mo
- Expected delta
- +$524/yr (+$44/mo · 26.9%)
ⓘ Screening estimate from a state-policy table — verify with the county assessor before closing.
Climate risk First Street
- Flood 7/10 Severe FEMA zone X (unshaded) · 99% chance over 30 yrs
- Wildfire 2/10 Low
- Heat 8/10 Severe 7 d/yr ≥104°F today · 15 d/yr by 30 yrs out
- Wind 6/10 Major 27% chance of damaging wind over 30 yrs
- Air quality 4/10 Moderate 4 unhealthy d/yr today · 6 by 30 yrs out
Nearby sold comps map
Loading sold comps map…
Walkable amenities ~0.75 mi
Loading nearby amenities…
Taxation est. · year 1
- Rental income
- $27,388
- − Mortgage interest
- −$15,404
- − Property taxes
- −$1,949
- − Insurance
- −$2,042
- − Repairs & maintenance
- −$2,191
- − Management
- −$2,191
- − HOA
- −$180
- − Depreciation
- −$8,000
- Taxable loss
- −$4,569
- Est. tax savings @ 24.0%
- +$1,096
- After-tax cash flow
- $1,257/yr
For passive investors: Depreciation is non-cash, so a rental often shows a tax loss while cash-flowing — sheltering income. Rental losses are passive: they offset passive income freely, and up to $25,000/yr can offset ordinary (W-2) income if you actively participate and your MAGI is under $100k (phasing out to $0 by $150k); unused losses carry forward. On sale, claimed depreciation is recaptured at up to 25%, and gains may owe capital-gains tax (a 1031 exchange can defer both). Figures are a year-1 estimate at your 24.0% rate — not tax advice; consult a CPA.
Schools (NCES district)
- District
- Harford County Public Schools
- NCES district ID
- 2400390
- Math proficiency
- 22% ▼ -23.00%
- Reading proficiency
- 39% ▼ -12.00%
- Median HH income
- $79,569
- Composite
- 29.38/100
- National rank
- #6527
- State rank
- #9 of 24 in MD
Livability — Edgewood
- Score
- 73/100
- State rank
- #118
- US rank
- #4991
Category grades
Schools grade is shown separately in the Schools card above.
Census & demographics
- Census place
- Edgewood, MD
- County
- Harford County · 198,512 people
- City population
- 24,960
- Metro
- Baltimore-Columbia-Towson, MD
- Population (ZIP)
- 24,960
- Household income
- $81,704
- Rent vs Own
- Severe rent burden
- 859.0
Population outlook (Harford County) Hauer SSP2
- Today (2025)
- 262,292 people
- By 2030
- 266,437 · +1.6%
- By 2040
- 269,954 · +2.9%
- By 2050
- 265,659 · +1.3%
- By 2075
- 252,886 · -3.6%
- By 2100
- 224,014 · -14.6%
Race, ethnicity, and origin ACS 2023
- Neighborhood character
- Diverse neighborhood (Simpson 0.66)
- Race & ethnicity
- Black 45% White 36% Two or more races 11% Hispanic / Latino 10% Asian 2%
- Hispanic origin (detail)
- Mexican 1% Puerto Rican 2%
- Common ancestry
- Romanian 4% Slovak 1% Italian 1%
- Foreign-born
- 8% · Canada, South Korea
- Languages at home
- 89% English-only · Spanish 5% Russian/Polish/Slavic 2% German/W. Germanic 1%
Political lean MEDSL · Harford
- 2024 margin
- R (+13.8) · D 41.9% · R 55.7% · Other 2.4%
- 2008→2024 swing
- +5.0pp toward D · 2008: -18.8pp · 2024: -13.8pp
- All cycles
- 2024: R+13.8 2020: R+12.0 2016: R+24.5 2012: R+19.5 2008: R+18.8
Not yet ingested
- Civics
- —
Market trends
- HPI YoY
- ▼ -106.14%
- Current HPI
- 254.2305
- Rent YoY
- ▲ 4.92%
- Metro
- Baltimore-Columbia-Towson, MD
- State GDP YoY
- ▲ 2.97%
- F500 in state
- 12
Industry mix (Fortune 500 HQ in MD)
| Industry | F500 HQs | Revenue |
|---|---|---|
| Aerospace / Defense | 1 | $71B |
|
||
| Utilities | 1 | $25B |
|
||
| Hotels | 1 | $24B |
|
||
| Consumer Goods | 1 | $7B |
|
||
| Real Estate | 1 | $6B |
|
||
| Chemicals | 1 | $2B |
|
||
Price history
+233.3% since first listed34 events — show timeline
- 2026-06-12 Listed $275,000 BRIGHT MLS
- 2026-01-23 Rental Removed $2,089 Tricon
- 2026-01-21 Price Changed $2,089 Tricon
- 2026-01-14 Price Changed $2,039 Tricon
- 2025-11-25 Listed for Rent $1,999 Tricon
- 2021-06-07 Sold (Public Records) $200,000 Public Records
- 2021-03-25 Sold (MLS) $200,000 BRIGHT MLS
- 2021-03-04 Relisted — BRIGHT MLS
- 2021-03-03 Listing Removed — BRIGHT MLS
- 2021-02-28 Listed $189,900 BRIGHT MLS
- 2014-06-18 Sold (Public Records) $106,800 Public Records
- 2014-06-11 Delisted — MRIS
- 2014-06-06 Sold (MLS) $106,800 BRIGHT MLS
- 2014-06-06 Sold (MLS) $106,800 MRIS
- 2014-03-17 Pending — MRIS
- 2014-03-17 Listing Removed — BRIGHT MLS
- 2014-02-24 Price Changed $105,000 MRIS
- 2014-01-28 Relisted — MRIS
- 2014-01-28 Price Changed $110,000 MRIS
- 2013-09-30 Pending — MRIS
- 2013-09-12 Price Changed $100,000 MRIS
- 2013-08-30 Price Changed $110,000 MRIS
- 2013-08-21 Price Changed $120,000 MRIS
- 2013-08-14 Listed $130,000 MRIS
- 2013-08-13 Listed $105,000 BRIGHT MLS
- 2000-08-23 Sold (Public Records) $95,000 Public Records
- 2000-08-15 Sold (MLS) $95,000 MRIS
- 2000-07-01 Delisted — MRIS
- 2000-04-28 Listed $94,900 MRIS
- 2000-04-13 Delisted — MRIS
- 1999-09-24 Listed — MRIS
- 1990-11-01 Sold (Public Records) $85,535 Public Records
- 1990-07-31 Sold (Public Records) $174,900 Public Records
- 1990-07-31 Sold (Public Records) $82,500 Public Records
Property tax history
+2.2%/yrLatest (2025): $1,949 · +27.5% YoY. Source: county tax records.
Cash-flow waterfall
monthlySold comps — $/sqft
last 12 mo · ≤1 miLoading sold comps…