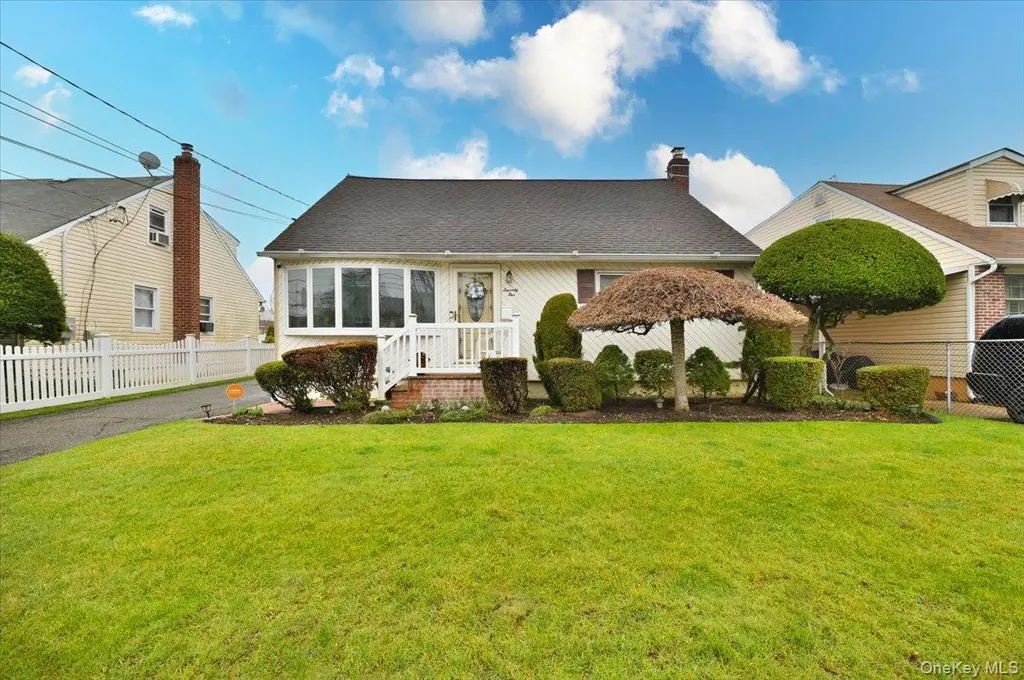
75 Beebe Ave · Hempstead, NY
Flood risk 1/10 · Minimal
- FEMA flood zone
- X (unshaded)
- Chance of flooding over 30 yrs
- 0.0%
- Est. flood insurance / yr
- $473 – $860
Fire risk 1/10 · Minimal
- Est. fire insurance / yr
- $691 – $1,283
Heat risk 6/10 · Moderate
- Hot days now (above 96°F)
- 7 days/yr
- Hot days in 30 yrs
- 16 days/yr
Wind risk 6/10 · Moderate
- Chance of severe wind over 30 yrs
- 53.0%
Air-quality risk 4/10 · Minor
- Unhealthy air days now
- 5 days/yr
- Unhealthy air days in 30 yrs
- 8 days/yr
Risk factors via First Street. Map © Google.
Why this score? — see what drove the D+ grade
The composite is a weighted blend of 9 inputs, each scored 0–100. Each bar is that input's sub-score; the figure is the points it added to the 100-point composite (weight × sub-score).
- Cash flow +13.5/30.0
- ARV discount +12.2/15.0
- Schools +5.8/10.0
- DSCR +4.1/10.0
- Livability +4.0/5.0
- Rent growth +2.5/5.0
- Condition / age +2.5/5.0
- 1% rule +2.4/10.0
- Appreciation +0.0/10.0
$599,999
🖨 Deal sheet (PDF) 📄 Offer letter ✓ Due diligence
Listing remarks
This wonderful, well-maintained Cape is a must-see! Move-in ready, this home features 4 bedrooms, 2 full bathrooms, and a spacious full basement. Beautiful hardwood floors flow throughout the open-concept main level, connecting the formal living room, dining room, and updated kitchen with an island perfect for entertaining. The full basement offers incredible bonus space with endless possibilities and includes a Navien boiler system for added efficiency. Enjoy a private backyard, ideal for relaxation or gatherings. Conveniently located near schools, shopping, and transportation, and situated within the Uniondale School District, this property will not last!
Key facts
- Private backyard
- Full basement
- Updated kitchen
Tags
Property features AI
Exterior
- Parking: Driveway
- Utilities: Public sewer; Electricity connected; Natural gas connected; Water connected
- Home design: Single-family residence; Single-story primary living (primary bedroom on main level)
- Construction: Aluminum and vinyl exterior construction
- Exterior features: Aluminum siding; Vinyl siding; Not on waterfront
Interior
- Kitchen: Dishwasher; Electric oven; Microwave; Refrigerator; Stainless steel appliances; Wine refrigerator; Kitchen island; Open kitchen layout
- Bedrooms: 6 total rooms (includes bedrooms and living spaces)
- Bathrooms: 2 full bathrooms
- Heating & cooling: Steam heating; Wall/window air conditioning units
- Interior features: First-floor bedroom; Formal dining room; Kitchen island; Open floor plan; Open kitchen; Primary bedroom on main level; Full basement
- Laundry & utility: Washer; Dryer; Tankless water heater
Neighborhood map
What this means for you Summary
Snapshot
- This is a 4-bed/1.0-bath single-family listed at $600k.
Deal economics
- At list price, monthly cash flow is $19 ($223/yr) — positive.
- The deal already cash-flows at list — no discount required.
- To meet the 1% rule (rent ≥ 1% of price), the offer needs to be $446k (25.7% below list).
- Recommended offer: $446k (25.7% below list) — sets the bar for 1% rule.
- Cap rate 6.3% vs local median 5.1% in Hempstead — meaningfully above typical; check what's discounted (condition, days-on-market, listing class) to confirm the premium yield is real.
Location & tenants
- Location reads 79/100 on livability (#123 in NY, #2,002 nationally) — a middle-class / working-renter tenant base. Strengths: amenities A+, commute A+, health & safety A; Watch: crime C-, cost of living F.
- Uniondale Union Free School District (suburban): math 59% / reading 70% proficiency, ranked #164 of 590 in NY (top 28%) — acceptable for families but not a draw, mixed tenant base, ~2y average lease.
- Zoned schools: Grand Avenue Elementary School (math 44% / reading 54%, grade D, #1,085 of 2,108 statewide, top 56%, 532 students, 57% FRL); Lawrence Road Middle School (math 12% / reading 37%, grade F, #611 of 729 statewide, top 88%, 682 students, 65% FRL); Uniondale High School (math 83% / reading 90%, grade A, #336 of 1,100 statewide, top 31%, 2,080 students, 62% FRL).
- Market conditions: 170 active listings in the ZIP; 7 comparable units currently listed for rent nearby; rentals at typical pace (median 27d on market — plan ~3-4 weeks tenant-placement turnaround); 43% of comp listings sitting > 30 days — soft ceiling on asking rent; solid renter incomes; 824 units permitted in Nassau County in 2024 (153 in 5+ unit buildings).
- At $4,459/mo this rent would consume 58% of the median local household income ($93k/yr) (locally 2535% of renters already pay >50% of income on rent) — very limited rent-growth headroom before tenants either downsize or default.
Forward outlook
- Local home prices are declining (-3.0%/yr); year-one equity from $4k of loan paydown is wiped out by about $18k of value loss. Plan a longer hold.
- Nassau County population projected at +7% by 2050 — modest demand growth; plan on rents tracking national, not racing it.
Negotiation context
- It's been on market 15 days — a 2% lower offer ($591k) is reasonable based on typical stale-listing flexibility.
Risks & watch-outs
- Watch-outs: built in 1950 — expect roof / HVAC / electrical / plumbing capex.
- Climate carrying-cost: major wind risk, 53% chance of damaging wind over 30y; extreme-heat days projected 7→16/yr by 2055 (HVAC capex compounding) — expect insurance premiums to compound above CPI over the hold.
Questions for the listing agent
- Built in 1950 — when were the roof, HVAC, electrical panel, plumbing, and water heater last replaced?
- Is there a deadline driving the sale (1031 exchange, divorce, estate, relocation)? That informs how much negotiation room exists.
- Schools are D-rated, which usually means shorter tenancies and higher turnover. Who's the typical renter profile here, and what's been the actual vacancy rate?
- The area grade is low — what's the realistic commute time and amenity access for the typical tenant pool here? Any planned neighborhood developments (good or bad) we should know about?
- What's the average days-on-market for RENTAL listings here right now (not sales)? A rising rental-DOM trend means longer vacancies and softer asking-rent achievability than the comps imply.
- What's the recent tenant-quality profile in this submarket — average credit score on applications, eviction rate, late-payment / NSF rate, and stable-employment percentage? A property-management company in the area should have these aggregated.
- How much new for-sale + rental construction is in the pipeline within 1–3 miles? Heavy new supply typically softens prices + rents 12–24 months out; constrained supply supports both.
Investment metrics
- 1% rule
- 0.74% ✗
- Cap rate
- 6.33%
- Cash-on-cash
- 0.13%
- DSCR
- 1.01
- GRM
- 11.2
CMA / ARV
- ARV (on-the-fly)
- $669,438
- Comps found
- 12
Show comp detail 12 sales within ~0.75 mi
| Address | Dist | Beds/Ba | Sqft | Sold | Price | $/sf | Match |
|---|---|---|---|---|---|---|---|
| 34 Heath Pl | 0.09mi | 4/2.0 | 1,294 (-7%) | 2mo | $640,000 | $495 | 79 |
| 248 Kennedy Ave | 0.14mi | 3/2.0 (-1) | 1,474 (+6%) | 3mo | $740,000 | $502 | 72 |
| 48 Cliff Ave | 0.36mi | 4/1.0 | 1,289 (-7%) | 2mo | $454,000 | $352 | 70 |
| 269 Windsor Pkwy | 0.25mi | 3/1.0 (-1) | 1,500 (+8%) | 4mo | $620,000 | $413 | 66 |
| 34 Frazier St | 0.42mi | 3/1.5 (-1) | 1,472 (+6%) | 2mo | $480,000 | $326 | 62 |
| 578 Irene St | 0.53mi | 3/2.0 (-1) | 1,343 (-3%) | 4mo | $660,000 | $491 | 58 |
| 45 Alabama Ave | 0.71mi | 4/2.0 | 1,344 (-3%) | 1mo | $485,000 | $361 | 58 |
| 141 Brown Ave | 0.31mi | 4/3.0 | 1,541 (+11%) | 4mo | $744,600 | $483 | 56 |
| 138 Windsor Pkwy | 0.29mi | 3/3.0 (-1) | 1,242 (-10%) | 1mo | $735,000 | $592 | 55 |
| 891 School Dr | 0.54mi | 3/2.5 (-1) | 1,451 (+5%) | 3mo | $677,000 | $467 | 53 |
| 54 W Marshall St | 0.69mi | 3/1.5 (-1) | 1,472 (+6%) | 2mo | $475,000 | $323 | 49 |
| 1139 Webber Ave | 0.63mi | 3/2.0 (-1) | 1,224 (-12%) | 4mo | $709,000 | $579 | 39 |
Match score weights: distance 35% · size 25% · config 20% · recency 20%. Top-matched comps best support the ARV.
Projected returns pro-forma
-3.0% appreciation · 3.0% rent growth · sell at horizon
- IRR
- -16.2%
- Equity multiple
- 0.43×
- Total profit
- $-96,370
- Equity at exit
- $89,462
- IRR
- -7.9%
- Equity multiple
- 0.50×
- Total profit
- $-83,724
- Equity at exit
- $51,877
Cash invested: $168,000 (down + closing). Projections, not guarantees.
Landlord ↔ Tenant lean methodology
- Overall (STATE)
- 15 Strongly Tenant-Friendly
- State New York
- 15 Strongly Tenant-Friendly · D+10
- County
- — inherits STATE
- City
- — inherits STATE
ZIP-level market 11550
- Active inventory
- 170
- Price-to-rent
- 11.2×
Monthly cashflow live
- Estimated rent
- $4,459 high interval (Pro) →
- Mortgage (P&I)
- −$3,146
- Tax from tax record
- −$107 /mo · $1,289/yr
- Insurance
- −$250
- HOA
- −$0
- Vacancy / Maint / Mgmt
- −$936
- Net cashflow
- $19
Break-even live
Sensitivity live
| Price | -10% $358 | -5% $188 | +0% $19 | +5% $-151 | +10% $-1,039 |
|---|---|---|---|---|---|
| Rent | -10% $-334 | -5% $-158 | +0% $19 | +5% $195 | +10% $371 |
| Rate | -1.0pp $321 | -0.5pp $171 | base $19 | +0.5pp $-137 | +1.0pp $-295 |
UW: 25.0% down · 7.5% · 30yr · 1.5% tax · 5.0% vac · 8.0% maint · 8.0% mgmt
Financing live
Cash to close
- Down payment
- $150,000
- Closing costs
- $18,000
- Reserves months
- —
- Total cash needed
- —
Loan-product check · same deal, 3 products live
Conventional
25% down · 7.5% · 30yr
- Down + closing
- —
- Monthly P&I
- —
- Monthly cashflow
- —
- DSCR
- —
- Eligible?
- —
Personal DTI + credit; lowest rate.
DSCR
20% down · 8.5% · 30yr
- Down + closing
- —
- Monthly P&I
- —
- Monthly cashflow
- —
- DSCR
- —
- Eligible?
- —
No personal income docs; deal must DSCR.
Hard money
10% down · 12.0% · 12mo
- Down + closing
- —
- Monthly P&I
- —
- Monthly cashflow
- —
- DSCR
- —
- Eligible?
- —
Short-term bridge; refi at stabilization.
Rent comps 7 comps
| Address | Beds | Baths | Sqft | Rent | $/sqft | DOM | Units | Dist |
|---|---|---|---|---|---|---|---|---|
| 54 Kane Ave Hempstead, NY | 5.0 | 2.0 | 1750 | $4,800 | $2.74 | 45d | 1 | 0.37mi |
| 533 Greenwich St Unit 1D Hempstead, NY | 3.0 | 2.0 | 1103 | $4,000 | $3.63 | 45d | 1 | 0.49mi |
| 366 Greenwich St Hempstead, NY | 3.0 | 1.5 | 1504 | $3,900 | $2.59 | 1d | 1 | 0.59mi |
| 12 Elm Ave Unit 1 Hempstead, NY | 3.0 | 1.0 | 970 | $3,500 | $3.61 | 21d | 1 | 0.86mi |
| 523 Hawthorne Ave Uniondale, NY | 3.0 | 1.0 | 1328 | $3,300 | $2.48 | 26d | 1 | 1.09mi |
| 529 Maple Ave Unit Second Floor Uniondale, NY | 3.0 | 2.0 | 1240 | $3,750 | $3.02 | 26d | 1 | 1.25mi |
| 20 Ingraham Ln Hempstead, NY | 3.0 | 1.0 | 950 | $3,150 | $3.32 | 45d | 1 | 1.35mi |
Listing history 10 events
-
2026-06-17status $599,999 Pending 15 DOM
-
2026-06-09days on market $599,999 Active 15 DOM
-
2026-06-08days on market $599,999 Active 14 DOM
-
2026-06-07days on market $599,999 Active 13 DOM
-
2026-06-04days on market $599,999 Active 10 DOM
-
2026-06-03days on market $599,999 Active 9 DOM
-
2026-06-02days on market $599,999 Active 8 DOM
-
2026-06-02status $599,999 Active 7 DOM
-
2026-04-27status Pending
-
2026-04-06$599,999 Active
ⓘ Source: listings_history table (triggers on properties + properties_extension) + one-shot
backfill from property_details.listing_events for pre-trigger history.
Tax reassessment forecast NY · Partial reset (capped growth)
- Current annual tax
- $1,289 · $107/mo
- Projected year-2 tax
- $5,715 · $476/mo
- Expected delta
- +$4,425/yr (+$369/mo · 343.2%)
ⓘ Screening estimate from a state-policy table — verify with the county assessor before closing.
Climate risk First Street
- Flood 1/10 Low FEMA zone X (unshaded) · 0% chance over 30 yrs
- Wildfire 1/10 Low
- Heat 6/10 Major 7 d/yr ≥96°F today · 16 d/yr by 30 yrs out
- Wind 6/10 Major 53% chance of damaging wind over 30 yrs
- Air quality 4/10 Moderate 5 unhealthy d/yr today · 8 by 30 yrs out
Nearby sold comps map
Loading sold comps map…
Walkable amenities ~0.75 mi
Loading nearby amenities…
Taxation est. · year 1
- Rental income
- $53,506
- − Mortgage interest
- −$33,609
- − Property taxes
- −$1,289
- − Insurance
- −$3,000
- − Repairs & maintenance
- −$4,280
- − Management
- −$4,280
- − Depreciation
- −$17,455
- Taxable loss
- −$10,408
- Est. tax savings @ 24.0%
- +$2,498
- After-tax cash flow
- $2,721/yr
For passive investors: Depreciation is non-cash, so a rental often shows a tax loss while cash-flowing — sheltering income. Rental losses are passive: they offset passive income freely, and up to $25,000/yr can offset ordinary (W-2) income if you actively participate and your MAGI is under $100k (phasing out to $0 by $150k); unused losses carry forward. On sale, claimed depreciation is recaptured at up to 25%, and gains may owe capital-gains tax (a 1031 exchange can defer both). Figures are a year-1 estimate at your 24.0% rate — not tax advice; consult a CPA.
Schools (NCES district)
- District
- Uniondale Union Free School District
- NCES district ID
- 3629280
- Math proficiency
- 59% ▲ 8.00%
- Reading proficiency
- 70% ▲ 17.00%
- Median HH income
- $78,596
- Composite
- 57.5/100
- National rank
- #1071
- State rank
- #164 of 590 in NY
Livability — Hempstead
- Score
- 79/100
- State rank
- #123
- US rank
- #2002
Category grades
Schools grade is shown separately in the Schools card above.
Census & demographics
- Census place
- Hempstead, NY
- County
- Nassau County · 653,051 people
- City population
- 60,960
- Metro
- New York-Newark-Jersey City, NY-NJ-PA
- Population (ZIP)
- 60,960
- Household income
- $92,677
- Rent vs Own
- Severe rent burden
- 2535.0
Population outlook (Nassau County) Hauer SSP2
- Today (2025)
- 1,409,302 people
- By 2030
- 1,431,482 · +1.6%
- By 2040
- 1,471,607 · +4.4%
- By 2050
- 1,502,845 · +6.6%
- By 2075
- 1,575,403 · +11.8%
- By 2100
- 1,554,356 · +10.3%
Race, ethnicity, and origin ACS 2023
- Neighborhood character
- Diverse neighborhood (Simpson 0.62)
- Race & ethnicity
- Hispanic / Latino 44% Black 43% Two or more races 14% White 7% Asian 2%
- Hispanic origin (detail)
- Mexican 1% Puerto Rican 3% Dominican 4%
- Common ancestry
- Hispanic 4%
- Foreign-born
- 37% · Canada, Jamaica
- Languages at home
- 53% English-only · Spanish 40% French/Haitian/Cajun 4% Other Indo-European 1%
Political lean MEDSL · Nassau
- 2024 margin
- Toss-up / Even · D 47.9% · R 52.1%
- 2008→2024 swing
- -12.6pp toward R · 2008: 8.4pp · 2024: -4.2pp
- All cycles
- 2024: R+4.2 2020: D+9.5 2016: D+5.3 2012: D+6.7 2008: D+8.4
Not yet ingested
- Civics
- —
Market trends
- HPI YoY
- ▼ -297.72%
- Current HPI
- 339.055
- Rent YoY
- —
- Metro
- New York-Newark-Jersey City, NY-NJ-PA
- State GDP YoY
- ▲ 2.60%
- F500 in state
- 92
Industry mix (Fortune 500 HQ in NY)
| Industry | F500 HQs | Revenue |
|---|---|---|
| Financial Services | 10 | $950B |
|
||
| Consumer Goods | 9 | $162B |
|
||
| Insurance | 4 | $225B |
|
||
| Telecommunications | 2 | $144B |
|
||
| Pharmaceuticals | 2 | $112B |
|
||
| Media / Entertainment | 2 | $69B |
|
||
Price history
2 events — show timeline
- 2026-04-27 Pending — OneKey® MLS as Distributed by MLS Grid
- 2026-04-06 Listed $599,999 OneKey® MLS as Distributed by MLS Grid
Property tax history
-6.8%/yrLatest (2024): $1,289 · +75.9% YoY. Source: county tax records.
Cash-flow waterfall
monthlySold comps — $/sqft
last 12 mo · ≤1 miLoading sold comps…