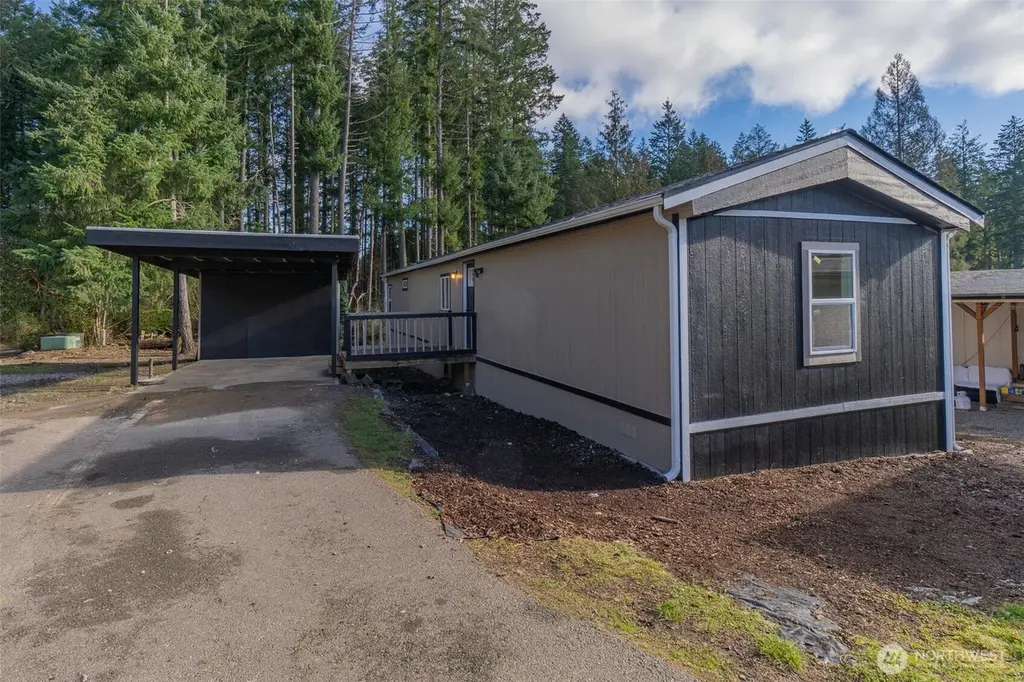
9111 66th Ave NW #108 · Rosedale, WA
Flood risk 1/10 · Minimal
- FEMA flood zone
- X (unshaded)
- Chance of flooding over 30 yrs
- 0.0%
- Est. flood insurance / yr
- $507 – $1,088
Fire risk 1/10 · Minimal
- Est. fire insurance / yr
- $604 – $1,122
Heat risk 3/10 · Minor
- Hot days now (above 87°F)
- 7 days/yr
- Hot days in 30 yrs
- 13 days/yr
Wind risk 1/10 · Minimal
- Chance of severe wind over 30 yrs
- —
Air-quality risk 10/10 · Severe
- Unhealthy air days now
- 18 days/yr
- Unhealthy air days in 30 yrs
- 28 days/yr
Risk factors via First Street. Map © Google.
Why this score? — see what drove the B+ grade
The composite is a weighted blend of 9 inputs, each scored 0–100. Each bar is that input's sub-score; the figure is the points it added to the 100-point composite (weight × sub-score).
- Cash flow +30.0/30.0
- ARV discount +13.3/15.0
- 1% rule +10.0/10.0
- DSCR +10.0/10.0
- Schools +6.0/10.0
- Condition / age +4.0/5.0
- Livability +3.2/5.0
- Rent growth +2.5/5.0
- Appreciation +0.0/10.0
$109,000
🖨 Deal sheet 📄 Offer letter ✓ Due diligence
Listing remarks
Welcome to 9111 66th Ave NW #108, a beautifully updated home located in a well-established Gig Harbor community. This move-in ready residence features a new roof, all-new drywall, and luxury vinyl plank flooring throughout. The remodeled kitchen showcases quartz countertops and new appliances, while both bathrooms have been tastefully updated for a modern feel. The functional floor plan offers comfortable living with easy access to shopping, dining, parks, and all that Gig Harbor has to offer. An excellent opportunity for affordable, updated living in a convenient location. Park is for all ages.
Key facts
- New drywall
- Quartz countertops
- Remodeled kitchen
Tags
Neighborhood map
What this means for you Summary
Snapshot
- This is a 3-bed/2.0-bath manufactured listed at $109k. Condition is rated good.
Deal economics
- At list price, monthly cash flow is $1k ($18k/yr) — positive.
- The deal already cash-flows at list — no discount required.
- Meets the 1% rule at list price ($3k rent vs $109k).
- Recommended offer: $96k (12.0% below list) — sets the bar for market timing.
Location & tenants
- Location reads 63/100 on livability (#397 in WA) — a middle-class / working-renter tenant base. Strengths: crime A+, employment A+, housing A+; Watch: health & safety C-, schools F, amenities F.
- Peninsula School District (suburban): math 61% / reading 72% proficiency, ranked #21 of 291 in WA (top 7%) — acceptable for families but not a draw, mixed tenant base, ~2y average lease; only 19% free/reduced lunch — higher-income household profile.
- Market conditions: 212 active listings in the ZIP; 1 comparable units currently listed for rent nearby; high-income renter base; 3,209 units permitted in Pierce County in 2024 (1,269 in 5+ unit buildings).
Forward outlook
- Local home prices are declining (-3.0%/yr); year-one equity from $754 of loan paydown is wiped out by about $3k of value loss. Plan a longer hold.
- Pierce County population projected at +26% by 2050 — long-run rental-demand tailwind backs the buy-and-hold thesis.
- At projected returns (-3.0% appreciation + 3.0% rent growth), your $31k cash investment doubles in ~2 years — after that, you're playing with house money.
Negotiation context
- It's been on market 126 days — a 12% lower offer ($96k) is reasonable based on typical stale-listing flexibility.
- Current owner paid $70k; list at $109k implies a 56% gain — meaningful room to come down on a strong offer.
Questions for the listing agent
- It's been on market 126 days. Have you received any prior offers? Is the seller open to a 12% concession, seller financing, or rate buy-down credit?
- Why hasn't it sold? Are there any deal-killer items the seller is aware of (foundation, flood, title, zoning, code violations)?
- Is there a deadline driving the sale (1031 exchange, divorce, estate, relocation)? That informs how much negotiation room exists.
- Schools are F-rated, which usually means shorter tenancies and higher turnover. Who's the typical renter profile here, and what's been the actual vacancy rate?
- What's the average days-on-market for RENTAL listings here right now (not sales)? A rising rental-DOM trend means longer vacancies and softer asking-rent achievability than the comps imply.
- What's the recent tenant-quality profile in this submarket — average credit score on applications, eviction rate, late-payment / NSF rate, and stable-employment percentage? A property-management company in the area should have these aggregated.
- How much new for-sale + rental construction is in the pipeline within 1–3 miles? Heavy new supply typically softens prices + rents 12–24 months out; constrained supply supports both.
Investment metrics
- 1% rule
- 2.50% ✓
- Cap rate
- 22.52%
- Cash-on-cash
- 57.95%
- DSCR
- 3.58
- GRM
- 3.3
CMA / ARV
- ARV (median comp)
- $125,000
- List price
- $109,000
- Delta
- -12.80%
- Verdict
- UNDERPRICED
- Comps
- 7 within 1.0 mi
Show comp detail 7 sales within ~0.75 mi
| Address | Dist | Beds/Ba | Sqft | Sold | Price | $/sf | Match |
|---|---|---|---|---|---|---|---|
| 9111 66th Ave NW #121 | 0.00mi | 3/2.0 | 924 (0%) | 4mo | $49,500 | $54 | 96 |
| 9111 66th Ave NW #126 | 0.00mi | 2/2.0 (-1) | 955 (+3%) | 1mo | $134,000 | $140 | 89 |
| 9111 66th Ave NW #112 | 0.00mi | 3/1.0 | 910 (-2%) | 11mo | $42,500 | $47 | 85 |
| 9111 66th Ave NW #118 | 0.00mi | 3/2.0 | 1,004 (+9%) | 5mo | $125,000 | $125 | 82 |
| 6616 87th St NW | 0.29mi | 2/2.0 (-1) | 960 (+4%) | 7mo | $425,000 | $443 | 69 |
| 9111 66th Ave NW #103 | 0.00mi | 2/1.0 (-1) | 865 (-6%) | 19mo | $75,000 | $87 | 64 |
| 7025 87th St NW | 0.45mi | 2/1.0 (-1) | 924 (0%) | 19mo | $289,000 | $313 | 54 |
Match score weights: distance 35% · size 25% · config 20% · recency 20%. Top-matched comps best support the ARV.
Projected returns pro-forma
-3.0% appreciation · 3.0% rent growth · sell at horizon
- IRR
- 56.5%
- Equity multiple
- 3.50×
- Total profit
- $76,209
- Equity at exit
- $16,252
- IRR
- 61.4%
- Equity multiple
- 7.13×
- Total profit
- $187,218
- Equity at exit
- $9,424
Cash invested: $30,520 (down + closing). Projections, not guarantees.
Landlord ↔ Tenant lean methodology
- Overall (STATE)
- 28 Tenant-Leaning
- State Washington
- 28 Tenant-Leaning · D+8
- County
- — inherits STATE
- City
- — inherits STATE
ZIP-level market 98332
- Active inventory
- 212
- Price-to-rent
- 3.3×
Monthly cashflow live
- Estimated rent
- $2,720 medium interval (Pro) →
- Mortgage (P&I)
- −$572
- Tax from tax record
- −$58 /mo · $697/yr
- Insurance
- −$45
- HOA
- −$0
- Vacancy / Maint / Mgmt
- −$571
- Net cashflow
- $1,474
Break-even live
UW: 25.0% down · 7.5% · 30yr · 1.5% tax · 5.0% vac · 8.0% maint · 8.0% mgmt
Financing live
Cash to close
- Down payment
- $27,250
- Closing costs
- $3,270
- Reserves months
- —
- Total cash needed
- —
Loan-product check · same deal, 3 products live
Conventional
25% down · 7.5% · 30yr
- Down + closing
- —
- Monthly P&I
- —
- Monthly cashflow
- —
- DSCR
- —
- Eligible?
- —
Personal DTI + credit; lowest rate.
DSCR
20% down · 8.5% · 30yr
- Down + closing
- —
- Monthly P&I
- —
- Monthly cashflow
- —
- DSCR
- —
- Eligible?
- —
No personal income docs; deal must DSCR.
Hard money
10% down · 12.0% · 12mo
- Down + closing
- —
- Monthly P&I
- —
- Monthly cashflow
- —
- DSCR
- —
- Eligible?
- —
Short-term bridge; refi at stabilization.
Rent comps 1 comps
| Address | Beds | Baths | Sqft | Rent | $/sqft | DOM | Units | Dist |
|---|---|---|---|---|---|---|---|---|
| 8306 94th St NW Unit A Gig Harbor, WA | 2.0 | 1.0 | 900 | $2,650 | $2.94 | 2d | 1 | 1.12mi |
Listing history 19 events
-
2026-06-18days on market $109,000 Active 126 DOM
-
2026-06-17days on market $109,000 Active 125 DOM
-
2026-06-16days on market $109,000 Active 124 DOM
-
2026-06-15days on market $109,000 Active 123 DOM
-
2026-06-13days on market $109,000 Active 121 DOM
-
2026-06-09days on market $109,000 Active 117 DOM
-
2026-06-08days on market $109,000 Active 116 DOM
-
2026-06-07days on market $109,000 Active 115 DOM
-
2026-06-04days on market $109,000 Active 112 DOM
-
2026-06-03days on market $109,000 Active 111 DOM
-
2026-06-02days on market $109,000 Active 110 DOM
-
2026-06-01days on market $109,000 Active 109 DOM
-
2026-05-31days on market $109,000 Active 108 DOM
-
2026-05-02price $109,000
-
2026-04-21price $118,000
-
2026-03-31price $128,950
-
2026-02-13price $134,990
-
2026-02-12$118,000 Active
-
2025-07-01soldstatus $70,000
ⓘ Source: listings_history table (triggers on properties + properties_extension) + one-shot
backfill from property_details.listing_events for pre-trigger history.
Tax reassessment forecast WA · Resets to sale price
- Current annual tax
- $697 · $58/mo
- Projected year-2 tax
- $1,068 · $89/mo
- Expected delta
- +$372/yr (+$31/mo · 53.3%)
ⓘ Screening estimate from a state-policy table — verify with the county assessor before closing.
Climate risk First Street
- Flood 1/10 Low FEMA zone X (unshaded) · 0% chance over 30 yrs
- Wildfire 1/10 Low
- Heat 3/10 Moderate 7 d/yr ≥87°F today · 13 d/yr by 30 yrs out
- Wind 1/10 Low
- Air quality 10/10 Extreme 18 unhealthy d/yr today · 28 by 30 yrs out
Nearby sold comps map
Loading sold comps map…
Walkable amenities ~0.75 mi
Loading nearby amenities…
Taxation est. · year 1
- Rental income
- $32,644
- − Mortgage interest
- −$6,106
- − Property taxes
- −$697
- − Insurance
- −$545
- − Repairs & maintenance
- −$2,612
- − Management
- −$2,612
- − Depreciation
- −$3,171
- Taxable income
- $16,903
- Est. tax owed @ 24.0%
- −$4,057
- After-tax cash flow
- $13,631/yr
For passive investors: Depreciation is non-cash, so a rental often shows a tax loss while cash-flowing — sheltering income. Rental losses are passive: they offset passive income freely, and up to $25,000/yr can offset ordinary (W-2) income if you actively participate and your MAGI is under $100k (phasing out to $0 by $150k); unused losses carry forward. On sale, claimed depreciation is recaptured at up to 25%, and gains may owe capital-gains tax (a 1031 exchange can defer both). Figures are a year-1 estimate at your 24.0% rate — not tax advice; consult a CPA.
Condition & rehab AI · 12 photos
This move-in ready manufactured home is in excellent condition with recent updates, making it an excellent opportunity for affordable, updated living in a convenient location.
Value-add opportunities
- Both Paint exterior siding — Enhances curb appeal and value
- Both Install outdoor lighting — Improves safety and enhances curb appeal
- Both Add a small garden bed — Enhances curb appeal and adds greenery
Renovation cost estimate screening
Value-add ROI direction
- Both Paint exterior siding — Enhances curb appeal and value ↑
- Both Install outdoor lighting — Improves safety and enhances curb appeal ↑
- Both Add a small garden bed — Enhances curb appeal and adds greenery ↑
ⓘ Cost ranges are severity-bucket heuristics (US national rule-of-thumb). Get contractor quotes + a written scope before underwriting a rehab budget.
Schools (NCES district)
- District
- Peninsula School District
- NCES district ID
- 5306690
- Math proficiency
- 61% ▲ 1.00%
- Reading proficiency
- 72% ▼ -1.00%
- Median HH income
- $76,796
- Composite
- 60.35/100
- National rank
- #1718
- State rank
- #21 of 291 in WA
Livability — Rosedale
- Score
- 63/100
- State rank
- #397
- US rank
- #15781
Category grades
Schools grade is shown separately in the Schools card above.
Census & demographics
- Census place
- Rosedale, WA
- County
- Pierce County · 788,257 people
- Metro
- Seattle-Tacoma-Bellevue, WA
- Population (ZIP)
- 20,072
- Household income
- $135,330
- Rent vs Own
- Severe rent burden
- 218.0
Population outlook (Pierce County) Hauer SSP2
- Today (2025)
- 956,648 people
- By 2030
- 1,010,862 · +5.7%
- By 2040
- 1,113,170 · +16.4%
- By 2050
- 1,206,524 · +26.1%
- By 2075
- 1,436,425 · +50.2%
- By 2100
- 1,563,654 · +63.5%
Race, ethnicity, and origin ACS 2023
- Neighborhood character
- Predominantly White (82%)
- Race & ethnicity
- White 82% Two or more races 10% Hispanic / Latino 4% Asian 4% Black 1%
- Common ancestry
- Italian 6% Lithuanian 5% Portuguese 4%
- Foreign-born
- 6% · Canada, South Korea
- Languages at home
- 94% English-only · Spanish 2% Russian/Polish/Slavic 1% Other Asian/Pacific 1%
Political lean MEDSL · Pierce
- 2024 margin
- D (+10.8) · D 53.9% · R 43.1% · Other 3.0%
- 2008→2024 swing
- -1.4pp toward R · 2008: 12.2pp · 2024: 10.8pp
- All cycles
- 2024: D+10.8 2020: D+11.2 2016: D+7.5 2012: D+11.0 2008: D+12.2
Not yet ingested
- Civics
- —
Market trends
- HPI YoY
- ▼ -638.13%
- Current HPI
- 335.5178
- Rent YoY
- —
- Metro
- Seattle-Tacoma-Bellevue, WA
- State GDP YoY
- ▲ 4.65%
- F500 in state
- 22
Industry mix (Fortune 500 HQ in WA)
| Industry | F500 HQs | Revenue |
|---|---|---|
| Retail | 2 | $269B |
|
||
| Technology / Retail | 1 | $638B |
|
||
| Technology | 1 | $245B |
|
||
| Telecommunications | 1 | $38B |
|
||
| Food / Beverage | 1 | $36B |
|
||
| Automotive / Trucks | 1 | $34B |
|
||
Price history
+55.7% since first listed6 events — show timeline
- 2026-05-02 Price Changed $109,000 NWMLS as Distributed by MLS Grid
- 2026-04-21 Price Changed $118,000 NWMLS as Distributed by MLS Grid
- 2026-03-31 Price Changed $128,950 NWMLS as Distributed by MLS Grid
- 2026-02-13 Price Changed $134,990 NWMLS as Distributed by MLS Grid
- 2026-02-12 Listed $118,000 NWMLS as Distributed by MLS Grid
- 2025-07-01 Sold (Public Records) $70,000 Public Records
Property tax history
+3.7%/yrLatest (2026): $697 · +3.7% YoY. Source: county tax records.
Cash-flow waterfall
monthlySold comps — $/sqft
last 12 mo · ≤1 miLoading sold comps…