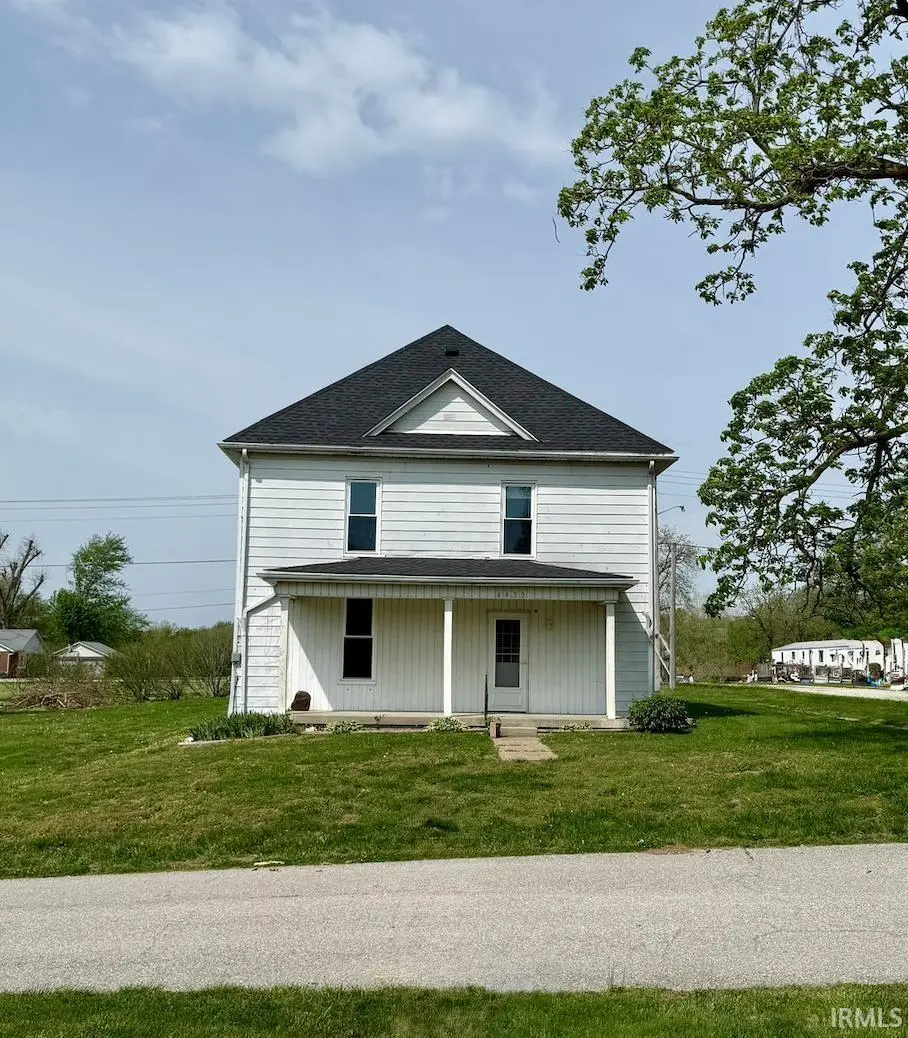
4435 N Hemmerlein St · Dubois, IN
Flood risk 1/10 · Minimal
- FEMA flood zone
- X (unshaded)
- Chance of flooding over 30 yrs
- 0.0%
- Est. flood insurance / yr
- $507 – $1,088
Fire risk 1/10 · Minimal
- Est. fire insurance / yr
- $717 – $1,331
Heat risk 5/10 · Moderate
- Hot days now (above 104°F)
- 7 days/yr
- Hot days in 30 yrs
- 19 days/yr
Wind risk 2/10 · Minimal
- Chance of severe wind over 30 yrs
- 3.0%
Air-quality risk 2/10 · Minimal
- Unhealthy air days now
- 1 days/yr
- Unhealthy air days in 30 yrs
- 3 days/yr
Risk factors via First Street. Map © Google.
Why this score? — see what drove the C- grade
The composite is a weighted blend of 9 inputs, each scored 0–100. Each bar is that input's sub-score; the figure is the points it added to the 100-point composite (weight × sub-score).
- Cash flow +11.9/30.0
- ARV discount +11.8/15.0
- Appreciation +9.0/10.0
- Schools +4.5/10.0
- DSCR +3.5/10.0
- 1% rule +3.4/10.0
- Livability +2.8/5.0
- Rent growth +2.5/5.0
- Condition / age +2.5/5.0
$149,000
🖨 Deal sheet 📄 Offer letter ✓ Due diligence
Listing remarks MLS
Spacious and full of character, this classic square-style home offers nearly 1,800 finished square feet of comfortable living space on a generous 0.35 acre corner lot. With all three bedrooms conveniently located upstairs, the layout provides a functional separation between living and resting spaces, while the main level features a full bath for added convenience. You'll appreciate the charm and potential this home brings, paired with several important updates already completed- including roof, electrical, plumbing, furnace, windows, and portions of the subfloor- giving you peace of mind as you make it your own. Situated on a level lot with plenty of outdoor space to enjoy, this property offers room to relax, entertain, or expand your vision!
Key facts
- 0.35 acre lot
- Built 1900
- Listed 64 days
Neighborhood map
What this means for you Summary
Snapshot
- This is a 3-bed/1.0-bath single-family listed at $149k.
Deal economics
- At list price, monthly cash flow is $-38 ($-458/yr) — negative.
- To cash-flow at today's rent, offer at most $143k (3.7% below list).
- To meet the 1% rule (rent ≥ 1% of price), the offer needs to be $126k (15.8% below list).
- Recommended offer: $126k (15.8% below list) — sets the bar for 1% rule.
Location & tenants
- Location reads 55/100 on livability (#633 in IN) — a working-class tenant base; expect higher turnover. Strengths: cost of living A+, crime A; Watch: health & safety C-, amenities F, commute F.
- Northeast Dubois County School Corporation (rural): math 56% / reading 48% proficiency, ranked #40 of 301 in IN (top 13%) — acceptable for families but not a draw, mixed tenant base, ~2y average lease; only 17% free/reduced lunch — higher-income household profile.
- Market conditions: 14 active listings in the ZIP; 197 units permitted in Dubois County in 2024 (20 in 5+ unit buildings).
Forward outlook
- In year one you build about $13k of equity ($1k loan paydown + $12k appreciation (8.0% local appreciation)).
- Dubois County population projected to shrink 5% by 2050 — rents likely to lag national; underwrite the cash flow, not the appreciation.
- At projected returns (8.0% appreciation + 3.0% rent growth), your $42k cash investment doubles in ~4 years — after that, you're playing with house money.
- By year 3, paydown + projected appreciation supports a ~$32k cash-out refi (75% LTV) — recoverable capital for the next deal without selling this one.
Negotiation context
- It's been on market 65 days — a 6% lower offer ($140k) is reasonable based on typical stale-listing flexibility.
Risks & watch-outs
- Watch-outs: built in 1900 — expect roof / HVAC / electrical / plumbing capex.
- Climate carrying-cost: extreme-heat days projected 7→19/yr by 2055 (HVAC capex compounding) — expect insurance premiums to compound above CPI over the hold.
Questions for the listing agent
- What do current leases actually rent for vs. the listed asking? Can we see a recent rent roll and the last 12 months of T-12 income?
- It's been on market 65 days. Have you received any prior offers? Is the seller open to a 16% concession, seller financing, or rate buy-down credit?
- Built in 1900 — when were the roof, HVAC, electrical panel, plumbing, and water heater last replaced?
- Why hasn't it sold? Are there any deal-killer items the seller is aware of (foundation, flood, title, zoning, code violations)?
- Is there a deadline driving the sale (1031 exchange, divorce, estate, relocation)? That informs how much negotiation room exists.
- What's the average days-on-market for RENTAL listings here right now (not sales)? A rising rental-DOM trend means longer vacancies and softer asking-rent achievability than the comps imply.
- What's the recent tenant-quality profile in this submarket — average credit score on applications, eviction rate, late-payment / NSF rate, and stable-employment percentage? A property-management company in the area should have these aggregated.
- How much new for-sale + rental construction is in the pipeline within 1–3 miles? Heavy new supply typically softens prices + rents 12–24 months out; constrained supply supports both.
Investment metrics
- 1% rule
- 0.84% ✗
- Cap rate
- 5.99%
- Cash-on-cash
- -1.10%
- DSCR
- 0.95
- GRM
- 9.9
CMA / ARV
- ARV (median comp)
- $164,765
- List price
- $149,000
- Delta
- -9.57%
- Verdict
- FAIR
- Comps
- 7 within 1.0 mi
Show comp detail 2 sales within ~0.75 mi
| Address | Dist | Beds/Ba | Sqft | Sold | Price | $/sf | Match |
|---|---|---|---|---|---|---|---|
| 5419 E Walnut St | 0.17mi | 3/1.5 | 1,624 (-9%) | 22mo | $164,500 | $101 | 56 |
| 5571 E Vine St | 0.43mi | 2/2.0 (-1) | 1,691 (-6%) | 15mo | $243,500 | $144 | 49 |
Match score weights: distance 35% · size 25% · config 20% · recency 20%. Top-matched comps best support the ARV.
Projected returns pro-forma
7.99% appreciation · 3.0% rent growth · sell at horizon
- IRR
- 19.1%
- Equity multiple
- 2.41×
- Total profit
- $58,889
- Equity at exit
- $113,118
- IRR
- 17.9%
- Equity multiple
- 5.14×
- Total profit
- $172,700
- Equity at exit
- $224,460
Cash invested: $41,720 (down + closing). Projections, not guarantees.
Landlord ↔ Tenant lean methodology
- Overall (STATE)
- 90 Strongly Landlord-Friendly
- State Indiana
- 90 Strongly Landlord-Friendly · R+11
- County
- — inherits STATE
- City
- — inherits STATE
ZIP-level market 47527
- Home prices YoY
- 3.8%
- Active inventory
- 14
- Price-to-rent
- 9.9×
Monthly cashflow live
- Estimated rent
- $1,255 medium interval (Pro) →
- Mortgage (P&I)
- −$781
- Tax est. 1.5%
- −$186 /mo · $2,235/yr
- Insurance
- −$62
- HOA
- −$0
- Vacancy / Maint / Mgmt
- −$264
- Net cashflow
- $-38
Break-even live
UW: 25.0% down · 7.5% · 30yr · 1.5% tax · 5.0% vac · 8.0% maint · 8.0% mgmt
Financing live
Cash to close
- Down payment
- $37,250
- Closing costs
- $4,470
- Reserves months
- —
- Total cash needed
- —
Loan-product check · same deal, 3 products live
Conventional
25% down · 7.5% · 30yr
- Down + closing
- —
- Monthly P&I
- —
- Monthly cashflow
- —
- DSCR
- —
- Eligible?
- —
Personal DTI + credit; lowest rate.
DSCR
20% down · 8.5% · 30yr
- Down + closing
- —
- Monthly P&I
- —
- Monthly cashflow
- —
- DSCR
- —
- Eligible?
- —
No personal income docs; deal must DSCR.
Hard money
10% down · 12.0% · 12mo
- Down + closing
- —
- Monthly P&I
- —
- Monthly cashflow
- —
- DSCR
- —
- Eligible?
- —
Short-term bridge; refi at stabilization.
Listing history 18 events
-
2026-06-19days on market $149,000 Active 65 DOM
-
2026-06-18days on market $149,000 Active 64 DOM
-
2026-06-17days on market $149,000 Active 63 DOM
-
2026-06-16pricedays on market $149,000 Active 62 DOM
-
2026-06-15days on market $158,000 Active 61 DOM
-
2026-06-14days on market $158,000 Active 59 DOM
-
2026-06-12days on market $158,000 Active 58 DOM
-
2026-06-09days on market $158,000 Active 55 DOM
-
2026-06-08days on market $158,000 Active 54 DOM
-
2026-06-07days on market $158,000 Active 53 DOM
-
2026-06-05days on market $158,000 Active 51 DOM
-
2026-06-04days on market $158,000 Active 49 DOM
-
2026-06-02days on market $158,000 Active 48 DOM
-
2026-06-01days on market $158,000 Active 47 DOM
-
2026-05-31days on market $158,000 Active 46 DOM
-
2026-05-31days on market $158,000 Active 45 DOM
-
2026-05-06price $158,000 752-char remark
Show marketing remark (752 chars)
Spacious and full of character, this classic square-style home offers nearly 1,800 finished square feet of comfortable living space on a generous 0.35 acre corner lot. With all three bedrooms conveniently located upstairs, the layout provides a functional separation between living and resting spaces, while the main level features a full bath for added convenience. You'll appreciate the charm and potential this home brings, paired with several important updates already completed- including roof, electrical, plumbing, furnace, windows, and portions of the subfloor- giving you peace of mind as you make it your own. Situated on a level lot with plenty of outdoor space to enjoy, this property offers room to relax, entertain, or expand your vision!
-
2026-04-15$165,000 Active 752-char remark
Show marketing remark (752 chars)
Spacious and full of character, this classic square-style home offers nearly 1,800 finished square feet of comfortable living space on a generous 0.35 acre corner lot. With all three bedrooms conveniently located upstairs, the layout provides a functional separation between living and resting spaces, while the main level features a full bath for added convenience. You'll appreciate the charm and potential this home brings, paired with several important updates already completed- including roof, electrical, plumbing, furnace, windows, and portions of the subfloor- giving you peace of mind as you make it your own. Situated on a level lot with plenty of outdoor space to enjoy, this property offers room to relax, entertain, or expand your vision!
ⓘ Source: listings_history table (triggers on properties + properties_extension) + one-shot
backfill from property_details.listing_events for pre-trigger history.
Climate risk First Street
- Flood 1/10 Low FEMA zone X (unshaded) · 0% chance over 30 yrs
- Wildfire 1/10 Low
- Heat 5/10 Major 7 d/yr ≥104°F today · 19 d/yr by 30 yrs out
- Wind 2/10 Low 3% chance of damaging wind over 30 yrs
- Air quality 2/10 Low 1 unhealthy d/yr today · 3 by 30 yrs out
Nearby sold comps map
Loading sold comps map…
Walkable amenities ~0.75 mi
Loading nearby amenities…
Taxation est. · year 1
- Rental income
- $15,061
- − Mortgage interest
- −$8,346
- − Property taxes
- −$2,235
- − Insurance
- −$745
- − Repairs & maintenance
- −$1,205
- − Management
- −$1,205
- − Depreciation
- −$4,335
- Taxable loss
- −$3,010
- Est. tax savings @ 24.0%
- +$722
- After-tax cash flow
- $264/yr
For passive investors: Depreciation is non-cash, so a rental often shows a tax loss while cash-flowing — sheltering income. Rental losses are passive: they offset passive income freely, and up to $25,000/yr can offset ordinary (W-2) income if you actively participate and your MAGI is under $100k (phasing out to $0 by $150k); unused losses carry forward. On sale, claimed depreciation is recaptured at up to 25%, and gains may owe capital-gains tax (a 1031 exchange can defer both). Figures are a year-1 estimate at your 24.0% rate — not tax advice; consult a CPA.
Schools (NCES district)
- District
- Northeast Dubois County School Corporation
- NCES district ID
- 1808120
- Math proficiency
- 56% ▼ -5.00%
- Reading proficiency
- 48% ▼ -3.00%
- Median HH income
- $54,828
- Composite
- 44.95/100
- National rank
- #2707
- State rank
- #40 of 301 in IN
Livability — Dubois
- Score
- 55/100
- State rank
- #633
- US rank
- #23626
Category grades
Schools grade is shown separately in the Schools card above.
Census & demographics
- Census place
- Dubois, IN
- Population (ZIP)
- 2,230
Population outlook (Dubois County) Hauer SSP2
- Today (2025)
- 43,036 people
- By 2030
- 43,079 · +0.1%
- By 2040
- 42,531 · -1.2%
- By 2050
- 40,762 · -5.3%
- By 2075
- 36,227 · -15.8%
- By 2100
- 28,083 · -34.7%
Race, ethnicity, and origin ACS 2023
- Neighborhood character
- Predominantly White (94%)
- Race & ethnicity
- White 94% Hispanic / Latino 4% Black 2%
- Foreign-born
- 3% · Canada
- Languages at home
- 97% English-only · Spanish 3%
Political lean MEDSL · Dubois
- 2024 margin
- Solid R (+42.2) · D 27.8% · R 70.0% · Other 2.2%
- 2008→2024 swing
- -38.0pp toward R · 2008: -4.2pp · 2024: -42.2pp
- All cycles
- 2024: R+42.2 2020: R+40.1 2016: R+40.0 2012: R+27.7 2008: R+4.2
Not yet ingested
- Civics
- —
Market trends
- HPI YoY
- ▲ 7.99%
- Current HPI
- 216.4058
- Rent YoY
- —
- Metro
- —
- State GDP YoY
- ▲ 2.90%
- F500 in state
- 18
Industry mix (Fortune 500 HQ in IN)
| Industry | F500 HQs | Revenue |
|---|---|---|
| Industrial Machinery | 2 | $37B |
|
||
| Healthcare | 1 | $177B |
|
||
| Pharmaceuticals | 1 | $45B |
|
||
| Metals / Steel | 1 | $18B |
|
||
| Agriculture | 1 | $17B |
|
||
| Packaging | 1 | $12B |
|
||
Price history
-4.2% since first listed2 events — show timeline
- 2026-05-06 Price Changed $158,000 IRMLS
- 2026-04-15 Listed $165,000 IRMLS
Property tax history
-8.2%/yrLatest (2024): $256 · +8.8% YoY. Source: county tax records.
Cash-flow waterfall
monthlySold comps — $/sqft
last 12 mo · ≤1 miLoading sold comps…