 🌊 Lakefront
26 Squire Ln · Sleepy Hollow Lake, NY
Flood risk 1/10 · Minimal
- FEMA flood zone
- X (unshaded)
- Chance of flooding over 30 yrs
- 0.0%
- Est. flood insurance / yr
- $473 – $860
Fire risk 3/10 · Minor
- Est. fire insurance / yr
- $691 – $1,283
Heat risk 4/10 · Minor
- Hot days now (above 99°F)
- 7 days/yr
- Hot days in 30 yrs
- 16 days/yr
Wind risk 3/10 · Minor
- Chance of severe wind over 30 yrs
- 9.0%
Air-quality risk 2/10 · Minimal
- Unhealthy air days now
- 0 days/yr
- Unhealthy air days in 30 yrs
- 1 days/yr
Risk factors via First Street. Map © Google.
Why this score? — see what drove the D grade
The composite is a weighted blend of 9 inputs, each scored 0–100. Each bar is that input's sub-score; the figure is the points it added to the 100-point composite (weight × sub-score).
- Cash flow +8.1/30.0
- Appreciation +8.0/10.0
- ARV discount +7.6/15.0
- Schools +4.3/10.0
- Condition / age +3.8/5.0
- 1% rule +3.1/10.0
- Rent growth +2.5/5.0
- Livability +2.5/5.0
- DSCR +2.2/10.0
$399,000
🖨 Deal sheet (PDF) 📄 Offer letter ✓ Due diligence
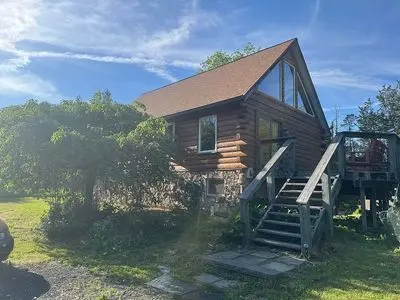
Listing remarks
Secluded Log Cabin Home with Waterfront across from forever wild property never to be built on and protected! Stay in a hidden finger of Sleepy Hollow Lake nestled in natural beauty and wildlife that makes you stop and listen to tranquility, with all the amenities and recreation of SHL Living! Choose your sport - grab your kayak or small boat and head to the beach and pools, or play tennis/pickleball, golf range, yoga, or check out posted daily events at lodge. This solid, ready to move in Log Cabin sits on 1.46 acres with 100' feet of road frontage and 105' lake frontage and boasts three-bedrooms with two full baths, a spacious loft and a full, partially finished basement with a cozy woo
Key facts
- Total seclusion
- Protected nature
- Huge pine tree
Tags
Neighborhood map
What this means for you Summary
Snapshot
- This is a 3-bed/2.0-bath single-family listed at $399k. Condition is rated good.
Deal economics
- At list price, monthly cash flow is $-382 ($-5k/yr) — negative.
- To cash-flow at today's rent, offer at most $344k (13.8% below list).
- To meet the 1% rule (rent ≥ 1% of price), the offer needs to be $325k (18.5% below list).
- Recommended offer: $325k (18.5% below list) — sets the bar for 1% rule.
- Cap rate 5.1% vs local median 2.3% in Sleepy Hollow Lake — top-decile yield for the area; either an underpriced asset or a hidden risk that comps aren't pricing in. Stress-test before assuming the spread holds.
Location & tenants
- Location reads: area grade D — affects rentability + tenant quality, not the cash-flow math above.
- Coxsackie-Athens Central School District (town): math 43% / reading 56% proficiency, ranked #384 of 590 in NY (top 65%) — families likely to look elsewhere, expect single-tenant / working-renter base with shorter leases.
- Zoned schools: Edward J Arthur Elementary School (math 44% / reading 64%, grade C, #908 of 2,108 statewide, top 46%, 184 students, 40% FRL); Coxsackie-Athens Middle School (math 22% / reading 46%, grade F, #497 of 729 statewide, top 69%, 364 students, 41% FRL); Coxsackie-Athens High School (math 87% / reading 82%, grade A, #379 of 1,100 statewide, top 36%, 365 students, 0% FRL) — zoned schools at 27% FRL track the district average.
- Market conditions: 91 active listings in the ZIP; 1 comparable units currently listed for rent nearby; 97 units permitted in Greene County in 2024 (0 in 5+ unit buildings).
Forward outlook
- In year one you build about $26k of equity ($3k loan paydown + $24k appreciation (5.9% local appreciation)).
- Greene County population projected at -22% by 2050 — secular population decline; favor cash flow + early exit over multi-decade hold.
- By year 2, paydown + projected appreciation supports a ~$42k cash-out refi (75% LTV) — recoverable capital for the next deal without selling this one.
Negotiation context
- It's been on market 18 days — a 2% lower offer ($393k) is reasonable based on typical stale-listing flexibility.
Questions for the listing agent
- What do current leases actually rent for vs. the listed asking? Can we see a recent rent roll and the last 12 months of T-12 income?
- What does the HOA fee cover, when was the last increase, and are there any pending special assessments or reserve-fund shortfalls?
- Is there a deadline driving the sale (1031 exchange, divorce, estate, relocation)? That informs how much negotiation room exists.
- The area grade is low — what's the realistic commute time and amenity access for the typical tenant pool here? Any planned neighborhood developments (good or bad) we should know about?
- This sits on a lake — are riparian / water-frontage rights deeded with the parcel? Any dock permits, shoreline easements, or HOA water-use restrictions?
- What's the documented flood / surge / shoreline-erosion history here (FEMA AND non-FEMA — e.g., storm surge, creek backup, septic-field saturation)?
- Any water-quality or seasonal algae-bloom issues that affect tenant satisfaction or short-term-rental demand?
- What's the average days-on-market for RENTAL listings here right now (not sales)? A rising rental-DOM trend means longer vacancies and softer asking-rent achievability than the comps imply.
- What's the recent tenant-quality profile in this submarket — average credit score on applications, eviction rate, late-payment / NSF rate, and stable-employment percentage? A property-management company in the area should have these aggregated.
- How much new for-sale + rental construction is in the pipeline within 1–3 miles? Heavy new supply typically softens prices + rents 12–24 months out; constrained supply supports both.
Investment metrics
- 1% rule
- 0.81% ✗
- Cap rate
- 5.14%
- Cash-on-cash
- -4.10%
- DSCR
- 0.82
- GRM
- 10.2
CMA / ARV
- ARV (on-the-fly)
- $399,500
- Comps found
- 3
Show comp detail 3 sales within ~0.75 mi
| Address | Dist | Beds/Ba | Sqft | Sold | Price | $/sf | Match |
|---|---|---|---|---|---|---|---|
| 19 Lisa Ln | 0.62mi | 3/2.0 | 1,512 (+13%) | 16mo | $335,000 | $222 | 36 |
| 19 Lisa Ln #1211 | 0.62mi | 3/2.0 | 1,512 (+13%) | 16mo | $335,000 | $222 | 36 |
| 776 Sleepy Hollow Rd Rd | 0.71mi | 3/2.5 | 1,520 (+14%) | 21mo | $360,000 | $237 | 24 |
Match score weights: distance 35% · size 25% · config 20% · recency 20%. Top-matched comps best support the ARV.
Projected returns pro-forma
5.93% appreciation · 3.0% rent growth · sell at horizon
- IRR
- 11.9%
- Equity multiple
- 1.80×
- Total profit
- $89,261
- Equity at exit
- $248,931
- IRR
- 12.7%
- Equity multiple
- 3.53×
- Total profit
- $282,402
- Equity at exit
- $449,795
Cash invested: $111,720 (down + closing). Projections, not guarantees.
Landlord ↔ Tenant lean methodology
- Overall (STATE)
- 15 Strongly Tenant-Friendly
- State New York
- 15 Strongly Tenant-Friendly · D+10
- County
- — inherits STATE
- City
- — inherits STATE
ZIP-level market 12015
- Home prices YoY
- 1.4%
- Active inventory
- 91
- Price-to-rent
- 10.2×
Monthly cashflow live
- Estimated rent
- $3,250 medium interval (Pro) →
- Mortgage (P&I)
- −$2,092
- Tax est. 1.5%
- −$499 /mo · $5,985/yr
- Insurance
- −$166
- HOA
- −$192
- Vacancy / Maint / Mgmt
- −$682
- Net cashflow
- $-382
Break-even live
Sensitivity live
| Price | -10% $-106 | -5% $-244 | +0% $-382 | +5% $-520 | +10% $-658 |
|---|---|---|---|---|---|
| Rent | -10% $-639 | -5% $-510 | +0% $-382 | +5% $-254 | +10% $-125 |
| Rate | -1.0pp $-181 | -0.5pp $-280 | base $-382 | +0.5pp $-485 | +1.0pp $-590 |
UW: 25.0% down · 7.5% · 30yr · 1.5% tax · 5.0% vac · 8.0% maint · 8.0% mgmt
Financing live
Cash to close
- Down payment
- $99,750
- Closing costs
- $11,970
- Reserves months
- —
- Total cash needed
- —
Loan-product check · same deal, 3 products live
Conventional
25% down · 7.5% · 30yr
- Down + closing
- —
- Monthly P&I
- —
- Monthly cashflow
- —
- DSCR
- —
- Eligible?
- —
Personal DTI + credit; lowest rate.
DSCR
20% down · 8.5% · 30yr
- Down + closing
- —
- Monthly P&I
- —
- Monthly cashflow
- —
- DSCR
- —
- Eligible?
- —
No personal income docs; deal must DSCR.
Hard money
10% down · 12.0% · 12mo
- Down + closing
- —
- Monthly P&I
- —
- Monthly cashflow
- —
- DSCR
- —
- Eligible?
- —
Short-term bridge; refi at stabilization.
Rent comps 1 comps
| Address | Beds | Baths | Sqft | Rent | $/sqft | DOM | Units | Dist |
|---|---|---|---|---|---|---|---|---|
| 1321 Sleepy Hollow RD Other City - Not In The State Of Florida, NY | 3.0 | 2.0 | 1640 | $3,250 | $1.98 | 45d | 1 | 0.43mi |
HOA detail
- Monthly dues
- $192 · $2,304/yr
- Likely covers
- waterpool
Listing history 18 events
-
2026-06-21days on market $399,000 Active 18 DOM
-
2026-06-18days on market $399,000 Active 15 DOM
-
2026-06-17days on market $399,000 Active 14 DOM
-
2026-06-16days on market $399,000 Active 13 DOM
-
2026-06-15days on market $399,000 Active 12 DOM
-
2026-06-14days on market $399,000 Active 10 DOM
-
2026-06-13pricedays on market $399,000 Active 9 DOM
-
2026-06-10days on market $450,000 Active 7 DOM
-
2026-06-09days on market $450,000 Active 6 DOM
-
2026-06-08days on market $450,000 Active 5 DOM
-
2026-06-07days on market $450,000 Active 4 DOM
-
2026-06-05remarks 699-char remark
-
2026-06-05days on market $450,000 Active 1 DOM
-
2026-06-03days on market $450,000 Active 4 DOM
-
2026-06-02days on market $450,000 Active 3 DOM
-
2026-06-01days on market $450,000 Active 2 DOM
-
2026-05-31remarks 538-char remark
-
2026-05-31$450,000 Active 1 DOM
ⓘ Source: listings_history table (triggers on properties + properties_extension) + one-shot
backfill from property_details.listing_events for pre-trigger history.
Climate risk First Street
- Flood 1/10 Low FEMA zone X (unshaded) · 0% chance over 30 yrs
- Wildfire 3/10 Moderate
- Heat 4/10 Moderate 7 d/yr ≥99°F today · 16 d/yr by 30 yrs out
- Wind 3/10 Moderate 9% chance of damaging wind over 30 yrs
- Air quality 2/10 Low 0 unhealthy d/yr today · 1 by 30 yrs out
Nearby sold comps map
Loading sold comps map…
Walkable amenities ~0.75 mi
Loading nearby amenities…
Taxation est. · year 1
- Rental income
- $39,000
- − Mortgage interest
- −$22,350
- − Property taxes
- −$5,985
- − Insurance
- −$1,995
- − Repairs & maintenance
- −$3,120
- − Management
- −$3,120
- − HOA
- −$2,304
- − Depreciation
- −$11,607
- Taxable loss
- −$11,481
- Est. tax savings @ 24.0%
- +$2,756
- After-tax cash flow
- $-1,827/yr
For passive investors: Depreciation is non-cash, so a rental often shows a tax loss while cash-flowing — sheltering income. Rental losses are passive: they offset passive income freely, and up to $25,000/yr can offset ordinary (W-2) income if you actively participate and your MAGI is under $100k (phasing out to $0 by $150k); unused losses carry forward. On sale, claimed depreciation is recaptured at up to 25%, and gains may owe capital-gains tax (a 1031 exchange can defer both). Figures are a year-1 estimate at your 24.0% rate — not tax advice; consult a CPA.
Condition & rehab AI · 2 photos
This log cabin is in good condition with a good exterior and interior. It has a good roof and flooring, and the interior walls and paint appear to be in good condition. The HVAC system is functioning properly. The property has a good curb appeal and is well-maintained. The property is ready to move in and can be enhanced with some exterior painting and landscaping improvements to increase its value.
Value-add opportunities
- Both Paint the exterior — Enhances curb appeal and can increase both resale and rental value.
- Both Landscaping improvements — Improves the overall aesthetic and can increase both resale and rental value.
- Rental HVAC maintenance — Ensures the HVAC system is functioning properly, which is important for rental properties.
Renovation cost estimate screening
Value-add ROI direction
- Both Paint the exterior — Enhances curb appeal and can increase both resale and rental value. ↑
- Both Landscaping improvements — Improves the overall aesthetic and can increase both resale and rental value. ↑
- Rental HVAC maintenance — Ensures the HVAC system is functioning properly, which is important for rental properties. ↑
ⓘ Cost ranges are severity-bucket heuristics (US national rule-of-thumb). Get contractor quotes + a written scope before underwriting a rehab budget.
Schools (NCES district)
- District
- Coxsackie-Athens Central School District
- NCES district ID
- 3608490
- Math proficiency
- 43% ▼ -1.00%
- Reading proficiency
- 56% ▲ 19.00%
- Median HH income
- $55,006
- Composite
- 42.8/100
- National rank
- #3143
- State rank
- #384 of 590 in NY
Livability — Sleepy Hollow Lake
No livability data for this city. (Only ~50 U.S. cities are tracked.)
Census & demographics
- Census place
- Sleepy Hollow Lake, NY
- Population (ZIP)
- 4,084
Population outlook (Greene County) Hauer SSP2
- Today (2025)
- 44,963 people
- By 2030
- 43,126 · -4.1%
- By 2040
- 38,756 · -13.8%
- By 2050
- 34,913 · -22.4%
- By 2075
- 28,156 · -37.4%
- By 2100
- 22,296 · -50.4%
Race, ethnicity, and origin ACS 2023
- Neighborhood character
- Predominantly White (79%)
- Race & ethnicity
- White 79% Two or more races 10% Hispanic / Latino 7% Asian 3% Black 1%
- Hispanic origin (detail)
- Mexican 4% Dominican 2%
- Common ancestry
- Romanian 3% Iranian 3% Scotch-Irish 2%
- Foreign-born
- 11% · Canada, South Korea, Vietnam
- Languages at home
- 90% English-only · Russian/Polish/Slavic 5% Other Indo-European 2% Spanish 1%
Political lean MEDSL · Greene
- 2024 margin
- R (+17.0) · D 41.5% · R 58.5%
- 2008→2024 swing
- -7.1pp toward R · 2008: -9.9pp · 2024: -17.0pp
- All cycles
- 2024: R+17.0 2020: R+15.6 2016: R+27.4 2012: R+11.1 2008: R+9.9
Not yet ingested
- Civics
- —
Market trends
- HPI YoY
- ▲ 5.93%
- Current HPI
- 426.3034
- Rent YoY
- —
- Metro
- —
- State GDP YoY
- ▲ 2.60%
- F500 in state
- 92
Industry mix (Fortune 500 HQ in NY)
| Industry | F500 HQs | Revenue |
|---|---|---|
| Financial Services | 10 | $950B |
|
||
| Consumer Goods | 9 | $162B |
|
||
| Insurance | 4 | $225B |
|
||
| Telecommunications | 2 | $144B |
|
||
| Pharmaceuticals | 2 | $112B |
|
||
| Media / Entertainment | 2 | $69B |
|
||
Price history
1 event — show timeline
- 2026-05-31 Listed $450,000 FSBO.com
Cash-flow waterfall
monthlySold comps — $/sqft
last 12 mo · ≤1 miLoading sold comps…