 🌊 Lakefront
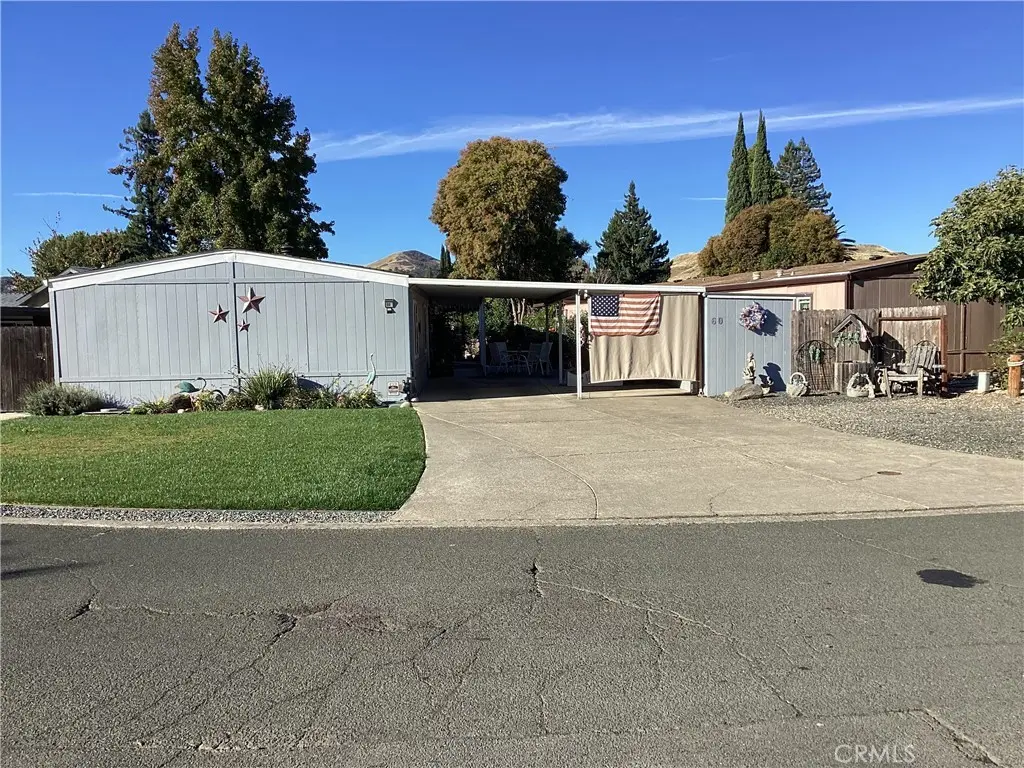
1800 S MAIN St #60 · Lakeport, CA
Flood risk 1/10 · Minimal
- FEMA flood zone
- X (unshaded)
- Chance of flooding over 30 yrs
- 0.0%
- Est. flood insurance / yr
- $507 – $1,088
Fire risk 8/10 · Major
- Est. fire insurance / yr
- $659 – $1,223
Heat risk 5/10 · Moderate
- Hot days now (above 103°F)
- 7 days/yr
- Hot days in 30 yrs
- 13 days/yr
Wind risk 1/10 · Minimal
- Chance of severe wind over 30 yrs
- —
Air-quality risk 10/10 · Severe
- Unhealthy air days now
- 28 days/yr
- Unhealthy air days in 30 yrs
- 29 days/yr
Risk factors via First Street. Map © Google.
Why this score? — see what drove the C+ grade
The composite is a weighted blend of 9 inputs, each scored 0–100. Each bar is that input's sub-score; the figure is the points it added to the 100-point composite (weight × sub-score).
- Cash flow +26.6/30.0
- ARV discount +9.7/15.0
- DSCR +9.1/10.0
- 1% rule +7.1/10.0
- Condition / age +4.0/5.0
- Livability +2.7/5.0
- Rent growth +2.5/5.0
- Schools +1.9/10.0
- Appreciation +0.0/10.0
$169,000
🖨 Deal sheet 📄 Offer letter ✓ Due diligence
Listing remarks MLS
THIS IS THE BEST SENIOR PARK. PARKING FOR AT LEAST 6 VEHICLES ON PROPERTY. POSSIBLE R. V. PARKING MUST GET APPROVAL FROM MANAGER. DOCK AND RAMP AT REAR OF LOT, LEADS INTO LAGOON WHICH HAS WATER WAY TO LAKE. CONCRETE ON 3 SIDES OF MANUFACTURED HOME. BEAUTIFUL FRON LAWN. PATIO WITH AWNING BETWEEN HOME AND STORAGE BUILDING COVERED WALKWAY TO REAR OF PROPERTY LEADING TO LAGOON. PROPANE GAS GENERATOR CONNECTED TO GAS LINE AND HOME WIRED TO KEEP HOME ELECTRIFIED. ENCLOSED SIDE YARD. 2 MINI SPLITS SYSTEMS INSTALLED IN HOME. THIS HOME IS IN PRIME CONDITION AND READY FOR YOUR DREAM .
Key facts
- Patio with awning
- Water way to lake
- Dock and ramp
Tags
Neighborhood map
What this means for you Summary
Snapshot
- This is a 2-bed/2.0-bath manufactured listed at $169k. Condition is rated good.
Deal economics
- At list price, monthly cash flow is $453 ($5k/yr) — positive.
- The deal already cash-flows at list — no discount required.
- Meets the 1% rule at list price ($2k rent vs $169k).
- Recommended offer: $149k (12.0% below list) — sets the bar for market timing.
- Cap rate 9.5% vs local median 3.3% in Lakeport — top-decile yield for the area; either an underpriced asset or a hidden risk that comps aren't pricing in. Stress-test before assuming the spread holds.
Location & tenants
- Location reads 54/100 on livability (#925 in CA) — a working-class tenant base; expect higher turnover. Strengths: housing A; Watch: health & safety C-, schools D+, employment D+.
- Lakeport Unified (town): math 13% / reading 30% proficiency, ranked #451 of 517 in CA (top 87%) — low school quality limits family demand, transient renter base, plan for 1-2y turnover.
- Market conditions: 148 active listings in the ZIP; 5 comparable units currently listed for rent nearby; rentals lingering (median 44d on market — plan ~5-8 weeks vacancy on turnover, expect pricing pressure); 100% of comp listings sitting > 30 days — soft ceiling on asking rent; 107 units permitted in Lake County in 2024 (40 in 5+ unit buildings).
- This rent runs 34% of the median local income ($71k/yr) — at the standard rent-burdened threshold; future hikes will face affordability resistance.
Forward outlook
- Local home prices are declining (-3.0%/yr); year-one equity from $1k of loan paydown is wiped out by about $5k of value loss. Plan a longer hold.
- Lake County population projected at -15% by 2050 — secular population decline; favor cash flow + early exit over multi-decade hold.
- At projected returns (-3.0% appreciation + 3.0% rent growth), your $47k cash investment doubles in ~10 years — after that, you're playing with house money.
Negotiation context
- It's been on market 245 days — a 12% lower offer ($149k) is reasonable based on typical stale-listing flexibility.
- 8 sale attempts since 4y ago; this cycle's ask has dropped $11k (6%) from the opening price — seller is motivated, your offer sets the floor, not the list.
Risks & watch-outs
- Climate carrying-cost: severe wildfire risk; extreme-heat days projected 7→13/yr by 2055 (HVAC capex compounding) — expect insurance premiums to compound above CPI over the hold.
Questions for the listing agent
- It's been on market 245 days. Have you received any prior offers? Is the seller open to a 12% concession, seller financing, or rate buy-down credit?
- Built in 1977 — when were the roof, HVAC, electrical panel, plumbing, and water heater last replaced?
- Why hasn't it sold? Are there any deal-killer items the seller is aware of (foundation, flood, title, zoning, code violations)?
- Is there a deadline driving the sale (1031 exchange, divorce, estate, relocation)? That informs how much negotiation room exists.
- Schools are D-rated, which usually means shorter tenancies and higher turnover. Who's the typical renter profile here, and what's been the actual vacancy rate?
- Crime grade is F in this area — have there been break-ins, vandalism, or insurance claims at this property in the last 3 years? What carrier currently insures it and at what premium?
- This sits on a lake — are riparian / water-frontage rights deeded with the parcel? Any dock permits, shoreline easements, or HOA water-use restrictions?
- What's the documented flood / surge / shoreline-erosion history here (FEMA AND non-FEMA — e.g., storm surge, creek backup, septic-field saturation)?
- Any water-quality or seasonal algae-bloom issues that affect tenant satisfaction or short-term-rental demand?
- What's the average days-on-market for RENTAL listings here right now (not sales)? A rising rental-DOM trend means longer vacancies and softer asking-rent achievability than the comps imply.
- What's the recent tenant-quality profile in this submarket — average credit score on applications, eviction rate, late-payment / NSF rate, and stable-employment percentage? A property-management company in the area should have these aggregated.
- How much new for-sale + rental construction is in the pipeline within 1–3 miles? Heavy new supply typically softens prices + rents 12–24 months out; constrained supply supports both.
Investment metrics
- 1% rule
- 1.21% ✓
- Cap rate
- 9.51%
- Cash-on-cash
- 11.48%
- DSCR
- 1.51
- GRM
- 6.9
CMA / ARV
- ARV (median comp)
- $177,610
- List price
- $169,000
- Delta
- -4.85%
- Verdict
- FAIR
- Comps
- 12 within 1.0 mi
Show comp detail 12 sales within ~0.75 mi
| Address | Dist | Beds/Ba | Sqft | Sold | Price | $/sf | Match |
|---|---|---|---|---|---|---|---|
| 1800 S Main St #89 | 0.09mi | 2/2.0 | 1,440 (0%) | 4mo | $170,000 | $118 | 92 |
| 1800 South Main St #78 | 0.05mi | 2/2.0 | 1,400 (-3%) | 13mo | $250,000 | $179 | 83 |
| 1800 S Main #24 | 0.05mi | 3/2.0 (+1) | 1,440 (0%) | 13mo | $145,000 | $101 | 82 |
| 1800 S Main #19 | 0.05mi | 2/2.0 | 1,344 (-7%) | 6mo | $125,000 | $93 | 82 |
| 1800 S Main St #86 | 0.05mi | 2/2.0 | 1,440 (0%) | 19mo | $210,000 | $146 | 82 |
| 1800 south main #23 | 0.05mi | 2/2.0 | 1,368 (-5%) | 10mo | $112,000 | $82 | 81 |
| 1900 S Main St #29 | 0.19mi | 2/2.0 | 1,452 (+1%) | 11mo | $265,000 | $183 | 80 |
| 1900 S Main St #11 | 0.26mi | 2/2.0 | 1,440 (0%) | 11mo | $188,000 | $131 | 79 |
| 1800 South Main St #14 | 0.08mi | 2/2.0 | 1,344 (-7%) | 13mo | $151,903 | $113 | 74 |
| 1900 S Main St #43 | 0.26mi | 2/2.0 | 1,560 (+8%) | 11mo | $296,000 | $190 | 65 |
| 1900 S Main St #26 | 0.22mi | 3/2.0 (+1) | 1,612 (+12%) | 8mo | $314,000 | $195 | 58 |
| 1025 Martin St #7 | 0.69mi | 3/2.0 (+1) | 1,440 (0%) | 20mo | $40,000 | $28 | 46 |
Match score weights: distance 35% · size 25% · config 20% · recency 20%. Top-matched comps best support the ARV.
Projected returns pro-forma
-3.0% appreciation · 3.0% rent growth · sell at horizon
- IRR
- 0.8%
- Equity multiple
- 1.03×
- Total profit
- $1,469
- Equity at exit
- $25,198
- IRR
- 10.5%
- Equity multiple
- 1.81×
- Total profit
- $38,520
- Equity at exit
- $14,612
Cash invested: $47,320 (down + closing). Projections, not guarantees.
Landlord ↔ Tenant lean methodology
- Overall (STATE)
- 18 Strongly Tenant-Friendly
- State California
- 18 Strongly Tenant-Friendly · D+13
- County
- — inherits STATE
- City
- — inherits STATE
ZIP-level market 95453
- Active inventory
- 148
- Price-to-rent
- 6.9×
Monthly cashflow live
- Estimated rent
- $2,051 high interval (Pro) →
- Mortgage (P&I)
- −$886
- Tax est. 1.5%
- −$211 /mo · $2,535/yr
- Insurance
- −$70
- HOA
- −$0
- Vacancy / Maint / Mgmt
- −$431
- Net cashflow
- $453
Break-even live
UW: 25.0% down · 7.5% · 30yr · 1.5% tax · 5.0% vac · 8.0% maint · 8.0% mgmt
Financing live
Cash to close
- Down payment
- $42,250
- Closing costs
- $5,070
- Reserves months
- —
- Total cash needed
- —
Loan-product check · same deal, 3 products live
Conventional
25% down · 7.5% · 30yr
- Down + closing
- —
- Monthly P&I
- —
- Monthly cashflow
- —
- DSCR
- —
- Eligible?
- —
Personal DTI + credit; lowest rate.
DSCR
20% down · 8.5% · 30yr
- Down + closing
- —
- Monthly P&I
- —
- Monthly cashflow
- —
- DSCR
- —
- Eligible?
- —
No personal income docs; deal must DSCR.
Hard money
10% down · 12.0% · 12mo
- Down + closing
- —
- Monthly P&I
- —
- Monthly cashflow
- —
- DSCR
- —
- Eligible?
- —
Short-term bridge; refi at stabilization.
Rent comps 5 comps
| Address | Beds | Baths | Sqft | Rent | $/sqft | DOM | Units | Dist |
|---|---|---|---|---|---|---|---|---|
| 300 Grace Ln Lakeport, CA | 2.0 | 2.0 | 1200 | $2,500 | $2.08 | 43d | 1 | 0.18mi |
| 10 Royale Ave Lakeport, CA | 2.0–3.0 | 2.0 | 1475 | $1,800 | $1.22 | 43d | 3 | 0.26mi |
| 10 Royale Ave #21 Lakeport, CA | 2.0 | 2.0 | 1225 | $2,195 | $1.79 | 43d | 1 | 0.26mi |
| 10 Royale Ave #17 Lakeport, CA | 2.0 | 2.0 | 1221 | $2,100 | $1.72 | 43d | 1 | 0.26mi |
| 595 9th St Lakeport, CA | 3.0 | 2.5 | 1596 | $1,900 | $1.19 | 43d | 1 | 1.17mi |
Listing history 34 events
-
2026-06-19days on market $169,000 Active 245 DOM
-
2026-06-18days on market $169,000 Active 244 DOM
-
2026-06-17days on market $169,000 Active 243 DOM
-
2026-06-16days on market $169,000 Active 242 DOM
-
2026-06-15days on market $169,000 Active 241 DOM
-
2026-06-14days on market $169,000 Active 239 DOM
-
2026-06-12statusdays on market $169,000 Active 238 DOM
-
2026-06-09days on market $169,000 Active Under Contract 235 DOM
-
2026-06-08days on market $169,000 Active Under Contract 234 DOM
-
2026-06-07statusdays on market $169,000 Active Under Contract 233 DOM
-
2026-06-05days on market $169,000 Active 230 DOM
-
2026-06-03days on market $169,000 Active 229 DOM
-
2026-06-02days on market $169,000 Active 228 DOM
-
2026-06-01days on market $169,000 Active 227 DOM
-
2026-05-31days on market $169,000 Active 226 DOM
-
2026-05-30days on market $169,000 Active 225 DOM
-
2026-03-13price $169,000 581-char remark
Show marketing remark (581 chars)
THIS IS THE BEST SENIOR PARK. PARKING FOR AT LEAST 6 VEHICLES ON PROPERTY. POSSIBLE R. V. PARKING MUST GET APPROVAL FROM MANAGER. DOCK AND RAMP AT REAR OF LOT, LEADS INTO LAGOON WHICH HAS WATER WAY TO LAKE. CONCRETE ON 3 SIDES OF MANUFACTURED HOME. BEAUTIFUL FRON LAWN. PATIO WITH AWNING BETWEEN HOME AND STORAGE BUILDING COVERED WALKWAY TO REAR OF PROPERTY LEADING TO LAGOON. PROPANE GAS GENERATOR CONNECTED TO GAS LINE AND HOME WIRED TO KEEP HOME ELECTRIFIED. ENCLOSED SIDE YARD. 2 MINI SPLITS SYSTEMS INSTALLED IN HOME. THIS HOME IS IN PRIME CONDITION AND READY FOR YOUR DREAM .
-
2025-10-17$179,950 Active 581-char remark
Show marketing remark (581 chars)
THIS IS THE BEST SENIOR PARK. PARKING FOR AT LEAST 6 VEHICLES ON PROPERTY. POSSIBLE R. V. PARKING MUST GET APPROVAL FROM MANAGER. DOCK AND RAMP AT REAR OF LOT, LEADS INTO LAGOON WHICH HAS WATER WAY TO LAKE. CONCRETE ON 3 SIDES OF MANUFACTURED HOME. BEAUTIFUL FRON LAWN. PATIO WITH AWNING BETWEEN HOME AND STORAGE BUILDING COVERED WALKWAY TO REAR OF PROPERTY LEADING TO LAGOON. PROPANE GAS GENERATOR CONNECTED TO GAS LINE AND HOME WIRED TO KEEP HOME ELECTRIFIED. ENCLOSED SIDE YARD. 2 MINI SPLITS SYSTEMS INSTALLED IN HOME. THIS HOME IS IN PRIME CONDITION AND READY FOR YOUR DREAM .
-
2025-09-17historical
-
2025-04-14price $199,950
-
2025-03-10$210,000 Active
-
2022-12-17status Active
-
2022-12-17historical
-
2022-10-10status Active
-
2022-10-06status Active
-
2022-10-06price $154,888
-
2022-09-02status Active Under Contract
-
2022-08-31historical
-
2022-08-31historical
-
2022-07-12price $169,888
-
2022-05-18status Active
-
2022-05-16status Pending Sale
-
2022-04-20historical Active Under Contract
-
2022-02-10$189,888 Active
ⓘ Source: listings_history table (triggers on properties + properties_extension) + one-shot
backfill from property_details.listing_events for pre-trigger history.
Climate risk First Street
- Flood 1/10 Low FEMA zone X (unshaded) · 0% chance over 30 yrs
- Wildfire 8/10 Severe
- Heat 5/10 Major 7 d/yr ≥103°F today · 13 d/yr by 30 yrs out
- Wind 1/10 Low
- Air quality 10/10 Extreme 28 unhealthy d/yr today · 29 by 30 yrs out
Nearby sold comps map
Loading sold comps map…
Walkable amenities ~0.75 mi
Loading nearby amenities…
Taxation est. · year 1
- Rental income
- $24,615
- − Mortgage interest
- −$9,467
- − Property taxes
- −$2,535
- − Insurance
- −$845
- − Repairs & maintenance
- −$1,969
- − Management
- −$1,969
- − Depreciation
- −$4,916
- Taxable income
- $2,914
- Est. tax owed @ 24.0%
- −$699
- After-tax cash flow
- $4,731/yr
For passive investors: Depreciation is non-cash, so a rental often shows a tax loss while cash-flowing — sheltering income. Rental losses are passive: they offset passive income freely, and up to $25,000/yr can offset ordinary (W-2) income if you actively participate and your MAGI is under $100k (phasing out to $0 by $150k); unused losses carry forward. On sale, claimed depreciation is recaptured at up to 25%, and gains may owe capital-gains tax (a 1031 exchange can defer both). Figures are a year-1 estimate at your 24.0% rate — not tax advice; consult a CPA.
Condition & rehab AI · 12 photos
This manufactured home is in prime condition and ready for a new owner. It features modern appliances, clean bathrooms, and a well-maintained exterior. Consider painting the exterior siding and replacing the propane gas generator for a slight increase in value.
Value-add opportunities
- Both Paint exterior siding — Enhances curb appeal and value
- Both Replace propane gas generator — Ensures home is electrified and reduces maintenance costs
Renovation cost estimate screening
Value-add ROI direction
- Both Paint exterior siding — Enhances curb appeal and value ↑
- Both Replace propane gas generator — Ensures home is electrified and reduces maintenance costs ↑
ⓘ Cost ranges are severity-bucket heuristics (US national rule-of-thumb). Get contractor quotes + a written scope before underwriting a rehab budget.
Schools (NCES district)
- District
- Lakeport Unified
- NCES district ID
- 0620670
- Math proficiency
- 13% ▼ -8.00%
- Reading proficiency
- 30% ▲ 1.00%
- Median HH income
- $44,332
- Composite
- 18.55/100
- National rank
- #8912
- State rank
- #451 of 517 in CA
Livability — Lakeport
- Score
- 54/100
- State rank
- #925
- US rank
- #24236
Category grades
Schools grade is shown separately in the Schools card above.
Census & demographics
- Census place
- Lakeport, CA
- County
- Lake County · 24,333 people
- City population
- 11,741
- Metro
- Clearlake, CA
- Population (ZIP)
- 11,741
- Household income
- $71,419
- Rent vs Own
- Severe rent burden
- 250.0
Population outlook (Lake County) Hauer SSP2
- Today (2025)
- 62,396 people
- By 2030
- 60,626 · -2.8%
- By 2040
- 56,453 · -9.5%
- By 2050
- 53,054 · -15.0%
- By 2075
- 47,663 · -23.6%
- By 2100
- 41,804 · -33.0%
Race, ethnicity, and origin ACS 2023
- Neighborhood character
- Predominantly White (74%)
- Race & ethnicity
- White 74% Hispanic / Latino 14% Two or more races 9% Native American 5% Asian 1%
- Hispanic origin (detail)
- Mexican 10%
- Common ancestry
- Italian 3% Slovak 3% Romanian 2%
- Foreign-born
- 6% · Canada
- Languages at home
- 89% English-only · Spanish 9% Other Indo-European 1%
Political lean MEDSL · Lake
- 2024 margin
- Toss-up / Even · D 47.8% · R 49.2% · Other 3.0%
- 2008→2024 swing
- -20.6pp toward R · 2008: 19.3pp · 2024: -1.4pp
- All cycles
- 2024: R+1.4 2020: D+6.3 2016: D+3.7 2012: D+16.5 2008: D+19.3
Not yet ingested
- Civics
- —
Market trends
- HPI YoY
- ▼ -176.01%
- Current HPI
- 155.5391
- Rent YoY
- —
- Metro
- Clearlake, CA
- State GDP YoY
- ▲ 3.21%
- F500 in state
- 116
Industry mix (Fortune 500 HQ in CA)
| Industry | F500 HQs | Revenue |
|---|---|---|
| Technology | 27 | $1,492B |
|
||
| Financial Services | 3 | $174B |
|
||
| Retail | 3 | $44B |
|
||
| Insurance | 3 | $26B |
|
||
| Media / Entertainment | 2 | $115B |
|
||
| Pharmaceuticals / Biotech | 2 | $62B |
|
||
Price history
-11.0% since first listed18 events — show timeline
- 2026-03-13 Price Changed $169,000 CRMLS
- 2025-10-17 Listed $179,950 CRMLS
- 2025-09-17 Listing Removed — CRMLS
- 2025-04-14 Price Changed $199,950 CRMLS
- 2025-03-10 Listed $210,000 CRMLS
- 2022-12-17 Relisted — CRMLS
- 2022-12-17 Listing Removed — CRMLS
- 2022-10-10 Relisted — CRMLS
- 2022-10-06 Relisted — CRMLS
- 2022-10-06 Price Changed $154,888 CRMLS
- 2022-09-02 Relisted — CRMLS
- 2022-08-31 Listing Removed — CRMLS
- 2022-08-31 Listing Removed — CRMLS
- 2022-07-12 Price Changed $169,888 CRMLS
- 2022-05-18 Relisted — CRMLS
- 2022-05-16 Pending — CRMLS
- 2022-04-20 Contingent — CRMLS
- 2022-02-10 Listed $189,888 CRMLS
Cash-flow waterfall
monthlySold comps — $/sqft
last 12 mo · ≤1 miLoading sold comps…