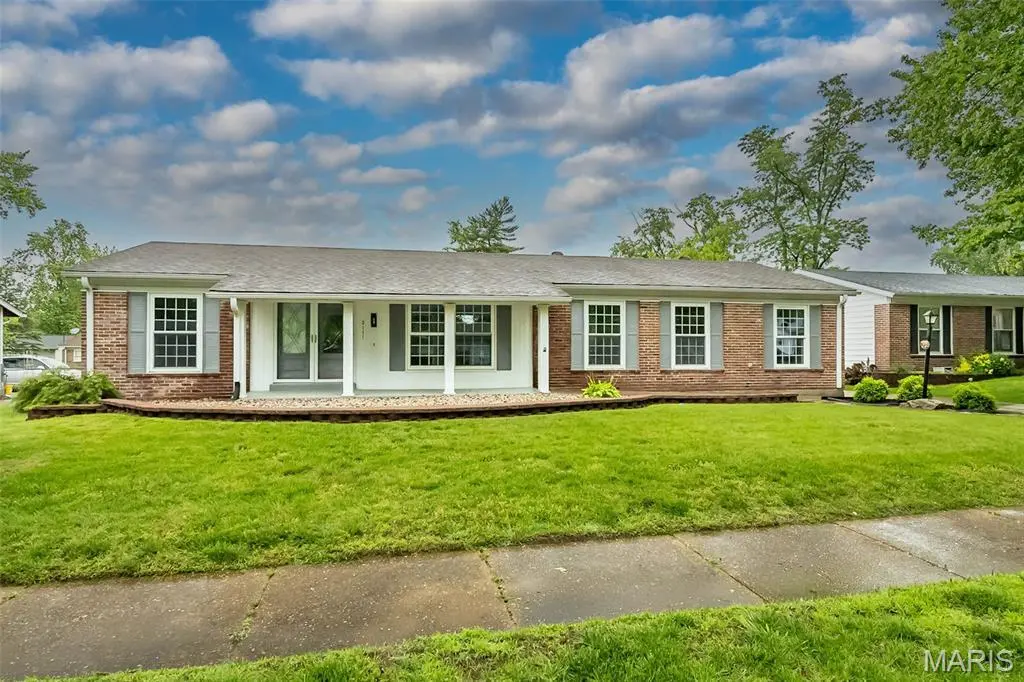
2111 Shoreham Dr · Florissant, MO
Flood risk 1/10 · Minimal
- FEMA flood zone
- X (unshaded)
- Chance of flooding over 30 yrs
- 0.0%
- Est. flood insurance / yr
- $473 – $860
Fire risk 1/10 · Minimal
- Est. fire insurance / yr
- $1,054 – $1,958
Heat risk 5/10 · Moderate
- Hot days now (above 105°F)
- 7 days/yr
- Hot days in 30 yrs
- 21 days/yr
Wind risk 2/10 · Minimal
- Chance of severe wind over 30 yrs
- 1.0%
Air-quality risk 3/10 · Minor
- Unhealthy air days now
- 3 days/yr
- Unhealthy air days in 30 yrs
- 5 days/yr
Risk factors via First Street. Map © Google.
Why this score? — see what drove the D- grade
The composite is a weighted blend of 9 inputs, each scored 0–100. Each bar is that input's sub-score; the figure is the points it added to the 100-point composite (weight × sub-score).
- Appreciation +10.0/10.0
- Cash flow +9.3/30.0
- Rent growth +4.4/5.0
- Livability +3.7/5.0
- DSCR +2.6/10.0
- Condition / age +2.5/5.0
- 1% rule +2.1/10.0
- Schools +1.2/10.0
- ARV discount +0.0/15.0
$274,900
🖨 Deal sheet (PDF) 📄 Offer letter ✓ Due diligence
Listing remarks
This Luxury renovation in Florissant is sure to impress! The 3 bedroom/2 bath ranch home offers original charm with modern updates. As you enter the home, you'll notice the new luxury vinyl tile floors. The open concept living room, dining room and kitchen are perfect for entertaining. The kitchen features new stainless steel appliances, custom cabinets and quartz countertops. The bathrooms have been completed updated with new vanities, custom tile and new fixtures. Downstairs offers an additional large finished space for entertaining with a bonus room for an office. The backyard patio is perfect for entertaining! Rear entry oversized garage makes for a fantastic feature of this home. The e
Key facts
- 0.23 acre lot
- Garage
- Built 1967
Property features AI
Exterior
- Parking: Includes an attached garage
- Utilities: Public water; Private sewer; Electric service by Ameren; Cable available; Electricity available; Natural gas available; Sewer available; Water connected
- Home design: Single-family residence; One level
- Construction: Brick veneer exterior
- Exterior features: Interior, level lot
Interior
- Bedrooms: Three bedrooms, all on the main level
- Bathrooms: Two full bathrooms, both on the main level
- Heating & cooling: Natural gas heating; Central air conditioning
- Interior features: Full unfinished basement with 8+ ft poured concrete; Fireplace (1)
Neighborhood map
What this means for you Summary
Snapshot
- This is a 3-bed/2.0-bath single-family listed at $275k.
Deal economics
- At list price, monthly cash flow is $-201 ($-2k/yr) — negative.
- To cash-flow at today's rent, offer at most $239k (12.9% below list).
- To meet the 1% rule (rent ≥ 1% of price), the offer needs to be $196k (28.6% below list).
- Recommended offer: $196k (28.6% below list) — sets the bar for 1% rule.
Location & tenants
- Location reads 73/100 on livability (#82 in MO) — a middle-class / working-renter tenant base. Strengths: cost of living A+, housing A+, health & safety B+; Watch: crime C-, amenities D+, commute F.
- Ferguson-Florissant R-II (suburban): math 7% / reading 20% proficiency, ranked #311 of 324 in MO (top 96%) — low school quality limits family demand, transient renter base, plan for 1-2y turnover; 70% free/reduced lunch — lower-income household profile, screen leases tightly.
- Zoned schools: Wedgwood 6Th Grade Center (math 6% / reading 20%, grade F, #368 of 391 statewide, top 94%, 307 students, 99% FRL); Cross Keys Middle (math 5% / reading 10%, grade F, #379 of 391 statewide, top 97%, 625 students, 100% FRL); Mccluer North High (math 5% / reading 28%, grade F, #487 of 521 statewide, top 93%, 1,136 students, 100% FRL) — zoned schools average 99% FRL vs 70% district-wide (30 pts higher); higher-poverty schools than district average — tighter screening recommended.
- Market conditions: Rents rising fast (+7.5%/yr); 221 active listings in the ZIP; 13 comparable units currently listed for rent nearby; rentals at typical pace (median 17d on market — plan ~3-4 weeks tenant-placement turnaround); 920 units permitted in St. Louis County in 2024 (250 in 5+ unit buildings).
- This rent runs 35% of the median local income ($67k/yr) — at the standard rent-burdened threshold; future hikes will face affordability resistance.
Forward outlook
- In year one you build about $29k of equity ($2k loan paydown + $27k appreciation (10.0% local appreciation)).
- By year 2, paydown + projected appreciation supports a ~$47k cash-out refi (75% LTV) — recoverable capital for the next deal without selling this one.
Negotiation context
- Only 5 days on market — expect competitive offers; lowballing is unlikely to land.
- Current owner paid $120k; list at $275k implies a 129% gain — meaningful room to come down on a strong offer.
Risks & watch-outs
- Climate carrying-cost: extreme-heat days projected 7→21/yr by 2055 (HVAC capex compounding) — expect insurance premiums to compound above CPI over the hold.
Questions for the listing agent
- What do current leases actually rent for vs. the listed asking? Can we see a recent rent roll and the last 12 months of T-12 income?
- Built in 1967 — when were the roof, HVAC, electrical panel, plumbing, and water heater last replaced?
- Is there a deadline driving the sale (1031 exchange, divorce, estate, relocation)? That informs how much negotiation room exists.
- Schools are D-rated, which usually means shorter tenancies and higher turnover. Who's the typical renter profile here, and what's been the actual vacancy rate?
- The area grade is low — what's the realistic commute time and amenity access for the typical tenant pool here? Any planned neighborhood developments (good or bad) we should know about?
- What's the average days-on-market for RENTAL listings here right now (not sales)? A rising rental-DOM trend means longer vacancies and softer asking-rent achievability than the comps imply.
- What's the recent tenant-quality profile in this submarket — average credit score on applications, eviction rate, late-payment / NSF rate, and stable-employment percentage? A property-management company in the area should have these aggregated.
- How much new for-sale + rental construction is in the pipeline within 1–3 miles? Heavy new supply typically softens prices + rents 12–24 months out; constrained supply supports both.
Investment metrics
- 1% rule
- 0.71% ✗
- Cap rate
- 5.41%
- Cash-on-cash
- -3.14%
- DSCR
- 0.86
- GRM
- 11.7
CMA / ARV
- ARV (on-the-fly)
- $198,912
- Comps found
- 12
Show comp detail 12 sales within ~0.75 mi
| Address | Dist | Beds/Ba | Sqft | Sold | Price | $/sf | Match |
|---|---|---|---|---|---|---|---|
| 7 Darwin Ct | 0.22mi | 4/2.0 (+1) | 1,560 (+0%) | 0mo | $200,000 | $128 | 84 |
| 2910 Wellington Dr | 0.26mi | 4/2.0 (+1) | 1,517 (-2%) | 2mo | $159,900 | $105 | 78 |
| 2945 Dover Dr | 0.16mi | 4/2.0 (+1) | 1,470 (-5%) | 2mo | $185,400 | $126 | 76 |
| 2940 Dover Dr | 0.19mi | 3/2.0 | 1,402 (-10%) | 1mo | $210,000 | $150 | 74 |
| 4 Cameo Ct | 0.35mi | 3/2.5 | 1,405 (-10%) | 1mo | $150,000 | $107 | 65 |
| 2405 Orleans Ln | 0.41mi | 3/1.5 | 1,424 (-8%) | 2mo | $239,900 | $168 | 64 |
| 490 Jana Dr | 0.54mi | 4/3.0 (+1) | 1,600 (+3%) | 1mo | $195,000 | $122 | 60 |
| 2560 Woodsage Dr | 0.44mi | 3/3.0 | 1,390 (-11%) | 1mo | $220,000 | $158 | 57 |
| 549 Rancho Ln | 0.61mi | 3/3.0 | 1,432 (-8%) | 1mo | $279,000 | $195 | 54 |
| 2270 Patterson Rd | 0.72mi | 3/1.0 | 1,625 (+5%) | 3mo | $169,900 | $105 | 52 |
| 2590 Hackney Dr | 0.72mi | 3/2.0 | 1,699 (+9%) | 2mo | $175,000 | $103 | 50 |
| 13 Lancaster Ct | 0.74mi | 3/2.0 | 1,786 (+15%) | 1mo | $250,000 | $140 | 40 |
Match score weights: distance 35% · size 25% · config 20% · recency 20%. Top-matched comps best support the ARV.
Projected returns pro-forma
10.0% appreciation · 7.51% rent growth · sell at horizon
- IRR
- 23.3%
- Equity multiple
- 2.90×
- Total profit
- $146,144
- Equity at exit
- $247,652
- IRR
- 21.8%
- Equity multiple
- 7.01×
- Total profit
- $462,960
- Equity at exit
- $534,070
Cash invested: $76,972 (down + closing). Projections, not guarantees.
Landlord ↔ Tenant lean methodology
- Overall (STATE)
- 81 Strongly Landlord-Friendly
- State Missouri
- 81 Strongly Landlord-Friendly · R+10
- County
- — inherits STATE
- City
- — inherits STATE
ZIP-level market 63033
- Home prices YoY
- 2.5%
- Rents YoY
- 7.5%
- Active inventory
- 221
- Price-to-rent
- 11.7×
Monthly cashflow live
- Estimated rent
- $1,963 high interval (Pro) →
- Mortgage (P&I)
- −$1,442
- Tax from tax record
- −$196 /mo · $2,347/yr
- Insurance
- −$115
- HOA
- −$0
- Vacancy / Maint / Mgmt
- −$412
- Net cashflow
- $-201
Break-even live
Sensitivity live
| Price | -10% $-46 | -5% $-124 | +0% $-201 | +5% $-279 | +10% $-357 |
|---|---|---|---|---|---|
| Rent | -10% $-356 | -5% $-279 | +0% $-201 | +5% $-124 | +10% $-46 |
| Rate | -1.0pp $-63 | -0.5pp $-131 | base $-201 | +0.5pp $-273 | +1.0pp $-345 |
UW: 25.0% down · 7.5% · 30yr · 1.5% tax · 5.0% vac · 8.0% maint · 8.0% mgmt
Financing live
Cash to close
- Down payment
- $68,725
- Closing costs
- $8,247
- Reserves months
- —
- Total cash needed
- —
Loan-product check · same deal, 3 products live
Conventional
25% down · 7.5% · 30yr
- Down + closing
- —
- Monthly P&I
- —
- Monthly cashflow
- —
- DSCR
- —
- Eligible?
- —
Personal DTI + credit; lowest rate.
DSCR
20% down · 8.5% · 30yr
- Down + closing
- —
- Monthly P&I
- —
- Monthly cashflow
- —
- DSCR
- —
- Eligible?
- —
No personal income docs; deal must DSCR.
Hard money
10% down · 12.0% · 12mo
- Down + closing
- —
- Monthly P&I
- —
- Monthly cashflow
- —
- DSCR
- —
- Eligible?
- —
Short-term bridge; refi at stabilization.
Rent comps 13 comps
| Address | Beds | Baths | Sqft | Rent | $/sqft | DOM | Units | Dist |
|---|---|---|---|---|---|---|---|---|
| 13 Cricket Ct Florissant, MO | 4.0 | 3.0 | 1560 | $2,550 | $1.63 | 45d | 1 | 0.39mi |
| 560 Bardot Dr Florissant, MO | 3.0 | 2.0 | 1976 | $1,875 | $0.95 | 0d | 1 | 0.61mi |
| 1740 Deborah Dr Florissant, MO | 3.0 | 2.5 | 1650 | $1,750 | $1.06 | 19d | 1 | 0.64mi |
| 1785 Trotter Way Florissant, MO | 3.0 | 2.0 | 1297 | $1,806 | $1.39 | 9d | 1 | 0.74mi |
| 3 Champlain Ct Florissant, MO | 3.0 | 1.0 | 1100 | $1,600 | $1.45 | 45d | 1 | 0.94mi |
| 1600 Horseshoe Dr Florissant, MO | 3.0 | 2.0 | 1314 | $1,550 | $1.18 | 45d | 1 | 0.99mi |
| 3 Cantabrian Ct Florissant, MO | 3.0 | 2.0 | 1436 | $1,881 | $1.31 | 16d | 1 | 1.14mi |
| 1095 Humes Ln Florissant, MO | 3.0 | 1.5 | 1100 | $1,650 | $1.50 | 6d | 1 | 1.20mi |
| 4 Sharon Ct Florissant, MO | 3.0 | 2.0 | 1108 | $1,800 | $1.62 | 0d | 1 | 1.26mi |
| 945 Paddock Dr Florissant, MO | 4.0 | 2.0 | 1875 | $1,850 | $0.99 | 6d | 1 | 1.32mi |
| 1145 Swallow Ln Florissant, MO | 3.0 | 2.0 | 1288 | $1,645 | $1.28 | 5d | 1 | 1.35mi |
| 2075 Cordoba Dr Florissant, MO | 3.0 | 2.0 | 1523 | $1,850 | $1.21 | 16d | 1 | 1.37mi |
| 1395 Bluebird Dr Florissant, MO | 3.0 | 2.0 | 1168 | $1,599 | $1.37 | 18d | 1 | 1.48mi |
Listing history 3 events
-
2026-05-20$274,900 Active
-
2026-05-20historical $274,900
-
2001-08-29soldstatus $119,900
ⓘ Source: listings_history table (triggers on properties + properties_extension) + one-shot
backfill from property_details.listing_events for pre-trigger history.
Tax reassessment forecast MO · Resets to sale price
- Current annual tax
- $2,347 · $196/mo
- Projected year-2 tax
- $2,667 · $222/mo
- Expected delta
- +$319/yr (+$27/mo · 13.6%)
ⓘ Screening estimate from a state-policy table — verify with the county assessor before closing.
Climate risk First Street
- Flood 1/10 Low FEMA zone X (unshaded) · 0% chance over 30 yrs
- Wildfire 1/10 Low
- Heat 5/10 Major 7 d/yr ≥105°F today · 21 d/yr by 30 yrs out
- Wind 2/10 Low 100% chance of damaging wind over 30 yrs
- Air quality 3/10 Moderate 3 unhealthy d/yr today · 5 by 30 yrs out
Nearby sold comps map
Loading sold comps map…
Walkable amenities ~0.75 mi
Loading nearby amenities…
Taxation est. · year 1
- Rental income
- $23,551
- − Mortgage interest
- −$15,399
- − Property taxes
- −$2,347
- − Insurance
- −$1,374
- − Repairs & maintenance
- −$1,884
- − Management
- −$1,884
- − Depreciation
- −$7,997
- Taxable loss
- −$7,335
- Est. tax savings @ 24.0%
- +$1,760
- After-tax cash flow
- $-656/yr
For passive investors: Depreciation is non-cash, so a rental often shows a tax loss while cash-flowing — sheltering income. Rental losses are passive: they offset passive income freely, and up to $25,000/yr can offset ordinary (W-2) income if you actively participate and your MAGI is under $100k (phasing out to $0 by $150k); unused losses carry forward. On sale, claimed depreciation is recaptured at up to 25%, and gains may owe capital-gains tax (a 1031 exchange can defer both). Figures are a year-1 estimate at your 24.0% rate — not tax advice; consult a CPA.
Schools (NCES district)
- District
- Ferguson-Florissant R-II
- NCES district ID
- 2912010
- Math proficiency
- 7% ▼ -9.00%
- Reading proficiency
- 20% ▼ -6.00%
- Median HH income
- $44,610
- Composite
- 11.96/100
- National rank
- #9666
- State rank
- #311 of 324 in MO
Livability — Florissant
- Score
- 73/100
- State rank
- #82
- US rank
- #5406
Category grades
Schools grade is shown separately in the Schools card above.
Census & demographics
- County
- Saint Louis County · 888,823 people
- City population
- 69,104
- Metro
- St. Louis, MO-IL
- Population (ZIP)
- 43,056
- Household income
- $66,776
- Rent vs Own
- Severe rent burden
- 1429.0
Population outlook (St. Louis County) Hauer SSP2
- Today (2025)
- 1,025,227 people
- By 2030
- 1,028,023 · +0.3%
- By 2040
- 1,020,940 · -0.4%
- By 2050
- 1,007,280 · -1.8%
- By 2075
- 987,277 · -3.7%
- By 2100
- 921,984 · -10.1%
Race, ethnicity, and origin ACS 2023
- Neighborhood character
- Predominantly Black (71%)
- Race & ethnicity
- Black 71% White 23% Two or more races 4% Hispanic / Latino 1%
- Common ancestry
- Romanian 1% Lithuanian 1% Italian 1%
- Foreign-born
- 3% · Canada, Vietnam
- Languages at home
- 95% English-only · Spanish 1% French/Haitian/Cajun 1%
Political lean MEDSL · St. Louis
- 2024 margin
- Strong D (+23.4) · D 60.8% · R 37.4% · Other 1.7%
- 2008→2024 swing
- +3.5pp toward D · 2008: 19.9pp · 2024: 23.4pp
- All cycles
- 2024: D+23.4 2020: D+24.0 2016: D+16.2 2012: D+13.7 2008: D+19.9
Not yet ingested
- Civics
- —
Market trends
- HPI YoY
- ▲ 13.78%
- Current HPI
- 570.6
- Rent YoY
- ▲ 7.51%
- Metro
- St. Louis, MO-IL
- State GDP YoY
- ▲ 1.84%
- F500 in state
- 20
Industry mix (Fortune 500 HQ in MO)
| Industry | F500 HQs | Revenue |
|---|---|---|
| Healthcare | 1 | $163B |
|
||
| Insurance | 1 | $21B |
|
||
| Industrial Technology | 1 | $17B |
|
||
| Retail | 1 | $16B |
|
||
| Industrial Distribution | 1 | $10B |
|
||
| Utilities | 1 | $9B |
|
||
Price history
+129.3% since first listed3 events — show timeline
- 2026-05-20 Listed $274,900 MARIS as Distributed by MLS Grid
- 2026-05-20 Coming Soon $274,900 MARIS as Distributed by MLS Grid
- 2001-08-29 Sold (Public Records) $119,900 Public Records
Property tax history
+0.7%/yrLatest (2022): $2,347 · +0.3% YoY. Source: county tax records.
Cash-flow waterfall
monthlySold comps — $/sqft
last 12 mo · ≤1 miLoading sold comps…