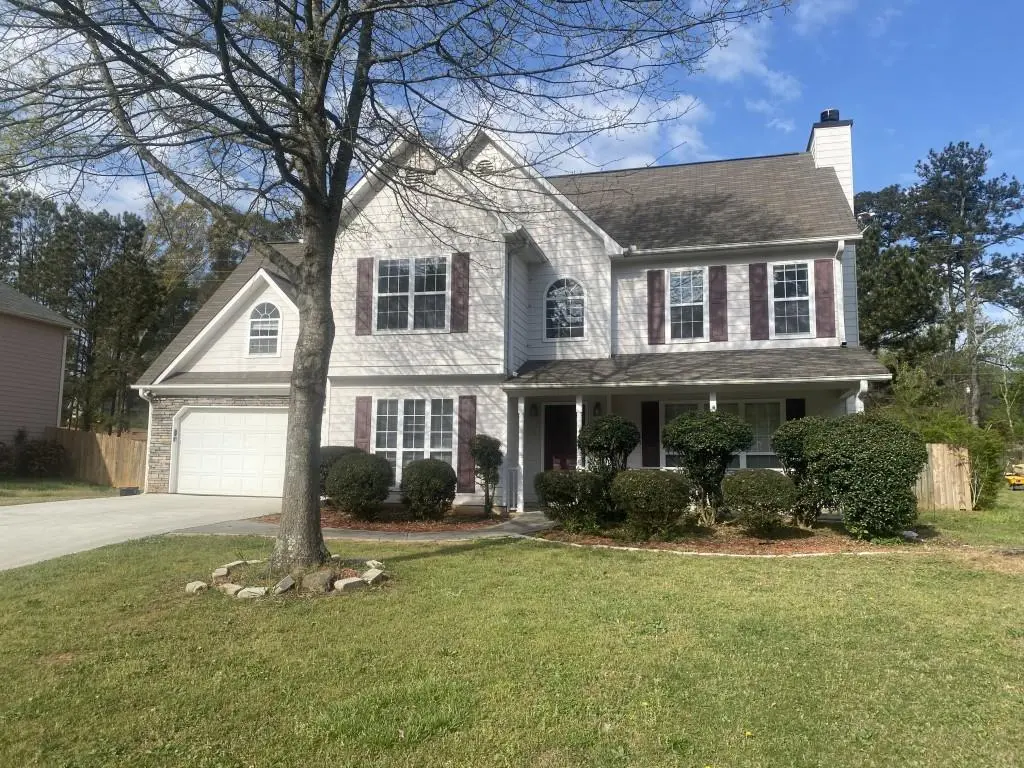
5132 Meadows Lake Dr · Austell, GA
Flood risk 4/10 · Minor
- FEMA flood zone
- X (unshaded)
- Chance of flooding over 30 yrs
- 0.22%
- Est. flood insurance / yr
- $507 – $1,088
Fire risk 4/10 · Minor
- Est. fire insurance / yr
- $963 – $1,789
Heat risk 5/10 · Moderate
- Hot days now (above 103°F)
- 7 days/yr
- Hot days in 30 yrs
- 18 days/yr
Wind risk 6/10 · Moderate
- Chance of severe wind over 30 yrs
- 27.0%
Air-quality risk 4/10 · Minor
- Unhealthy air days now
- 4 days/yr
- Unhealthy air days in 30 yrs
- 5 days/yr
Risk factors via First Street. Map © Google.
Why this score? — see what drove the D+ grade
The composite is a weighted blend of 9 inputs, each scored 0–100. Each bar is that input's sub-score; the figure is the points it added to the 100-point composite (weight × sub-score).
- ARV discount +15.0/15.0
- Cash flow +13.4/30.0
- DSCR +4.0/10.0
- Schools +3.8/10.0
- 1% rule +3.6/10.0
- Livability +3.4/5.0
- Rent growth +2.7/5.0
- Condition / age +2.5/5.0
- Appreciation +0.0/10.0
$299,000
🖨 Deal sheet 📄 Offer letter ✓ Due diligence
Listing remarks MLS
Discover the charm and opportunity of this spacious home nestled in the desirable Meadows Lake community. This property offers a fantastic layout and great bones just waiting for your vision and a little TLC to make it truly shine
Key facts
- 0.46 acre lot
- 2 garage spots
- Built 1999
Neighborhood map
What this means for you Summary
Snapshot
- This is a 4-bed/2.5-bath single-family listed at $299k.
Deal economics
- At list price, monthly cash flow is $4 ($51/yr) — positive.
- The deal already cash-flows at list — no discount required.
- To meet the 1% rule (rent ≥ 1% of price), the offer needs to be $257k (14.0% below list).
- Recommended offer: $257k (14.0% below list) — sets the bar for 1% rule.
- Cap rate 6.3% vs local median 4.7% in Austell — top-decile yield for the area; either an underpriced asset or a hidden risk that comps aren't pricing in. Stress-test before assuming the spread holds.
Location & tenants
- Location reads 67/100 on livability (#175 in GA) — a middle-class / working-renter tenant base. Strengths: cost of living A+, housing A+; Watch: employment D+, schools D-, amenities F.
- Cobb County (suburban): math 39% / reading 45% proficiency, ranked #25 of 174 in GA (top 14%) — families likely to look elsewhere, expect single-tenant / working-renter base with shorter leases.
- Market conditions: Rents flat; 650 active listings in the ZIP; 11 comparable units currently listed for rent nearby; rentals at typical pace (median 21d on market — plan ~3-4 weeks tenant-placement turnaround); high-income renter base; 1,625 units permitted in Cobb County in 2024 (389 in 5+ unit buildings).
Forward outlook
- Local home prices are declining (-3.0%/yr); year-one equity from $2k of loan paydown is wiped out by about $9k of value loss. Plan a longer hold.
- Cobb County population projected at +33% by 2050 — long-run rental-demand tailwind backs the buy-and-hold thesis.
Negotiation context
- It's been on market 78 days — a 6% lower offer ($281k) is reasonable based on typical stale-listing flexibility.
- 8 sale attempts since 19y ago; this cycle's ask has dropped $26k (8%) from the opening price — seller is motivated, your offer sets the floor, not the list.
Risks & watch-outs
- Climate carrying-cost: major wind risk, 27% chance of damaging wind over 30y; extreme-heat days projected 7→18/yr by 2055 (HVAC capex compounding) — expect insurance premiums to compound above CPI over the hold.
Questions for the listing agent
- It's been on market 78 days. Have you received any prior offers? Is the seller open to a 14% concession, seller financing, or rate buy-down credit?
- Why hasn't it sold? Are there any deal-killer items the seller is aware of (foundation, flood, title, zoning, code violations)?
- Is there a deadline driving the sale (1031 exchange, divorce, estate, relocation)? That informs how much negotiation room exists.
- Schools are D-rated, which usually means shorter tenancies and higher turnover. Who's the typical renter profile here, and what's been the actual vacancy rate?
- The area grade is low — what's the realistic commute time and amenity access for the typical tenant pool here? Any planned neighborhood developments (good or bad) we should know about?
- What's the average days-on-market for RENTAL listings here right now (not sales)? A rising rental-DOM trend means longer vacancies and softer asking-rent achievability than the comps imply.
- What's the recent tenant-quality profile in this submarket — average credit score on applications, eviction rate, late-payment / NSF rate, and stable-employment percentage? A property-management company in the area should have these aggregated.
- How much new for-sale + rental construction is in the pipeline within 1–3 miles? Heavy new supply typically softens prices + rents 12–24 months out; constrained supply supports both.
Investment metrics
- 1% rule
- 0.86% ✗
- Cap rate
- 6.31%
- Cash-on-cash
- 0.06%
- DSCR
- 1.00
- GRM
- 9.7
CMA / ARV
- ARV (median comp)
- $362,581
- List price
- $299,000
- Delta
- -17.54%
- Verdict
- UNDERPRICED
- Comps
- 20 within 1.0 mi
Show comp detail 12 sales within ~0.75 mi
| Address | Dist | Beds/Ba | Sqft | Sold | Price | $/sf | Match |
|---|---|---|---|---|---|---|---|
| 5416 Sweetsprings Dr SW | 0.36mi | 4/3.0 | 2,277 (+3%) | 6mo | $330,000 | $145 | 71 |
| 4280 Chads Park Dr | 0.18mi | 4/3.0 | 2,453 (+11%) | 2mo | $335,000 | $137 | 69 |
| 4505 Laurie Ln | 0.46mi | 4/2.0 | 2,170 (-2%) | 8mo | $254,000 | $117 | 67 |
| 4573 Westview Dr | 0.55mi | 4/3.0 | 2,082 (-6%) | 2mo | $325,000 | $156 | 61 |
| 5497 Sweetsprings Dr SW | 0.46mi | 4/3.0 | 2,068 (-6%) | 9mo | $370,000 | $179 | 58 |
| 4107 Springridge Ct | 0.57mi | 3/2.5 (-1) | 2,156 (-2%) | 8mo | $230,000 | $107 | 58 |
| 5081 Hubert Dr | 0.35mi | 3/2.0 (-1) | 2,042 (-8%) | 8mo | $299,500 | $147 | 57 |
| 4490 Epworth Ct | 0.47mi | 3/2.0 (-1) | 2,336 (+6%) | 8mo | $348,500 | $149 | 55 |
| 5329 Memorial Ln | 0.27mi | 3/2.0 (-1) | 1,888 (-15%) | 2mo | $315,000 | $167 | 55 |
| 4825 Rollins Dr | 0.74mi | 3/2.5 (-1) | 2,024 (-8%) | 0mo | $545,000 | $269 | 46 |
| 5452 Sweetsprings Dr | 0.54mi | 5/3.0 (+1) | 2,415 (+9%) | 8mo | $399,000 | $165 | 46 |
| 4807 Norma Ln | 0.53mi | 3/2.0 (-1) | 1,914 (-13%) | 2mo | $288,000 | $150 | 44 |
Match score weights: distance 35% · size 25% · config 20% · recency 20%. Top-matched comps best support the ARV.
Projected returns pro-forma
-3.0% appreciation · 0.74% rent growth · sell at horizon
- IRR
- -18.7%
- Equity multiple
- 0.36×
- Total profit
- $-53,885
- Equity at exit
- $44,582
- IRR
- -16.4%
- Equity multiple
- 0.18×
- Total profit
- $-68,947
- Equity at exit
- $25,852
Cash invested: $83,720 (down + closing). Projections, not guarantees.
Landlord ↔ Tenant lean methodology
- Overall (STATE)
- 90 Strongly Landlord-Friendly
- State Georgia
- 90 Strongly Landlord-Friendly · R+3
- County
- — inherits STATE
- City
- — inherits STATE
ZIP-level market 30127
- Rents YoY
- 0.7%
- Active inventory
- 650
- Price-to-rent
- 9.7×
Monthly cashflow live
- Estimated rent
- $2,573 high interval (Pro) →
- Mortgage (P&I)
- −$1,568
- Tax from tax record
- −$336 /mo · $4,027/yr
- Insurance
- −$125
- HOA
- −$0
- Vacancy / Maint / Mgmt
- −$540
- Net cashflow
- $4
Break-even live
UW: 25.0% down · 7.5% · 30yr · 1.5% tax · 5.0% vac · 8.0% maint · 8.0% mgmt
Financing live
Cash to close
- Down payment
- $74,750
- Closing costs
- $8,970
- Reserves months
- —
- Total cash needed
- —
Loan-product check · same deal, 3 products live
Conventional
25% down · 7.5% · 30yr
- Down + closing
- —
- Monthly P&I
- —
- Monthly cashflow
- —
- DSCR
- —
- Eligible?
- —
Personal DTI + credit; lowest rate.
DSCR
20% down · 8.5% · 30yr
- Down + closing
- —
- Monthly P&I
- —
- Monthly cashflow
- —
- DSCR
- —
- Eligible?
- —
No personal income docs; deal must DSCR.
Hard money
10% down · 12.0% · 12mo
- Down + closing
- —
- Monthly P&I
- —
- Monthly cashflow
- —
- DSCR
- —
- Eligible?
- —
Short-term bridge; refi at stabilization.
Rent comps 11 comps
| Address | Beds | Baths | Sqft | Rent | $/sqft | DOM | Units | Dist |
|---|---|---|---|---|---|---|---|---|
| 5330 Sweetsprings Way SW Powder Springs, GA | 5.0 | 3.0 | 2369 | $2,625 | $1.11 | 20d | 1 | 0.44mi |
| 5315 Paddington Ln Powder Springs, GA | 3.0 | 2.5 | 2009 | $2,145 | $1.07 | 24d | 1 | 0.50mi |
| 5315 Paddington Ln Powder Springs, GA | 3.0 | 2.5 | 2009 | $2,145 | $1.07 | 20d | 1 | 0.50mi |
| 5550 Pemrock Ct Powder Springs, GA | 3.0 | 3.0 | 1613 | $2,135 | $1.32 | 24d | 1 | 0.75mi |
| 5042 Rosemeade Ct Powder Springs, GA | 4.0 | 2.5 | 3000 | $2,800 | $0.93 | 4d | 1 | 0.95mi |
| 4961 Brownwood Dr Powder Springs, GA | 3.0 | 2.5 | 1747 | $2,100 | $1.20 | 43d | 1 | 1.10mi |
| 4040 Brookfield Way Austell, GA | 4.0 | 2.5 | 2083 | $2,430 | $1.17 | 17d | 1 | 1.18mi |
| 4020 Brookfield Way Austell, GA | 4.0 | 3.0 | 1934 | $2,136 | $1.10 | 24d | 1 | 1.20mi |
| 3959 Morning Dew Ct Powder Springs, GA | 4.0 | 3.0 | 1746 | $5,900 | $3.38 | 43d | 1 | 1.42mi |
| 5955 Water Oaks Dr Austell, GA | 4.0 | 2.0 | 1490 | $2,176 | $1.46 | 12d | 1 | 1.45mi |
| 4493 Brownsville Rd Powder Springs, GA | 1.0–3.0 | 1.0–2.0 | 1095 | $2,684 | $2.45 | 1d | 18 | 1.45mi |
Listing history 41 events
-
2026-06-18days on market $299,000 Active 78 DOM
-
2026-06-17days on market $299,000 Active 77 DOM
-
2026-06-16days on market $299,000 Active 76 DOM
-
2026-06-15days on market $299,000 Active 75 DOM
-
2026-06-13days on market $299,000 Active 73 DOM
-
2026-06-13days on market $299,000 Active 72 DOM
-
2026-06-09days on market $299,000 Active 69 DOM
-
2026-06-08days on market $299,000 Active 68 DOM
-
2026-06-07days on market $299,000 Active 67 DOM
-
2026-06-04days on market $299,000 Active 64 DOM
-
2026-06-03days on market $299,000 Active 63 DOM
-
2026-06-02pricedays on market $299,000 Active 62 DOM
-
2026-06-01days on market $310,000 Active 61 DOM
-
2026-05-31days on market $310,000 Active 60 DOM
-
2026-04-17price $310,000 230-char remark
Show marketing remark (230 chars)
Discover the charm and opportunity of this spacious home nestled in the desirable Meadows Lake community. This property offers a fantastic layout and great bones just waiting for your vision and a little TLC to make it truly shine
-
2026-04-01$325,000 New 230-char remark
Show marketing remark (230 chars)
Discover the charm and opportunity of this spacious home nestled in the desirable Meadows Lake community. This property offers a fantastic layout and great bones just waiting for your vision and a little TLC to make it truly shine
-
2026-04-01$325,000 Active 230-char remark
Show marketing remark (230 chars)
Discover the charm and opportunity of this spacious home nestled in the desirable Meadows Lake community. This property offers a fantastic layout and great bones just waiting for your vision and a little TLC to make it truly shine
-
2025-12-11historical $2,099
-
2025-12-07price $2,099
-
2025-12-02price $2,149
-
2025-11-26price $2,199
-
2025-11-05price $2,219
-
2025-10-24$2,249
-
2023-10-24historical $2,049
-
2023-10-20$2,049
-
2018-06-28soldstatus $849,000
-
2017-09-18soldstatus $144,000
-
2017-09-14soldstatus $144,000 Sold
-
2017-08-28historical Contingent - Due Diligence
-
2017-08-14price $160,000
-
2017-08-12status Active
-
2017-08-04historical Contingent - Due Diligence
-
2017-08-01status Active
-
2017-07-26historical Contingent - Due Diligence
-
2017-07-20$171,000 Active
-
2007-08-08soldstatus $145,000
-
2007-07-30soldstatus $145,000
-
2007-01-22$154,500
-
2003-07-02soldstatus $169,000
-
1999-12-14soldstatus $135,900
ⓘ Source: listings_history table (triggers on properties + properties_extension) + one-shot
backfill from property_details.listing_events for pre-trigger history.
Tax reassessment forecast GA · Resets to sale price
- Current annual tax
- $4,027 · $336/mo
- Projected year-2 tax
- $4,027 · $336/mo
- Expected delta
- $0/yr ($0/mo · 0.0%)
ⓘ Screening estimate from a state-policy table — verify with the county assessor before closing.
Climate risk First Street
- Flood 4/10 Moderate FEMA zone X (unshaded) · 22% chance over 30 yrs
- Wildfire 4/10 Moderate
- Heat 5/10 Major 7 d/yr ≥103°F today · 18 d/yr by 30 yrs out
- Wind 6/10 Major 27% chance of damaging wind over 30 yrs
- Air quality 4/10 Moderate 4 unhealthy d/yr today · 5 by 30 yrs out
Nearby sold comps map
Loading sold comps map…
Walkable amenities ~0.75 mi
Loading nearby amenities…
Taxation est. · year 1
- Rental income
- $30,873
- − Mortgage interest
- −$16,749
- − Property taxes
- −$4,027
- − Insurance
- −$1,495
- − Repairs & maintenance
- −$2,470
- − Management
- −$2,470
- − Depreciation
- −$8,698
- Taxable loss
- −$5,036
- Est. tax savings @ 24.0%
- +$1,209
- After-tax cash flow
- $1,260/yr
For passive investors: Depreciation is non-cash, so a rental often shows a tax loss while cash-flowing — sheltering income. Rental losses are passive: they offset passive income freely, and up to $25,000/yr can offset ordinary (W-2) income if you actively participate and your MAGI is under $100k (phasing out to $0 by $150k); unused losses carry forward. On sale, claimed depreciation is recaptured at up to 25%, and gains may owe capital-gains tax (a 1031 exchange can defer both). Figures are a year-1 estimate at your 24.0% rate — not tax advice; consult a CPA.
Schools (NCES district)
- District
- Cobb County
- NCES district ID
- 1301290
- Math proficiency
- 39% ▼ -15.00%
- Reading proficiency
- 45% ▼ -10.00%
- Median HH income
- $68,845
- Composite
- 37.93/100
- National rank
- #4308
- State rank
- #25 of 174 in GA
Livability — Austell
- Score
- 67/100
- State rank
- #175
- US rank
- #11059
Category grades
Schools grade is shown separately in the Schools card above.
Census & demographics
- County
- Cobb County · 777,758 people
- City population
- 49,719
- Metro
- Atlanta-Sandy Springs-Alpharetta, GA
- Population (ZIP)
- 71,626
- Household income
- $110,904
- Rent vs Own
- Severe rent burden
- 912.0
Population outlook (Cobb County) Hauer SSP2
- Today (2025)
- 868,385 people
- By 2030
- 929,614 · +7.1%
- By 2040
- 1,047,533 · +20.6%
- By 2050
- 1,155,537 · +33.1%
- By 2075
- 1,405,030 · +61.8%
- By 2100
- 1,555,058 · +79.1%
Race, ethnicity, and origin ACS 2023
- Neighborhood character
- Diverse neighborhood (Simpson 0.65)
- Race & ethnicity
- Black 45% White 37% Hispanic / Latino 11% Two or more races 7% Asian 1% Native American 1%
- Hispanic origin (detail)
- Mexican 4% Puerto Rican 2%
- Common ancestry
- Hispanic 2% Italian 1% Lithuanian 1%
- Foreign-born
- 12% · Canada, Vietnam
- Languages at home
- 85% English-only · Spanish 8% French/Haitian/Cajun 2% Other Indo-European 1%
Political lean MEDSL · Cobb
- 2024 margin
- D (+14.9) · D 56.9% · R 42.0% · Other 1.1%
- 2008→2024 swing
- +24.3pp toward D · 2008: -9.4pp · 2024: 14.9pp
- All cycles
- 2024: D+14.9 2020: D+14.3 2016: D+2.1 2012: R+12.6 2008: R+9.4
Not yet ingested
- Civics
- —
Market trends
- HPI YoY
- ▼ -161.28%
- Current HPI
- 222.6123
- Rent YoY
- ▲ 0.74%
- Metro
- Atlanta-Sandy Springs-Alpharetta, GA
- State GDP YoY
- ▲ 2.66%
- F500 in state
- 28
Industry mix (Fortune 500 HQ in GA)
| Industry | F500 HQs | Revenue |
|---|---|---|
| Paper / Packaging | 2 | $29B |
|
||
| Retail | 1 | $160B |
|
||
| Transportation / Logistics | 1 | $91B |
|
||
| Airlines | 1 | $62B |
|
||
| Consumer Goods | 1 | $47B |
|
||
| Utilities | 1 | $25B |
|
||
Price history
+128.1% since first listed27 events — show timeline
- 2026-04-17 Price Changed $310,000 GAMLS
- 2026-04-17 Price Changed $310,000 FMLS
- 2026-04-01 Listed $325,000 FMLS
- 2026-04-01 Listed $325,000 GAMLS
- 2025-12-11 Rental Removed $2,099 Tricon
- 2025-12-07 Price Changed $2,099 Tricon
- 2025-12-02 Price Changed $2,149 Tricon
- 2025-11-26 Price Changed $2,199 Tricon
- 2025-11-05 Price Changed $2,219 Tricon
- 2025-10-24 Listed for Rent $2,249 Tricon
- 2023-10-24 Rental Removed $2,049 RENT.
- 2023-10-20 Listed for Rent $2,049 RENT.
- 2018-06-28 Sold (Public Records) $849,000 Public Records
- 2017-09-18 Sold (Public Records) $144,000 Public Records
- 2017-09-14 Sold (MLS) $144,000 FMLS
- 2017-08-28 Contingent — FMLS
- 2017-08-14 Price Changed $160,000 FMLS
- 2017-08-12 Relisted — FMLS
- 2017-08-04 Contingent — FMLS
- 2017-08-01 Relisted — FMLS
- 2017-07-26 Contingent — FMLS
- 2017-07-20 Listed $171,000 FMLS
- 2007-08-08 Sold (Public Records) $145,000 Public Records
- 2007-07-30 Sold (MLS) $145,000 FMLS
- 2007-01-22 Listed $154,500 FMLS
- 2003-07-02 Sold (Public Records) $169,000 Public Records
- 1999-12-14 Sold (Public Records) $135,900 Public Records
Property tax history
+4.6%/yrLatest (2025): $4,027 · -0.1% YoY. Source: county tax records.
Cash-flow waterfall
monthlySold comps — $/sqft
last 12 mo · ≤1 miLoading sold comps…