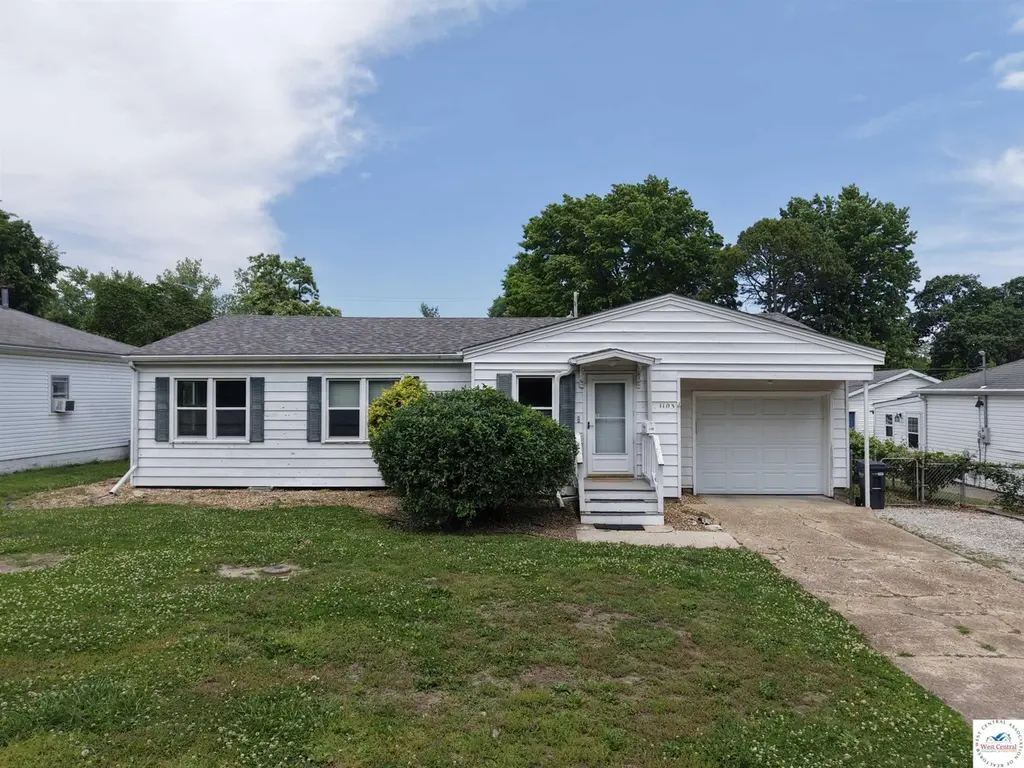
1103 E 17th St · Sedalia, MO
Flood risk 1/10 · Minimal
- FEMA flood zone
- X (unshaded)
- Chance of flooding over 30 yrs
- 0.0%
- Est. flood insurance / yr
- $473 – $860
Fire risk 3/10 · Minor
- Est. fire insurance / yr
- $1,054 – $1,958
Heat risk 4/10 · Minor
- Hot days now (above 106°F)
- 7 days/yr
- Hot days in 30 yrs
- 18 days/yr
Wind risk 2/10 · Minimal
- Chance of severe wind over 30 yrs
- —
Air-quality risk 2/10 · Minimal
- Unhealthy air days now
- 0 days/yr
- Unhealthy air days in 30 yrs
- 1 days/yr
Risk factors via First Street. Map © Google.
Why this score? — see what drove the D- grade
The composite is a weighted blend of 9 inputs, each scored 0–100. Each bar is that input's sub-score; the figure is the points it added to the 100-point composite (weight × sub-score).
- Cash flow +13.9/30.0
- ARV discount +5.1/15.0
- DSCR +4.2/10.0
- Schools +3.9/10.0
- Livability +3.6/5.0
- 1% rule +2.8/10.0
- Rent growth +2.5/5.0
- Condition / age +2.5/5.0
- Appreciation +0.0/10.0
$175,000
🖨 Deal sheet 📄 Offer letter ✓ Due diligence
Listing remarks
Step inside this charming 3-bedroom home offering spacious rooms throughout. The inviting living room features beautiful original hardwood floors and carpet, creating a warm and welcoming space to relax or entertain. The eat-in kitchen provides plenty of room for gatherings, while each bedroom offers large closets for exceptional storage. Outside, you’ll love the convenience of the attached garage plus an oversized detached 2-car garage with plenty of space for a workshop, hobbies, or extra storage. The fenced backyard is perfect for pets, play, or enjoying evenings outdoors. Conveniently located near Centennial Park and Parkview School, this home offers comfort, space, and a fantasti
Key facts
- Attached garage
- Large closets
- Eat-in kitchen
Tags
Property features AI
Exterior
- Parking: 3 total parking spaces; 3 covered spaces; 3-car garage with garage door opener
- Utilities: Public water; Public sewer; 220V electric service; Natural gas available
- Home design: Single-family residence; Residential property
- Construction: Metal siding; Composition roof
- Exterior features: Covered porch; Patio/porch; Fenced backyard with chain link fence; Shed(s)
Interior
- Kitchen: Electric oven; Electric range; Double oven; Disposal; Microwave; Refrigerator; Dishwasher; Electric water heater
- Flooring: Carpet; Wood; Other
- Bathrooms: 1 full bathroom
- Heating & cooling: Natural gas heating; Central air conditioning; Electric cooling; Attic fan; Ceiling fan(s)
- Interior features: Ceiling fans; Window coverings and drapes; Crawl space basement
Neighborhood map
What this means for you Summary
Snapshot
- This is a 3-bed/1.0-bath single-family listed at $175k.
Deal economics
- At list price, monthly cash flow is $19 ($227/yr) — positive.
- The deal already cash-flows at list — no discount required.
- To meet the 1% rule (rent ≥ 1% of price), the offer needs to be $136k (22.0% below list).
- Recommended offer: $136k (22.0% below list) — sets the bar for 1% rule.
- Cap rate 6.4% vs local median 4.3% in Sedalia — top-decile yield for the area; either an underpriced asset or a hidden risk that comps aren't pricing in. Stress-test before assuming the spread holds.
Location & tenants
- Location reads 71/100 on livability (#107 in MO) — a middle-class / working-renter tenant base. Strengths: cost of living A+, housing A+, health & safety A+; Watch: amenities D, crime F, commute F.
- Sedalia 200 (town): math 47% / reading 46% proficiency, ranked #89 of 324 in MO (top 28%) — families likely to look elsewhere, expect single-tenant / working-renter base with shorter leases.
- Market conditions: 213 active listings in the ZIP; 1 comparable units currently listed for rent nearby; 109 units permitted in Pettis County in 2024 (46 in 5+ unit buildings).
Forward outlook
- Local home prices are declining (-3.0%/yr); year-one equity from $1k of loan paydown is wiped out by about $5k of value loss. Plan a longer hold.
- Pettis County population projected to shrink 7% by 2050 — rents likely to lag national; underwrite the cash flow, not the appreciation.
Negotiation context
- It's been on market 16 days — a 2% lower offer ($172k) is reasonable based on typical stale-listing flexibility.
Risks & watch-outs
- Watch-outs: built in 1958 — expect roof / HVAC / electrical / plumbing capex.
Questions for the listing agent
- Built in 1958 — when were the roof, HVAC, electrical panel, plumbing, and water heater last replaced?
- Is there a deadline driving the sale (1031 exchange, divorce, estate, relocation)? That informs how much negotiation room exists.
- Crime grade is F in this area — have there been break-ins, vandalism, or insurance claims at this property in the last 3 years? What carrier currently insures it and at what premium?
- The area grade is low — what's the realistic commute time and amenity access for the typical tenant pool here? Any planned neighborhood developments (good or bad) we should know about?
- What's the average days-on-market for RENTAL listings here right now (not sales)? A rising rental-DOM trend means longer vacancies and softer asking-rent achievability than the comps imply.
- What's the recent tenant-quality profile in this submarket — average credit score on applications, eviction rate, late-payment / NSF rate, and stable-employment percentage? A property-management company in the area should have these aggregated.
- How much new for-sale + rental construction is in the pipeline within 1–3 miles? Heavy new supply typically softens prices + rents 12–24 months out; constrained supply supports both.
Investment metrics
- 1% rule
- 0.78% ✗
- Cap rate
- 6.42%
- Cash-on-cash
- 0.46%
- DSCR
- 1.02
- GRM
- 10.7
CMA / ARV
- ARV (on-the-fly)
- $166,152
- Comps found
- 10
Show comp detail 10 sales within ~0.75 mi
| Address | Dist | Beds/Ba | Sqft | Sold | Price | $/sf | Match |
|---|---|---|---|---|---|---|---|
| 1302 E Broadway Blvd | 0.51mi | 3/1.0 | 1,248 (-3%) | 7mo | $155,000 | $124 | 65 |
| 670 E 15th St | 0.30mi | 2/1.0 (-1) | 1,345 (+4%) | 11mo | $150,000 | $112 | 64 |
| 1503 E 11th St | 0.44mi | 3/1.0 | 1,369 (+6%) | 7mo | $220,000 | $161 | 63 |
| 411 E 20th St | 0.55mi | 3/1.0 | 1,248 (-3%) | 9mo | $127,500 | $102 | 62 |
| 1305 E 14th St | 0.22mi | 3/1.0 | 1,136 (-12%) | 12mo | $60,000 | $53 | 60 |
| 1614 E 15th St | 0.39mi | 3/2.0 | 1,398 (+8%) | 6mo | $179,900 | $129 | 58 |
| 1821 S Ingram Ave | 0.45mi | 3/1.0 | 1,120 (-13%) | 9mo | $142,000 | $127 | 50 |
| 1802 E 22nd St | 0.61mi | 3/2.0 | 1,436 (+12%) | 8mo | $267,000 | $186 | 42 |
| 500 E 24th St | 0.68mi | 2/2.0 (-1) | 1,156 (-10%) | 14mo | $242,000 | $209 | 31 |
| 520 E 26th St | 0.74mi | 2/2.0 (-1) | 1,183 (-8%) | 20mo | $215,000 | $182 | 26 |
Match score weights: distance 35% · size 25% · config 20% · recency 20%. Top-matched comps best support the ARV.
Projected returns pro-forma
-3.0% appreciation · 3.0% rent growth · sell at horizon
- IRR
- -15.6%
- Equity multiple
- 0.44×
- Total profit
- $-27,225
- Equity at exit
- $26,093
- IRR
- -7.2%
- Equity multiple
- 0.54×
- Total profit
- $-22,449
- Equity at exit
- $15,131
Cash invested: $49,000 (down + closing). Projections, not guarantees.
Landlord ↔ Tenant lean methodology
- Overall (STATE)
- 81 Strongly Landlord-Friendly
- State Missouri
- 81 Strongly Landlord-Friendly · R+10
- County
- — inherits STATE
- City
- — inherits STATE
ZIP-level market 65301
- Home prices YoY
- -21.8%
- Active inventory
- 213
- Price-to-rent
- 10.7×
Monthly cashflow live
- Estimated rent
- $1,364 medium interval (Pro) →
- Mortgage (P&I)
- −$918
- Tax from tax record
- −$68 /mo · $818/yr
- Insurance
- −$73
- HOA
- −$0
- Vacancy / Maint / Mgmt
- −$286
- Net cashflow
- $19
Break-even live
UW: 25.0% down · 7.5% · 30yr · 1.5% tax · 5.0% vac · 8.0% maint · 8.0% mgmt
Financing live
Cash to close
- Down payment
- $43,750
- Closing costs
- $5,250
- Reserves months
- —
- Total cash needed
- —
Loan-product check · same deal, 3 products live
Conventional
25% down · 7.5% · 30yr
- Down + closing
- —
- Monthly P&I
- —
- Monthly cashflow
- —
- DSCR
- —
- Eligible?
- —
Personal DTI + credit; lowest rate.
DSCR
20% down · 8.5% · 30yr
- Down + closing
- —
- Monthly P&I
- —
- Monthly cashflow
- —
- DSCR
- —
- Eligible?
- —
No personal income docs; deal must DSCR.
Hard money
10% down · 12.0% · 12mo
- Down + closing
- —
- Monthly P&I
- —
- Monthly cashflow
- —
- DSCR
- —
- Eligible?
- —
Short-term bridge; refi at stabilization.
Rent comps 1 comps
| Address | Beds | Baths | Sqft | Rent | $/sqft | DOM | Units | Dist |
|---|---|---|---|---|---|---|---|---|
| 1350 E 24th St Sedalia, MO | 3.0 | 2.5 | 1500 | $1,670 | $1.11 | 44d | 1 | 0.50mi |
Listing history 12 events
-
2026-06-19days on market $175,000 Active 16 DOM
-
2026-06-18days on market $175,000 Active 15 DOM
-
2026-06-17days on market $175,000 Active 14 DOM
-
2026-06-16days on market $175,000 Active 13 DOM
-
2026-06-15pricedays on market $175,000 Active 12 DOM
-
2026-06-14days on market $185,000 Active 10 DOM
-
2026-06-12days on market $185,000 Active 9 DOM
-
2026-06-09days on market $185,000 Active 6 DOM
-
2026-06-09status $185,000 Active 5 DOM
-
2026-05-17$185,000 Active
-
2003-09-12soldstatus
-
2002-07-31soldstatus
ⓘ Source: listings_history table (triggers on properties + properties_extension) + one-shot
backfill from property_details.listing_events for pre-trigger history.
Tax reassessment forecast MO · Resets to sale price
- Current annual tax
- $818 · $68/mo
- Projected year-2 tax
- $1,698 · $141/mo
- Expected delta
- +$880/yr (+$73/mo · 107.6%)
ⓘ Screening estimate from a state-policy table — verify with the county assessor before closing.
Climate risk First Street
- Flood 1/10 Low FEMA zone X (unshaded) · 0% chance over 30 yrs
- Wildfire 3/10 Moderate
- Heat 4/10 Moderate 7 d/yr ≥106°F today · 18 d/yr by 30 yrs out
- Wind 2/10 Low
- Air quality 2/10 Low 0 unhealthy d/yr today · 1 by 30 yrs out
Nearby sold comps map
Loading sold comps map…
Walkable amenities ~0.75 mi
Loading nearby amenities…
Taxation est. · year 1
- Rental income
- $16,370
- − Mortgage interest
- −$9,803
- − Property taxes
- −$818
- − Insurance
- −$875
- − Repairs & maintenance
- −$1,310
- − Management
- −$1,310
- − Depreciation
- −$5,091
- Taxable loss
- −$2,836
- Est. tax savings @ 24.0%
- +$681
- After-tax cash flow
- $907/yr
For passive investors: Depreciation is non-cash, so a rental often shows a tax loss while cash-flowing — sheltering income. Rental losses are passive: they offset passive income freely, and up to $25,000/yr can offset ordinary (W-2) income if you actively participate and your MAGI is under $100k (phasing out to $0 by $150k); unused losses carry forward. On sale, claimed depreciation is recaptured at up to 25%, and gains may owe capital-gains tax (a 1031 exchange can defer both). Figures are a year-1 estimate at your 24.0% rate — not tax advice; consult a CPA.
Schools (NCES district)
- District
- Sedalia 200
- NCES district ID
- 2927830
- Math proficiency
- 47% ▼ -1.00%
- Reading proficiency
- 46% ▼ -3.00%
- Median HH income
- $37,452
- Composite
- 38.7/100
- National rank
- #4141
- State rank
- #89 of 324 in MO
Livability — Sedalia
- Score
- 71/100
- State rank
- #107
- US rank
- #6990
Category grades
Schools grade is shown separately in the Schools card above.
Census & demographics
- Census place
- Sedalia, MO
- County
- Pettis County · 35,091 people
- City population
- 35,091
- Metro
- Sedalia, MO
- Population (ZIP)
- 35,091
- Household income
- $58,064
- Rent vs Own
- Severe rent burden
- 1021.0
Population outlook (Pettis County) Hauer SSP2
- Today (2025)
- 41,992 people
- By 2030
- 41,584 · -1.0%
- By 2040
- 40,483 · -3.6%
- By 2050
- 39,049 · -7.0%
- By 2075
- 35,413 · -15.7%
- By 2100
- 30,870 · -26.5%
Race, ethnicity, and origin ACS 2023
- Neighborhood character
- Predominantly White (81%)
- Race & ethnicity
- White 81% Hispanic / Latino 10% Two or more races 7% Black 3%
- Hispanic origin (detail)
- Mexican 8%
- Common ancestry
- Subsaharan African 3% Lithuanian 2% Italian 1%
- Foreign-born
- 7% · Canada
- Languages at home
- 87% English-only · Spanish 7% Russian/Polish/Slavic 4% German/W. Germanic 1%
Political lean MEDSL · Pettis
- 2024 margin
- Solid R (+48.8) · D 24.9% · R 73.7% · Other 1.4%
- 2008→2024 swing
- -26.3pp toward R · 2008: -22.4pp · 2024: -48.8pp
- All cycles
- 2024: R+48.8 2020: R+47.5 2016: R+46.9 2012: R+28.8 2008: R+22.4
Not yet ingested
- Civics
- —
Market trends
- HPI YoY
- ▼ -81.80%
- Current HPI
- 292.8224
- Rent YoY
- —
- Metro
- Sedalia, MO
- State GDP YoY
- ▲ 1.84%
- F500 in state
- 20
Industry mix (Fortune 500 HQ in MO)
| Industry | F500 HQs | Revenue |
|---|---|---|
| Healthcare | 1 | $163B |
|
||
| Insurance | 1 | $21B |
|
||
| Industrial Technology | 1 | $17B |
|
||
| Retail | 1 | $16B |
|
||
| Industrial Distribution | 1 | $10B |
|
||
| Utilities | 1 | $9B |
|
||
Price history
3 events — show timeline
- 2026-05-17 Listed $185,000 WCAR
- 2003-09-12 Sold (Public Records) — Public Records
- 2002-07-31 Sold (Public Records) — Public Records
Property tax history
+0.6%/yrLatest (2025): $818 · +4.9% YoY. Source: county tax records.
Cash-flow waterfall
monthlySold comps — $/sqft
last 12 mo · ≤1 miLoading sold comps…