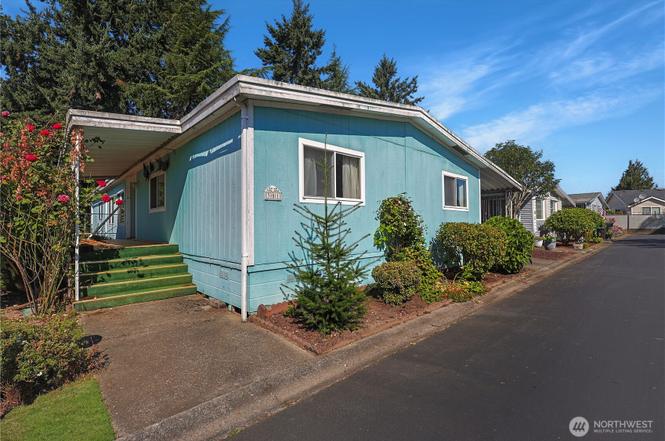
3611 I St NE #301 · Auburn, WA
Flood risk 5/10 · Moderate
- FEMA flood zone
- AH
- Chance of flooding over 30 yrs
- 0.27%
- Est. flood insurance / yr
- $1,142 – $2,507
Fire risk 1/10 · Minimal
- Est. fire insurance / yr
- $604 – $1,122
Heat risk 4/10 · Minor
- Hot days now (above 87°F)
- 7 days/yr
- Hot days in 30 yrs
- 16 days/yr
Wind risk 1/10 · Minimal
- Chance of severe wind over 30 yrs
- —
Air-quality risk 7/10 · Major
- Unhealthy air days now
- 10 days/yr
- Unhealthy air days in 30 yrs
- 11 days/yr
Risk factors via First Street. Map © Google.
Why this score? — see what drove the B+ grade
The composite is a weighted blend of 9 inputs, each scored 0–100. Each bar is that input's sub-score; the figure is the points it added to the 100-point composite (weight × sub-score).
- Cash flow +30.0/30.0
- ARV discount +15.0/15.0
- 1% rule +10.0/10.0
- DSCR +10.0/10.0
- Schools +4.7/10.0
- Livability +4.0/5.0
- Rent growth +2.9/5.0
- Condition / age +2.5/5.0
- Appreciation +0.0/10.0
$124,500
🖨 Deal sheet 📄 Offer letter ✓ Due diligence
Listing remarks
Tranquil pond view spacious home features a comfortable layout with a dedicated dining room, inviting living room, and a newly renovated bathroom including a ROLL-in shower (no lip!) and all new flooring throughout much of the home. Well-maintained and move-in ready, with classic finishes you can enjoy as-is or update to your taste. This fun 55+ community boasts a huge activity clubhouse, library, game room, pool, hot tub, BBQ area next to the lake, RV parking available, dog run, hiking trails, and community ponds and is conveniently located near shopping, dining, and easy highway access. Come and see today!
Key facts
- Inviting living room
- Easy highway access
- 3,600 sq ft lot
Tags
Property features AI
Finance
- Other: Calculated building area: 1848; Lot size approx 0.0826 acres (park record); Common area in mobile home park
- Financial info: Listing terms: Cash or Conventional
- HOA & community: Senior community; Pets allowed; Park approved for sale; River Mobile park name; Land lease payment: $859
Exterior
- Parking: Carport
- Utilities: Electric energy source; Community water (River Mobile Estates); Community sewer (River Mobile Estates); Power by PSE
- Home design: Manufactured double-wide; One level; Manufactured house; Entry on main level; Facing direction not specified
- Construction: Wood construction; Composition roof; Tie-down foundation; Manufactured after 06/15/1976
- Exterior features: Wood exterior products; Cul-de-sac lot; Paved access; Has view; Community waterfront access
Interior
- Kitchen: Dishwasher; Refrigerator; Stove/Range
- Bedrooms: 3 bedrooms
- Flooring: Laminate; Vinyl; Carpet
- Bathrooms: 1 full bath; 1 three-quarter bath; 1 bathtub; 2 showers
- Heating & cooling: Forced air heating; No central cooling
- Interior features: Den/Office; Dining room; Entry; Living room; Utility room; Walk-in closet; Bath off primary; Patio/porch/deck; Landscaped
- Laundry & utility: Dryer
Neighborhood map
What this means for you Summary
Snapshot
- This is a 3-bed/2.0-bath manufactured listed at $124k.
Deal economics
- At list price, monthly cash flow is $858 ($10k/yr) — positive.
- The deal already cash-flows at list — no discount required.
- Meets the 1% rule at list price ($2k rent vs $124k).
- Recommended offer: $110k (12.0% below list) — sets the bar for market timing.
- Cap rate 16.0% vs local median 2.7% in Auburn — top-decile yield for the area; either an underpriced asset or a hidden risk that comps aren't pricing in. Stress-test before assuming the spread holds.
Location & tenants
- Location reads 81/100 on livability (#75 in WA, #1,371 nationally) — a professional / high-income tenant draw. Strengths: amenities A+, commute A+, employment A+; Watch: crime F, cost of living F.
- Auburn School District (urban): math 47% / reading 56% proficiency, ranked #125 of 291 in WA (top 43%) — acceptable for families but not a draw, mixed tenant base, ~2y average lease.
- Market conditions: Rents rising (+1.5%/yr); 171 active listings in the ZIP; 5 comparable units currently listed for rent nearby; rentals at typical pace (median 22d on market — plan ~3-4 weeks tenant-placement turnaround); solid renter incomes; 10,555 units permitted in King County in 2024 (7,119 in 5+ unit buildings).
- This rent runs 36% of the median local income ($79k/yr) — at the standard rent-burdened threshold; future hikes will face affordability resistance.
Forward outlook
- Local home prices are declining (-3.0%/yr); year-one equity from $861 of loan paydown is wiped out by about $4k of value loss. Plan a longer hold.
- King County population projected at +44% by 2050 — long-run rental-demand tailwind backs the buy-and-hold thesis.
- At projected returns (-3.0% appreciation + 1.5% rent growth), your $35k cash investment doubles in ~5 years — after that, you're playing with house money.
Negotiation context
- It's been on market 281 days — a 12% lower offer ($110k) is reasonable based on typical stale-listing flexibility.
Risks & watch-outs
- Watch-outs: flood insurance adds $152/mo.
- Climate carrying-cost: in FEMA flood zone AH (mandatory federal flood insurance) — expect insurance premiums to compound above CPI over the hold.
Questions for the listing agent
- It's been on market 281 days. Have you received any prior offers? Is the seller open to a 12% concession, seller financing, or rate buy-down credit?
- What's the actual annual flood-insurance premium (NFIP or private), and is the property in a SFHA with mandatory coverage?
- Why hasn't it sold? Are there any deal-killer items the seller is aware of (foundation, flood, title, zoning, code violations)?
- Is there a deadline driving the sale (1031 exchange, divorce, estate, relocation)? That informs how much negotiation room exists.
- Crime grade is F in this area — have there been break-ins, vandalism, or insurance claims at this property in the last 3 years? What carrier currently insures it and at what premium?
- What's the average days-on-market for RENTAL listings here right now (not sales)? A rising rental-DOM trend means longer vacancies and softer asking-rent achievability than the comps imply.
- What's the recent tenant-quality profile in this submarket — average credit score on applications, eviction rate, late-payment / NSF rate, and stable-employment percentage? A property-management company in the area should have these aggregated.
- How much new for-sale + rental construction is in the pipeline within 1–3 miles? Heavy new supply typically softens prices + rents 12–24 months out; constrained supply supports both.
Investment metrics
- 1% rule
- 1.90% ✓
- Cap rate
- 16.03%
- Cash-on-cash
- 34.78%
- DSCR
- 2.55
- GRM
- 4.4
CMA / ARV
- ARV (on-the-fly)
- $184,800
- Comps found
- 12
Show comp detail 12 sales within ~0.75 mi
| Address | Dist | Beds/Ba | Sqft | Sold | Price | $/sf | Match |
|---|---|---|---|---|---|---|---|
| 3611 I St NE #424 | 0.00mi | 2/2.0 (-1) | 1,792 (-3%) | 2mo | $210,000 | $117 | 88 |
| 3611 I St NE #302 | 0.05mi | 3/2.0 | 1,848 (0%) | 12mo | $228,000 | $123 | 88 |
| 3611 I St NE #76 | 0.15mi | 3/2.0 | 1,900 (+3%) | 4mo | $120,000 | $63 | 85 |
| 3611 I St NE #225 | 0.05mi | 3/2.0 | 1,800 (-3%) | 18mo | $170,000 | $94 | 78 |
| 3611 I St NE #160 | 0.19mi | 3/2.0 | 1,848 (0%) | 16mo | $110,000 | $60 | 78 |
| 3611 I St NE #10 | 0.00mi | 3/2.0 | 2,040 (+10%) | 7mo | $183,000 | $90 | 76 |
| 3611 I St NE #184 | 0.15mi | 3/2.0 | 1,792 (-3%) | 15mo | $180,000 | $100 | 76 |
| 3611 I St NE #130 | 0.15mi | 3/2.0 | 1,820 (-2%) | 20mo | $146,000 | $80 | 74 |
| 3611 NE I St #257 | 0.15mi | 3/2.0 | 1,749 (-5%) | 13mo | $132,500 | $76 | 73 |
| 3611 I St NE #133 | 0.19mi | 3/2.0 | 1,920 (+4%) | 15mo | $233,000 | $121 | 72 |
| 3611 I St NE #298 | 0.15mi | 2/2.0 (-1) | 1,780 (-4%) | 22mo | $185,000 | $104 | 63 |
| 3611 I St NE #80 | 0.15mi | 2/2.0 (-1) | 1,612 (-13%) | 18mo | $189,900 | $118 | 52 |
Match score weights: distance 35% · size 25% · config 20% · recency 20%. Top-matched comps best support the ARV.
Projected returns pro-forma
-3.0% appreciation · 1.51% rent growth · sell at horizon
- IRR
- 22.2%
- Equity multiple
- 1.89×
- Total profit
- $31,126
- Equity at exit
- $18,563
- IRR
- 29.2%
- Equity multiple
- 3.41×
- Total profit
- $84,093
- Equity at exit
- $10,764
Cash invested: $34,860 (down + closing). Projections, not guarantees.
Landlord ↔ Tenant lean methodology
- Overall (STATE)
- 28 Tenant-Leaning
- State Washington
- 28 Tenant-Leaning · D+8
- County
- — inherits STATE
- City
- — inherits STATE
ZIP-level market 98002
- Rents YoY
- 1.5%
- Active inventory
- 171
- Price-to-rent
- 4.4×
Monthly cashflow live
- Estimated rent
- $2,368 high interval (Pro) →
- Mortgage (P&I)
- −$653
- Tax est. 1.5%
- −$156 /mo · $1,868/yr
- Insurance
- −$52
- Flood insurance flood zone
- −$152 /mo · $1,824/yr
- HOA
- −$0
- Vacancy / Maint / Mgmt
- −$497
- Net cashflow
- $858
Break-even live
UW: 25.0% down · 7.5% · 30yr · 1.5% tax · 5.0% vac · 8.0% maint · 8.0% mgmt
Financing live
Cash to close
- Down payment
- $31,125
- Closing costs
- $3,735
- Reserves months
- —
- Total cash needed
- —
Loan-product check · same deal, 3 products live
Conventional
25% down · 7.5% · 30yr
- Down + closing
- —
- Monthly P&I
- —
- Monthly cashflow
- —
- DSCR
- —
- Eligible?
- —
Personal DTI + credit; lowest rate.
DSCR
20% down · 8.5% · 30yr
- Down + closing
- —
- Monthly P&I
- —
- Monthly cashflow
- —
- DSCR
- —
- Eligible?
- —
No personal income docs; deal must DSCR.
Hard money
10% down · 12.0% · 12mo
- Down + closing
- —
- Monthly P&I
- —
- Monthly cashflow
- —
- DSCR
- —
- Eligible?
- —
Short-term bridge; refi at stabilization.
Rent comps 5 comps
| Address | Beds | Baths | Sqft | Rent | $/sqft | DOM | Units | Dist |
|---|---|---|---|---|---|---|---|---|
| 4750 Auburn Way N Auburn, WA | 1.0–4.0 | 1.0–2.0 | 1011 | $2,417 | $2.39 | 1d | 10 | 0.77mi |
| 2414 N St NE Unit C Auburn, WA | 3.0 | 1.0 | 1271 | $1,950 | $1.53 | 24d | 1 | 0.80mi |
| 2317 I St NE Unit 2319 Auburn, WA | 3.0 | 2.0 | 1400 | $2,275 | $1.62 | 24d | 1 | 0.87mi |
| 1462 51st Pl NE Auburn, WA | 3.0 | 2.5 | 1539 | $2,900 | $1.88 | 2d | 1 | 0.92mi |
| 2025 M St NE Unit 2045 Auburn, WA | 2.0 | 1.5 | 1248 | $2,095 | $1.68 | 21d | 1 | 1.01mi |
Listing history 15 events
-
2026-06-18statusdays on market $124,500 Active 281 DOM
-
2026-06-13statusdays on market $124,500 Pending 280 DOM
-
2026-06-09days on market $124,500 Active 279 DOM
-
2026-06-08days on market $124,500 Active 278 DOM
-
2026-06-07days on market $124,500 Active 277 DOM
-
2026-06-04days on market $124,500 Active 274 DOM
-
2026-06-03days on market $124,500 Active 273 DOM
-
2026-06-02days on market $124,500 Active 272 DOM
-
2026-06-01days on market $124,500 Active 271 DOM
-
2026-05-31days on market $124,500 Active 270 DOM
-
2026-04-26price $124,500
-
2026-02-26price $149,000
-
2025-11-08price $174,750
-
2025-09-22price $180,000
-
2025-08-25$195,000 Active
ⓘ Source: listings_history table (triggers on properties + properties_extension) + one-shot
backfill from property_details.listing_events for pre-trigger history.
Climate risk First Street
- Flood 5/10 Major FEMA zone AH · 27% chance over 30 yrs
- Wildfire 1/10 Low
- Heat 4/10 Moderate 7 d/yr ≥87°F today · 16 d/yr by 30 yrs out
- Wind 1/10 Low
- Air quality 7/10 Severe 10 unhealthy d/yr today · 11 by 30 yrs out
Nearby sold comps map
Loading sold comps map…
Walkable amenities ~0.75 mi
Loading nearby amenities…
Taxation est. · year 1
- Rental income
- $28,417
- − Mortgage interest
- −$6,974
- − Property taxes
- −$1,868
- − Insurance
- −$2,447
- − Repairs & maintenance
- −$2,273
- − Management
- −$2,273
- − Depreciation
- −$3,622
- Taxable income
- $8,960
- Est. tax owed @ 24.0%
- −$2,150
- After-tax cash flow
- $8,150/yr
For passive investors: Depreciation is non-cash, so a rental often shows a tax loss while cash-flowing — sheltering income. Rental losses are passive: they offset passive income freely, and up to $25,000/yr can offset ordinary (W-2) income if you actively participate and your MAGI is under $100k (phasing out to $0 by $150k); unused losses carry forward. On sale, claimed depreciation is recaptured at up to 25%, and gains may owe capital-gains tax (a 1031 exchange can defer both). Figures are a year-1 estimate at your 24.0% rate — not tax advice; consult a CPA.
Schools (NCES district)
- District
- Auburn School District
- NCES district ID
- 5300300
- Math proficiency
- 47% ▼ -3.00%
- Reading proficiency
- 56% ▼ -1.00%
- Median HH income
- $58,048
- Composite
- 46.73/100
- National rank
- #5240
- State rank
- #125 of 291 in WA
Livability — Auburn
- Score
- 81/100
- State rank
- #75
- US rank
- #1371
Category grades
Schools grade is shown separately in the Schools card above.
Census & demographics
- Census place
- Auburn, WA
- County
- King County · 2,251,916 people
- City population
- 74,969
- Metro
- Seattle-Tacoma-Bellevue, WA
- Population (ZIP)
- 37,509
- Household income
- $78,684
- Rent vs Own
- Severe rent burden
- 2202.0
Population outlook (King County) Hauer SSP2
- Today (2025)
- 2,576,485 people
- By 2030
- 2,803,316 · +8.8%
- By 2040
- 3,255,921 · +26.4%
- By 2050
- 3,706,444 · +43.9%
- By 2075
- 4,746,063 · +84.2%
- By 2100
- 5,407,730 · +109.9%
Race, ethnicity, and origin ACS 2023
- Neighborhood character
- Highly diverse neighborhood (Simpson 0.72)
- Race & ethnicity
- White 46% Hispanic / Latino 24% Two or more races 13% Black 12% Asian 6% Pacific Islander 4% Native American 2%
- Hispanic origin (detail)
- Mexican 20%
- Common ancestry
- Portuguese 4% Subsaharan African 4% Lithuanian 3%
- Foreign-born
- 24% · Canada, Vietnam
- Languages at home
- 63% English-only · Spanish 19% Russian/Polish/Slavic 6% Other Asian/Pacific 3%
Political lean MEDSL · King
- 2024 margin
- Solid D (+51.7) · D 74.2% · R 22.5% · Other 3.4%
- 2008→2024 swing
- +9.6pp toward D · 2008: 42.1pp · 2024: 51.7pp
- All cycles
- 2024: D+51.7 2020: D+52.7 2016: D+50.4 2012: D+39.9 2008: D+42.1
Not yet ingested
- Civics
- —
Market trends
- HPI YoY
- ▼ -677.96%
- Current HPI
- 298.0849
- Rent YoY
- ▲ 1.51%
- Metro
- Seattle-Tacoma-Bellevue, WA
- State GDP YoY
- ▲ 4.65%
- F500 in state
- 22
Industry mix (Fortune 500 HQ in WA)
| Industry | F500 HQs | Revenue |
|---|---|---|
| Retail | 2 | $269B |
|
||
| Technology / Retail | 1 | $638B |
|
||
| Technology | 1 | $245B |
|
||
| Telecommunications | 1 | $38B |
|
||
| Food / Beverage | 1 | $36B |
|
||
| Automotive / Trucks | 1 | $34B |
|
||
Price history
-36.2% since first listed5 events — show timeline
- 2026-04-26 Price Changed $124,500 NWMLS as Distributed by MLS Grid
- 2026-02-26 Price Changed $149,000 NWMLS as Distributed by MLS Grid
- 2025-11-08 Price Changed $174,750 NWMLS as Distributed by MLS Grid
- 2025-09-22 Price Changed $180,000 NWMLS as Distributed by MLS Grid
- 2025-08-25 Listed $195,000 NWMLS as Distributed by MLS Grid
Cash-flow waterfall
monthlySold comps — $/sqft
last 12 mo · ≤1 miLoading sold comps…