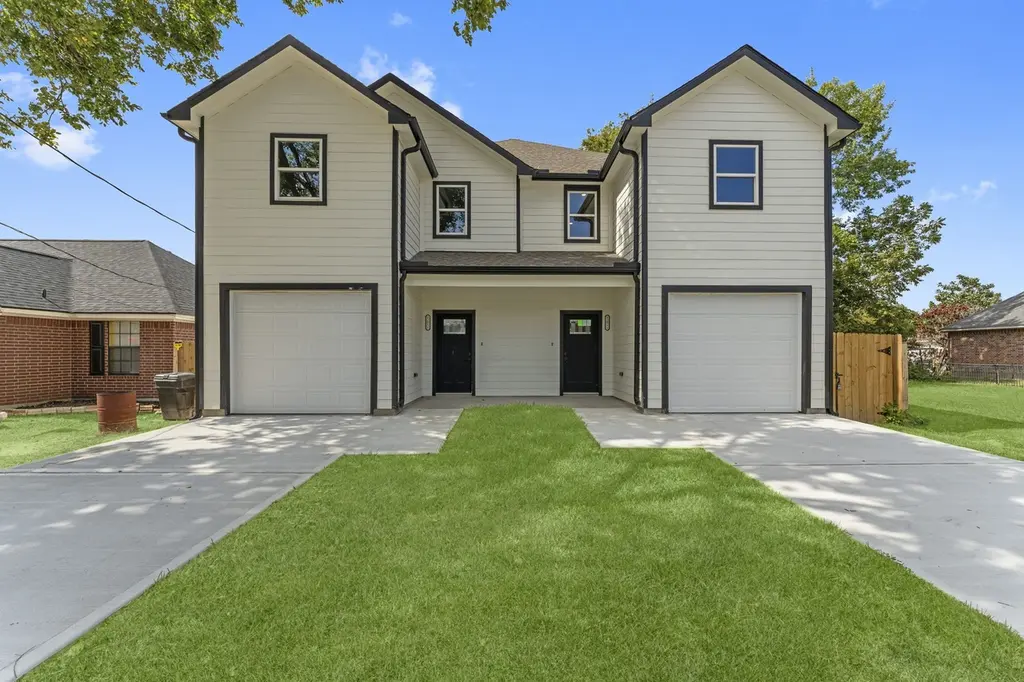
 Duplex
8205 Carver Rd · Houston, TX
Flood risk 6/10 · Moderate
- FEMA flood zone
- X (unshaded)
- Chance of flooding over 30 yrs
- 0.72%
- Est. flood insurance / yr
- $507 – $1,088
Fire risk 1/10 · Minimal
- Est. fire insurance / yr
- $1,222 – $2,270
Heat risk 9/10 · Severe
- Hot days now (above 109°F)
- 7 days/yr
- Hot days in 30 yrs
- 24 days/yr
Wind risk 9/10 · Severe
- Chance of severe wind over 30 yrs
- 99.0%
Air-quality risk 3/10 · Minor
- Unhealthy air days now
- 3 days/yr
- Unhealthy air days in 30 yrs
- 4 days/yr
Risk factors via First Street. Map © Google.
Why this score? — see what drove the D- grade
The composite is a weighted blend of 9 inputs, each scored 0–100. Each bar is that input's sub-score; the figure is the points it added to the 100-point composite (weight × sub-score).
- Cash flow +13.9/30.0
- ARV discount +8.3/15.0
- DSCR +4.2/10.0
- Livability +3.7/5.0
- 1% rule +3.5/10.0
- Condition / age +2.5/5.0
- Rent growth +2.2/5.0
- Schools +1.5/10.0
- Appreciation +0.0/10.0
$460,000
🖨 Deal sheet (PDF) 📄 Offer letter ✓ Due diligence
Multi-family units
County records classify this as Multi-Family (2-4 Unit). Listing-text estimate: 2 units. confirmed
Listing remarks MLS
Prime Investment Opportunity: Partially Developed Lot with Unfinished Duplex Welcome to a remarkable real estate opportunity located in the heart of [Neighborhood/City], perfect for investors or builders ready to complete a promising project. This partially developed lot features an unfinished duplex, offering the chance to customize and complete the build to your specifications. This lot offers a head start on a lucrative investment, with much of the initial groundwork already completed. Whether you’re looking to finish and rent out both units or sell for a profit, this property holds immense potential. Don’t miss out on this rare opportunity to invest in a developing area with promising returns. Don't miss your opportunity to view and explore the possibilities that await you with this partially developed lot and unfinished duplex!
Key facts
- 7,300 sq ft lot
- Garage
- Built 2024
Property features AI
Finance
- Other: Owner is listing agent
Exterior
- Parking: Garage with garage door opener
- Home design: Residential income property; Built in 2024
- Construction: Cement siding; Composition roof; Approximately 2,984 total building area
- Exterior features: 7300 sq ft lot
Interior
- Kitchen: Dishwasher; Disposal; Microwave
- Bedrooms: Two total residential units
- Flooring: Laminate flooring; Carpet
- Bathrooms: Four full bathrooms
- Heating & cooling: Central heating (electric); Central air conditioning (electric)
- Interior features: Dishwasher; Disposal; Microwave
Neighborhood map
What this means for you Summary
Snapshot
- This is a 2 × 3.0-bed/2.5-bath units multifamily listed at $460k.
Deal economics
- At list price, monthly cash flow is $47 ($567/yr) — positive. Per door: $24/mo.
- The deal already cash-flows at list — no discount required.
- To meet the 1% rule (rent ≥ 1% of price), the offer needs to be $392k (14.7% below list).
- Recommended offer: $392k (14.7% below list) — sets the bar for 1% rule.
- Cap rate 6.4% vs local median 3.2% in Houston — top-decile yield for the area; either an underpriced asset or a hidden risk that comps aren't pricing in. Stress-test before assuming the spread holds.
Location & tenants
- Location reads 74/100 on livability (#184 in TX, #4,771 nationally) — a middle-class / working-renter tenant base. Strengths: amenities A+, cost of living A+, housing A+; Watch: crime F.
- Aldine ISD (suburban): math 16% / reading 21% proficiency, ranked #790 of 826 in TX (top 96%) — low school quality limits family demand, transient renter base, plan for 1-2y turnover; 79% free/reduced lunch — lower-income household profile, screen leases tightly.
- Zoned schools: Anderson Academy (math 18% / reading 16%, grade F, #3,836 of 4,322 statewide, top 91%, 677 students, 94% FRL); Drew Academy (math 14% / reading 28%, grade F, #1,387 of 1,662 statewide, top 85%, 382 students, 91% FRL); Carver H S For Applied Tech/Engineering/Arts (math 25% / reading 32%, grade F, #1,157 of 1,632 statewide, top 72%, 755 students, 86% FRL).
- Market conditions: Rents soft (-1.0%/yr); 471 active listings in the ZIP; 29,883 units permitted in Harris County in 2024 (8,621 in 5+ unit buildings).
- At $3,923/mo this rent would consume 87% of the median local household income ($54k/yr) (locally 2294% of renters already pay >50% of income on rent) — very limited rent-growth headroom before tenants either downsize or default.
Forward outlook
- Local home prices are declining (-3.0%/yr); year-one equity from $3k of loan paydown is wiped out by about $14k of value loss. Plan a longer hold.
- Harris County population projected at +47% by 2050 — long-run rental-demand tailwind backs the buy-and-hold thesis.
Negotiation context
- It's been on market 42 days — a 3% lower offer ($446k) is reasonable based on typical stale-listing flexibility.
- 7 sale attempts since 7y ago with the ask held roughly flat each time — persistent listings suggest the price (not the market) is what's stuck; bring a comps-based counter.
Risks & watch-outs
- Climate carrying-cost: major flood risk; severe wind risk, 99% chance of damaging wind over 30y; extreme-heat days projected 7→24/yr by 2055 (HVAC capex compounding) — expect insurance premiums to compound above CPI over the hold.
Questions for the listing agent
- It's been on market 42 days. Have you received any prior offers? Is the seller open to a 15% concession, seller financing, or rate buy-down credit?
- Can we see the unit-by-unit rent roll, current vacancy, and any below-market leases? What's the average tenancy length?
- What capital expenditures (roof, boiler, parking lot, exteriors) have been made in the last 5 years, and what's planned in the next 2?
- Is there a deadline driving the sale (1031 exchange, divorce, estate, relocation)? That informs how much negotiation room exists.
- Schools are D-rated, which usually means shorter tenancies and higher turnover. Who's the typical renter profile here, and what's been the actual vacancy rate?
- Crime grade is F in this area — have there been break-ins, vandalism, or insurance claims at this property in the last 3 years? What carrier currently insures it and at what premium?
- The area grade is low — what's the realistic commute time and amenity access for the typical tenant pool here? Any planned neighborhood developments (good or bad) we should know about?
- What's the average days-on-market for RENTAL listings here right now (not sales)? A rising rental-DOM trend means longer vacancies and softer asking-rent achievability than the comps imply.
- What's the recent tenant-quality profile in this submarket — average credit score on applications, eviction rate, late-payment / NSF rate, and stable-employment percentage? A property-management company in the area should have these aggregated.
- How much new apartment / multifamily construction is in the pipeline within 1–3 miles? Heavy new supply (>2% of stock underway) typically softens rents 12–24 months out; light construction supports rent growth.
Investment metrics
- 1% rule
- 0.85% ✗
- Cap rate
- 6.42%
- Cash-on-cash
- 0.44%
- DSCR
- 1.02
- GRM
- 9.8
CMA / ARV
- ARV (median comp)
- $468,333
- List price
- $460,000
- Delta
- -1.78%
- Verdict
- FAIR
- Comps
- 20 within 1.0 mi
Show comp detail 6 sales within ~0.75 mi
| Address | Dist | Beds/Ba | Sqft | Sold | Price | $/sf | Match |
|---|---|---|---|---|---|---|---|
| 8021 Carver Rd | 0.11mi | 6/4.0 | 2,640 (-12%) | 8mo | $469,777 | $178 | 66 |
| 8215 Moon Beam St | 0.07mi | 6/2.0 | 3,055 (+2%) | 20mo | $534,900 | $175 | 64 |
| 7517 Hezekiah Ln | 0.40mi | 6/3.0 | 3,056 (+2%) | 15mo | $539,000 | $176 | 57 |
| 8418 Observatory St | 0.18mi | 6/2.0 | 2,774 (-7%) | 19mo | $485,000 | $175 | 52 |
| 2206 Dolly Wright St | 0.58mi | 6/3.0 | 2,774 (-7%) | 16mo | $490,000 | $177 | 40 |
| 2009 Wavell St | 0.64mi | 5/2.0 (-1) | 3,200 (+7%) | 23mo | $493,900 | $154 | 22 |
Match score weights: distance 35% · size 25% · config 20% · recency 20%. Top-matched comps best support the ARV.
Projected returns pro-forma
-3.0% appreciation · 0.0% rent growth · sell at horizon
- IRR
- -18.9%
- Equity multiple
- 0.36×
- Total profit
- $-83,044
- Equity at exit
- $68,587
- IRR
- -18.7%
- Equity multiple
- 0.12×
- Total profit
- $-112,943
- Equity at exit
- $39,772
Cash invested: $128,800 (down + closing). Projections, not guarantees.
Landlord ↔ Tenant lean methodology
- Overall (STATE)
- 87 Strongly Landlord-Friendly
- State Texas
- 87 Strongly Landlord-Friendly · R+5
- County
- — inherits STATE
- City
- — inherits STATE
ZIP-level market 77088
- Home prices YoY
- -23.2%
- Rents YoY
- -1.0%
- Active inventory
- 471
- Price-to-rent
- 19.5×
Monthly cashflow live
- Estimated rent
- $3,923 high interval (Pro) →
- Mortgage (P&I)
- −$2,412
- Tax from tax record
- −$448 /mo · $5,375/yr
- Insurance
- −$192
- HOA
- −$0
- Vacancy / Maint / Mgmt
- −$824
- Net cashflow
- $47
Break-even live
Sensitivity live
| Price | -10% $308 | -5% $177 | +0% $47 | +5% $-83 | +10% $-213 |
|---|---|---|---|---|---|
| Rent | -10% $-263 | -5% $-108 | +0% $47 | +5% $202 | +10% $357 |
| Rate | -1.0pp $279 | -0.5pp $164 | base $47 | +0.5pp $-72 | +1.0pp $-193 |
2-unit breakdown (identical units grouped — click to expand)
| Units | Beds | Baths | Est. rent |
|---|---|---|---|
| 2× units | 3.0 | 2.5 | $3,922 |
| #1 | 3.0 | 2.5 | $1,961 |
| #2 | 3.0 | 2.5 | $1,961 |
| Total (2 units) | $3,923 | ||
UW: 25.0% down · 7.5% · 30yr · 1.5% tax · 5.0% vac · 8.0% maint · 8.0% mgmt
Financing live
Cash to close
- Down payment
- $115,000
- Closing costs
- $13,800
- Reserves months
- —
- Total cash needed
- —
Loan-product check · same deal, 3 products live
Conventional
25% down · 7.5% · 30yr
- Down + closing
- —
- Monthly P&I
- —
- Monthly cashflow
- —
- DSCR
- —
- Eligible?
- —
Personal DTI + credit; lowest rate.
DSCR
20% down · 8.5% · 30yr
- Down + closing
- —
- Monthly P&I
- —
- Monthly cashflow
- —
- DSCR
- —
- Eligible?
- —
No personal income docs; deal must DSCR.
Hard money
10% down · 12.0% · 12mo
- Down + closing
- —
- Monthly P&I
- —
- Monthly cashflow
- —
- DSCR
- —
- Eligible?
- —
Short-term bridge; refi at stabilization.
Listing history 31 events
-
2026-06-13statusdays on market $460,000 Pending 42 DOM
-
2026-06-09days on market $460,000 Active 41 DOM
-
2026-06-08days on market $460,000 Active 40 DOM
-
2026-06-07days on market $460,000 Active 39 DOM
-
2026-06-04days on market $460,000 Active 36 DOM
-
2026-06-03days on market $460,000 Active 35 DOM
-
2026-06-02days on market $460,000 Active 34 DOM
-
2026-06-01days on market $460,000 Active 33 DOM
-
2026-05-31days on market $460,000 Active 32 DOM
-
2026-04-29$460,000 Active 392-char remark
-
2026-04-04historical $1,850
-
2026-04-02$1,850
-
2026-04-01historical $1,850
-
2026-03-25historical $1,850
-
2026-03-14$1,850
-
2026-02-17price $1,850
-
2026-01-30price $1,900
-
2026-01-01historical $2,000
-
2025-12-25$2,000
-
2025-12-12price $2,000
-
2025-12-02$2,200
-
2024-08-08soldstatus
-
2024-08-05soldstatus Sold 859-char remark
Show marketing remark (859 chars)
Prime Investment Opportunity: Partially Developed Lot with Unfinished Duplex Welcome to a remarkable real estate opportunity located in the heart of [Neighborhood/City], perfect for investors or builders ready to complete a promising project. This partially developed lot features an unfinished duplex, offering the chance to customize and complete the build to your specifications. This lot offers a head start on a lucrative investment, with much of the initial groundwork already completed. Whether you’re looking to finish and rent out both units or sell for a profit, this property holds immense potential. Don’t miss out on this rare opportunity to invest in a developing area with promising returns. Don't miss your opportunity to view and explore the possibilities that await you with this partially developed lot and unfinished duplex!
-
2024-08-05soldstatus
Show marketing remark (859 chars)
Prime Investment Opportunity: Partially Developed Lot with Unfinished Duplex Welcome to a remarkable real estate opportunity located in the heart of [Neighborhood/City], perfect for investors or builders ready to complete a promising project. This partially developed lot features an unfinished duplex, offering the chance to customize and complete the build to your specifications. This lot offers a head start on a lucrative investment, with much of the initial groundwork already completed. Whether you’re looking to finish and rent out both units or sell for a profit, this property holds immense potential. Don’t miss out on this rare opportunity to invest in a developing area with promising returns. Don't miss your opportunity to view and explore the possibilities that await you with this partially developed lot and unfinished duplex!
-
2024-07-26status Pending 859-char remark
Show marketing remark (859 chars)
Prime Investment Opportunity: Partially Developed Lot with Unfinished Duplex Welcome to a remarkable real estate opportunity located in the heart of [Neighborhood/City], perfect for investors or builders ready to complete a promising project. This partially developed lot features an unfinished duplex, offering the chance to customize and complete the build to your specifications. This lot offers a head start on a lucrative investment, with much of the initial groundwork already completed. Whether you’re looking to finish and rent out both units or sell for a profit, this property holds immense potential. Don’t miss out on this rare opportunity to invest in a developing area with promising returns. Don't miss your opportunity to view and explore the possibilities that await you with this partially developed lot and unfinished duplex!
-
2024-07-26$160,000 Active 859-char remark
Show marketing remark (859 chars)
Prime Investment Opportunity: Partially Developed Lot with Unfinished Duplex Welcome to a remarkable real estate opportunity located in the heart of [Neighborhood/City], perfect for investors or builders ready to complete a promising project. This partially developed lot features an unfinished duplex, offering the chance to customize and complete the build to your specifications. This lot offers a head start on a lucrative investment, with much of the initial groundwork already completed. Whether you’re looking to finish and rent out both units or sell for a profit, this property holds immense potential. Don’t miss out on this rare opportunity to invest in a developing area with promising returns. Don't miss your opportunity to view and explore the possibilities that await you with this partially developed lot and unfinished duplex!
-
2019-11-18soldstatus
-
2019-11-04soldstatus Sold
Show marketing remark (105 chars)
Beautiful lot for building your dream home. Great price for location. Nice homes nearby. Won't last long.
-
2019-10-28status Pending
Show marketing remark (105 chars)
Beautiful lot for building your dream home. Great price for location. Nice homes nearby. Won't last long.
-
2019-04-30$35,000 Active
Show marketing remark (105 chars)
Beautiful lot for building your dream home. Great price for location. Nice homes nearby. Won't last long.
-
1988-01-02soldstatus
ⓘ Source: listings_history table (triggers on properties + properties_extension) + one-shot
backfill from property_details.listing_events for pre-trigger history.
Tax reassessment forecast TX · Resets to sale price
- Current annual tax
- $5,375 · $448/mo
- Projected year-2 tax
- $8,418 · $702/mo
- Expected delta
- +$3,043/yr (+$254/mo · 56.6%)
ⓘ Screening estimate from a state-policy table — verify with the county assessor before closing.
Climate risk First Street
- Flood 6/10 Major FEMA zone X (unshaded) · 72% chance over 30 yrs
- Wildfire 1/10 Low
- Heat 9/10 Extreme 7 d/yr ≥109°F today · 24 d/yr by 30 yrs out
- Wind 9/10 Extreme 99% chance of damaging wind over 30 yrs
- Air quality 3/10 Moderate 3 unhealthy d/yr today · 4 by 30 yrs out
Nearby sold comps map
Loading sold comps map…
Walkable amenities ~0.75 mi
Loading nearby amenities…
Taxation est. · year 1
- Rental income
- $47,076
- − Mortgage interest
- −$25,767
- − Property taxes
- −$5,375
- − Insurance
- −$2,300
- − Repairs & maintenance
- −$3,766
- − Management
- −$3,766
- − Depreciation
- −$13,382
- Taxable loss
- −$7,280
- Est. tax savings @ 24.0%
- +$1,747
- After-tax cash flow
- $2,315/yr
For passive investors: Depreciation is non-cash, so a rental often shows a tax loss while cash-flowing — sheltering income. Rental losses are passive: they offset passive income freely, and up to $25,000/yr can offset ordinary (W-2) income if you actively participate and your MAGI is under $100k (phasing out to $0 by $150k); unused losses carry forward. On sale, claimed depreciation is recaptured at up to 25%, and gains may owe capital-gains tax (a 1031 exchange can defer both). Figures are a year-1 estimate at your 24.0% rate — not tax advice; consult a CPA.
Schools (NCES district)
- District
- Aldine ISD
- NCES district ID
- 4807710
- Math proficiency
- 16% ▼ -23.00%
- Reading proficiency
- 21% ▼ -11.00%
- Median HH income
- $37,081
- Composite
- 15.42/100
- National rank
- #9317
- State rank
- #790 of 826 in TX
Livability — Houston
- Score
- 74/100
- State rank
- #184
- US rank
- #4771
Category grades
Schools grade is shown separately in the Schools card above.
Census & demographics
- Census place
- Houston, TX
- County
- Harris County · 4,702,590 people
- City population
- 3,226,434
- Metro
- Houston-The Woodlands-Sugar Land, TX
- Population (ZIP)
- 57,047
- Household income
- $54,411
- Rent vs Own
- Severe rent burden
- 2294.0
Population outlook (Harris County) Hauer SSP2
- Today (2025)
- 5,571,493 people
- By 2030
- 6,089,821 · +9.3%
- By 2040
- 7,142,806 · +28.2%
- By 2050
- 8,185,864 · +46.9%
- By 2075
- 10,574,329 · +89.8%
- By 2100
- 12,109,958 · +117.4%
Race, ethnicity, and origin ACS 2023
- Neighborhood character
- Diverse neighborhood (Simpson 0.59)
- Race & ethnicity
- Hispanic / Latino 52% Black 37% Two or more races 18% White 6% Asian 4%
- Hispanic origin (detail)
- Mexican 36%
- Common ancestry
- Lithuanian 1%
- Foreign-born
- 25% · Canada, Vietnam, China
- Languages at home
- 49% English-only · Spanish 47% Vietnamese 3%
Political lean MEDSL · Harris
- 2024 margin
- Lean D (+5.5) · D 52.0% · R 46.4% · Other 1.6%
- 2008→2024 swing
- +3.9pp toward D · 2008: 1.6pp · 2024: 5.5pp
- All cycles
- 2024: D+5.5 2020: D+13.3 2016: D+12.4 2012: D+0.1 2008: D+1.6
Not yet ingested
- Civics
- —
Market trends
- HPI YoY
- ▼ -98.37%
- Current HPI
- 325.0499
- Rent YoY
- ▼ -1.01%
- Metro
- Houston-The Woodlands-Sugar Land, TX
- State GDP YoY
- ▲ 3.95%
- F500 in state
- 110
Industry mix (Fortune 500 HQ in TX)
| Industry | F500 HQs | Revenue |
|---|---|---|
| Energy | 16 | $1,198B |
|
||
| Technology | 5 | $198B |
|
||
| Engineering / Construction | 4 | $72B |
|
||
| Energy Services | 3 | $60B |
|
||
| Utilities | 3 | $41B |
|
||
| Healthcare | 2 | $330B |
|
||
Price history
+1214.3% since first listed23 events — show timeline
- 2026-06-11 Pending — HARMLS
- 2026-04-29 Listed $460,000 HARMLS
- 2026-04-04 Rental Removed $1,850 SHOWMOJO
- 2026-04-02 Listed for Rent $1,850 SHOWMOJO
- 2026-04-01 Rental Removed $1,850 HARMLS
- 2026-03-25 Rental Removed $1,850 SHOWMOJO
- 2026-03-14 Listed for Rent $1,850 SHOWMOJO
- 2026-02-17 Price Changed $1,850 HARMLS
- 2026-01-30 Price Changed $1,900 HARMLS
- 2026-01-01 Rental Removed $2,000 SHOWMOJO
- 2025-12-25 Listed for Rent $2,000 SHOWMOJO
- 2025-12-12 Price Changed $2,000 HARMLS
- 2025-12-02 Listed for Rent $2,200 HARMLS
- 2024-08-08 Sold (Public Records) — Public Records
- 2024-08-05 Sold (Public Records) — Public Records
- 2024-08-05 Sold (MLS) — HARMLS
- 2024-07-26 Pending — HARMLS
- 2024-07-26 Listed $160,000 HARMLS
- 2019-11-18 Sold (Public Records) — Public Records
- 2019-11-04 Sold (MLS) — HARMLS
- 2019-10-28 Pending — HARMLS
- 2019-04-30 Listed $35,000 HARMLS
- 1988-01-02 Sold (Public Records) — Public Records
Property tax history
+28.8%/yrLatest (2025): $5,375 · +3.5% YoY. Source: county tax records.
Cash-flow waterfall
monthlySold comps — $/sqft
last 12 mo · ≤1 miLoading sold comps…