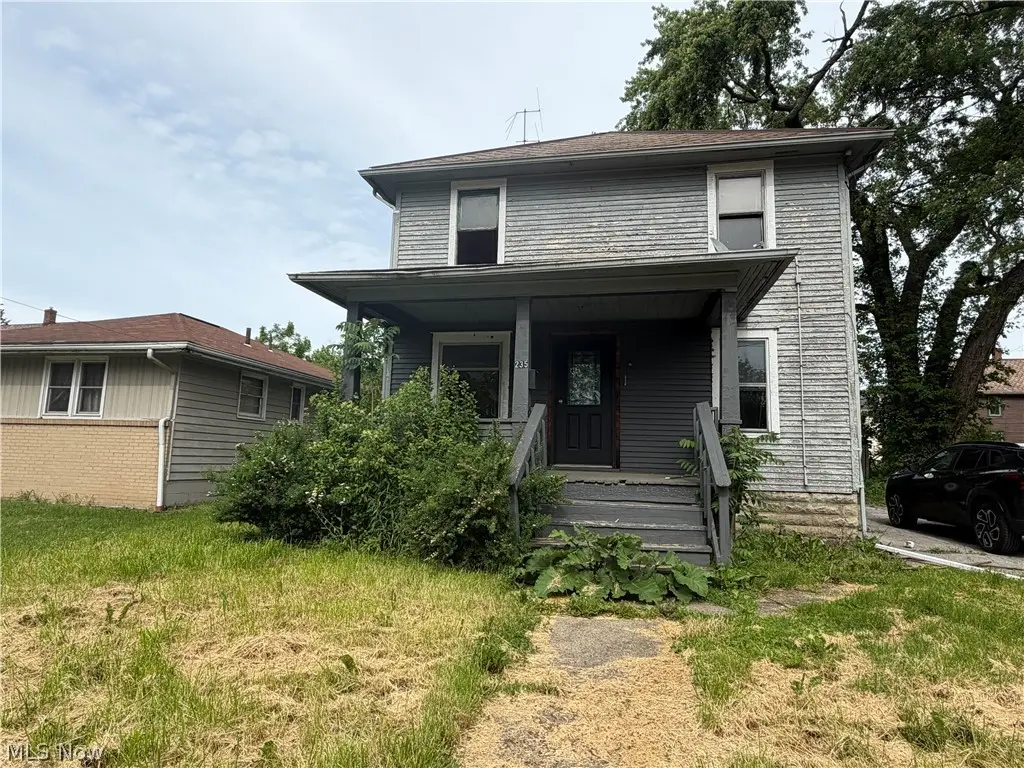
235 Iddings Ave SE · Warren, OH
Flood risk 1/10 · Minimal
- FEMA flood zone
- X (unshaded)
- Chance of flooding over 30 yrs
- 0.0%
- Est. flood insurance / yr
- $473 – $860
Fire risk 1/10 · Minimal
- Est. fire insurance / yr
- $713 – $1,323
Heat risk 3/10 · Minor
- Hot days now (above 97°F)
- 7 days/yr
- Hot days in 30 yrs
- 17 days/yr
Wind risk 1/10 · Minimal
- Chance of severe wind over 30 yrs
- —
Air-quality risk 3/10 · Minor
- Unhealthy air days now
- 1 days/yr
- Unhealthy air days in 30 yrs
- 4 days/yr
Risk factors via First Street. Map © Google.
Why this score? — see what drove the B- grade
The composite is a weighted blend of 9 inputs, each scored 0–100. Each bar is that input's sub-score; the figure is the points it added to the 100-point composite (weight × sub-score).
- Cash flow +30.0/30.0
- 1% rule +10.0/10.0
- DSCR +10.0/10.0
- ARV discount +7.5/15.0
- Livability +3.7/5.0
- Rent growth +2.5/5.0
- Condition / age +2.5/5.0
- Schools +2.2/10.0
- Appreciation +0.0/10.0
$60,000
🖨 Deal sheet 📄 Offer letter ✓ Due diligence
Listing remarks MLS
Calling all investors! Come and make this promising property with endless potential your next investment today.
Key facts
- 5,148 sq ft lot
- Garage
- Built 1916
Property features AI
Finance
- Other: Property listed as a fixer
Exterior
- Parking: Detached driveway; Detached 1-car garage
- Utilities: Public water; Public sewer
- Home design: 2-story home; Frame construction with vinyl siding; Asphalt shingle roof; Above-grade finished area approximately 1,323
- Construction: Built (year source: public records); Frame and vinyl siding construction; Asphalt shingle roof; Full unfinished basement
- Exterior features: Public water; Public sewer
Interior
- Bedrooms: 6 total rooms (includes bedrooms and living spaces)
- Bathrooms: 1 full bathroom
- Heating & cooling: Gas heating
- Interior features: Full, unfinished basement
Neighborhood map
What this means for you Summary
Snapshot
- This is a 3-bed/1.0-bath single-family listed at $60k.
Deal economics
- At list price, monthly cash flow is $514 ($6k/yr) — positive.
- The deal already cash-flows at list — no discount required.
- Meets the 1% rule at list price ($1k rent vs $60k).
- Recommended offer: $59k (1.5% below list) — sets the bar for market timing.
- Cap rate 16.6% vs local median 6.0% in Warren — top-decile yield for the area; either an underpriced asset or a hidden risk that comps aren't pricing in. Stress-test before assuming the spread holds.
Location & tenants
- Location reads 73/100 on livability (#312 in OH) — a middle-class / working-renter tenant base. Strengths: cost of living A+, health & safety A+, housing A; Watch: crime D-, commute F, employment F.
- Warren City (urban): math 22% / reading 32% proficiency, ranked #599 of 656 in OH (top 91%) — low school quality limits family demand, transient renter base, plan for 1-2y turnover; 75% free/reduced lunch — lower-income household profile, screen leases tightly.
- Market conditions: 107 active listings in the ZIP; 6 comparable units currently listed for rent nearby; rentals leasing fast (median 13d on market — plan ~1-2 weeks tenant-placement turnaround); 129 units permitted in Trumbull County in 2024 (0 in 5+ unit buildings).
Forward outlook
- Local home prices are declining (-3.0%/yr); year-one equity from $415 of loan paydown is wiped out by about $2k of value loss. Plan a longer hold.
- Trumbull County population projected at -22% by 2050 — secular population decline; favor cash flow + early exit over multi-decade hold.
- At projected returns (-3.0% appreciation + 3.0% rent growth), your $17k cash investment doubles in ~4 years — after that, you're playing with house money.
Negotiation context
- It's been on market 23 days — a 2% lower offer ($59k) is reasonable based on typical stale-listing flexibility.
- 2 sale attempts; this cycle's ask has dropped $5k (8%) from the opening price — seller is motivated, your offer sets the floor, not the list.
- Current owner paid $39k; list at $60k implies a 54% gain — meaningful room to come down on a strong offer.
Risks & watch-outs
- Watch-outs: built in 1916 — expect roof / HVAC / electrical / plumbing capex.
Questions for the listing agent
- Built in 1916 — when were the roof, HVAC, electrical panel, plumbing, and water heater last replaced?
- Is there a deadline driving the sale (1031 exchange, divorce, estate, relocation)? That informs how much negotiation room exists.
- Crime grade is D in this area — have there been break-ins, vandalism, or insurance claims at this property in the last 3 years? What carrier currently insures it and at what premium?
- What's the average days-on-market for RENTAL listings here right now (not sales)? A rising rental-DOM trend means longer vacancies and softer asking-rent achievability than the comps imply.
- What's the recent tenant-quality profile in this submarket — average credit score on applications, eviction rate, late-payment / NSF rate, and stable-employment percentage? A property-management company in the area should have these aggregated.
- How much new for-sale + rental construction is in the pipeline within 1–3 miles? Heavy new supply typically softens prices + rents 12–24 months out; constrained supply supports both.
Investment metrics
- 1% rule
- 1.87% ✓
- Cap rate
- 16.58%
- Cash-on-cash
- 36.73%
- DSCR
- 2.63
- GRM
- 4.5
CMA / ARV
- ARV (on-the-fly)
- $120,393
- Comps found
- 12
Show comp detail 12 sales within ~0.75 mi
| Address | Dist | Beds/Ba | Sqft | Sold | Price | $/sf | Match |
|---|---|---|---|---|---|---|---|
| 223 Laird Ave NE | 0.26mi | 3/1.0 | 1,286 (-3%) | 6mo | $144,900 | $113 | 78 |
| 1180 Harrison St | 0.31mi | 3/1.0 | 1,376 (+4%) | 1mo | $89,900 | $65 | 78 |
| 265 Charles Ave NE | 0.31mi | 3/1.0 | 1,296 (-2%) | 6mo | $118,000 | $91 | 77 |
| 156 Bonnie Brae Ave NE | 0.26mi | 3/1.0 | 1,440 (+9%) | 3mo | $145,500 | $101 | 70 |
| 1172 Mckinley St NE | 0.37mi | 2/1.0 (-1) | 1,392 (+5%) | 5mo | $47,000 | $34 | 64 |
| 451 Homewood Ave SE | 0.35mi | 3/1.0 | 1,189 (-10%) | 6mo | $68,000 | $57 | 62 |
| 1116 Adelaide Ave SE | 0.64mi | 4/1.0 (+1) | 1,254 (-5%) | 0mo | $106,250 | $85 | 56 |
| 781 Oak Knoll Ave SE | 0.58mi | 3/1.0 | 1,165 (-12%) | 6mo | $119,900 | $103 | 48 |
| 1100 Woodbine Ave SE | 0.65mi | 3/1.0 | 1,178 (-11%) | 5mo | $42,500 | $36 | 48 |
| 327 Adelaide | 0.57mi | 3/1.0 | 1,144 (-14%) | 6mo | $127,900 | $112 | 46 |
| 752 Laird Ave NE | 0.65mi | 4/2.0 (+1) | 1,200 (-9%) | 3mo | $74,000 | $62 | 43 |
| 213 Kenmore Ave NE | 0.73mi | 3/1.0 | 1,142 (-14%) | 6mo | $116,000 | $102 | 38 |
Match score weights: distance 35% · size 25% · config 20% · recency 20%. Top-matched comps best support the ARV.
Projected returns pro-forma
-3.0% appreciation · 3.0% rent growth · sell at horizon
- IRR
- 32.5%
- Equity multiple
- 2.37×
- Total profit
- $23,015
- Equity at exit
- $8,946
- IRR
- 39.6%
- Equity multiple
- 4.70×
- Total profit
- $62,167
- Equity at exit
- $5,188
Cash invested: $16,800 (down + closing). Projections, not guarantees.
Landlord ↔ Tenant lean methodology
- Overall (STATE)
- 73 Landlord-Friendly
- State Ohio
- 73 Landlord-Friendly · R+6
- County
- — inherits STATE
- City
- — inherits STATE
ZIP-level market 44483
- Home prices YoY
- -16.3%
- Active inventory
- 107
- Price-to-rent
- 4.5×
Monthly cashflow live
- Estimated rent
- $1,120 high interval (Pro) →
- Mortgage (P&I)
- −$315
- Tax from tax record
- −$31 /mo · $368/yr
- Insurance
- −$25
- HOA
- −$0
- Vacancy / Maint / Mgmt
- −$235
- Net cashflow
- $514
Break-even live
UW: 25.0% down · 7.5% · 30yr · 1.5% tax · 5.0% vac · 8.0% maint · 8.0% mgmt
Financing live
Cash to close
- Down payment
- $15,000
- Closing costs
- $1,800
- Reserves months
- —
- Total cash needed
- —
Loan-product check · same deal, 3 products live
Conventional
25% down · 7.5% · 30yr
- Down + closing
- —
- Monthly P&I
- —
- Monthly cashflow
- —
- DSCR
- —
- Eligible?
- —
Personal DTI + credit; lowest rate.
DSCR
20% down · 8.5% · 30yr
- Down + closing
- —
- Monthly P&I
- —
- Monthly cashflow
- —
- DSCR
- —
- Eligible?
- —
No personal income docs; deal must DSCR.
Hard money
10% down · 12.0% · 12mo
- Down + closing
- —
- Monthly P&I
- —
- Monthly cashflow
- —
- DSCR
- —
- Eligible?
- —
Short-term bridge; refi at stabilization.
Rent comps 6 comps
| Address | Beds | Baths | Sqft | Rent | $/sqft | DOM | Units | Dist |
|---|---|---|---|---|---|---|---|---|
| 341 Charles AVE Warren, OH | 3.0 | 1.0 | 1232 | $1,100 | $0.89 | 43d | 1 | 0.14mi |
| 840 Woodbine Ave SE Unit 838 Warren, OH | 2.0 | 1.0 | 1009 | $1,000 | $0.99 | 13d | 1 | 0.55mi |
| 1151 Kenilworth Ave SE Warren, OH | 2.0 | 1.0 | 1207 | $900 | $0.75 | 13d | 1 | 0.67mi |
| 407 Washington St NE Niles, OH | 3.0 | 1.5 | 1388 | $1,250 | $0.90 | 13d | 1 | 0.78mi |
| 1216 Hollywood St NE Warren, OH | 3.0 | 1.0 | 1158 | $1,050 | $0.91 | 21d | 1 | 0.84mi |
| 259 Perkinswood Blvd NE Warren, OH | 1.0–2.0 | 1.0 | 743 | $845 | $1.14 | 13d | 3 | 0.92mi |
Listing history 24 events
-
2026-06-19days on market $60,000 Active 23 DOM
-
2026-06-18days on market $60,000 Active 22 DOM
-
2026-06-17days on market $60,000 Active 21 DOM
-
2026-06-16days on market $60,000 Active 20 DOM
-
2026-06-15days on market $60,000 Active 19 DOM
-
2026-06-14days on market $60,000 Active 17 DOM
-
2026-06-13pricedays on market $60,000 Active 16 DOM
-
2026-06-10days on market $65,000 Active 14 DOM
-
2026-06-09days on market $65,000 Active 13 DOM
-
2026-06-08days on market $65,000 Active 12 DOM
-
2026-06-07days on market $65,000 Active 11 DOM
-
2026-06-05days on market $65,000 Active 8 DOM
-
2026-06-02days on market $65,000 Active 6 DOM
-
2026-06-01days on market $65,000 Active 5 DOM
-
2026-05-31days on market $65,000 Active 4 DOM
-
2026-05-30days on market $65,000 Active 3 DOM
-
2026-05-26$65,000 Active
-
2025-08-19soldstatus $39,000 Closed 111-char remark
Show marketing remark (111 chars)
Calling all investors! Come and make this promising property with endless potential your next investment today.
-
2025-08-18status Pending 111-char remark
Show marketing remark (111 chars)
Calling all investors! Come and make this promising property with endless potential your next investment today.
-
2025-07-25historical Contingent 111-char remark
Show marketing remark (111 chars)
Calling all investors! Come and make this promising property with endless potential your next investment today.
-
2025-06-26$58,900 Active 111-char remark
Show marketing remark (111 chars)
Calling all investors! Come and make this promising property with endless potential your next investment today.
-
2020-10-29soldstatus $18,000
-
2013-07-31soldstatus $18,000
-
1988-07-20soldstatus $25,000
ⓘ Source: listings_history table (triggers on properties + properties_extension) + one-shot
backfill from property_details.listing_events for pre-trigger history.
Tax reassessment forecast OH · Partial reset (capped growth)
- Current annual tax
- $368 · $31/mo
- Projected year-2 tax
- $652 · $54/mo
- Expected delta
- +$284/yr (+$24/mo · 77.0%)
ⓘ Screening estimate from a state-policy table — verify with the county assessor before closing.
Climate risk First Street
- Flood 1/10 Low FEMA zone X (unshaded) · 0% chance over 30 yrs
- Wildfire 1/10 Low
- Heat 3/10 Moderate 7 d/yr ≥97°F today · 17 d/yr by 30 yrs out
- Wind 1/10 Low
- Air quality 3/10 Moderate 1 unhealthy d/yr today · 4 by 30 yrs out
Nearby sold comps map
Loading sold comps map…
Walkable amenities ~0.75 mi
Loading nearby amenities…
Taxation est. · year 1
- Rental income
- $13,436
- − Mortgage interest
- −$3,361
- − Property taxes
- −$368
- − Insurance
- −$300
- − Repairs & maintenance
- −$1,075
- − Management
- −$1,075
- − Depreciation
- −$1,745
- Taxable income
- $5,511
- Est. tax owed @ 24.0%
- −$1,323
- After-tax cash flow
- $4,847/yr
For passive investors: Depreciation is non-cash, so a rental often shows a tax loss while cash-flowing — sheltering income. Rental losses are passive: they offset passive income freely, and up to $25,000/yr can offset ordinary (W-2) income if you actively participate and your MAGI is under $100k (phasing out to $0 by $150k); unused losses carry forward. On sale, claimed depreciation is recaptured at up to 25%, and gains may owe capital-gains tax (a 1031 exchange can defer both). Figures are a year-1 estimate at your 24.0% rate — not tax advice; consult a CPA.
Schools (NCES district)
- District
- Warren City
- NCES district ID
- 3904499
- Math proficiency
- 22% ▼ -16.00%
- Reading proficiency
- 32% ▼ -9.00%
- Median HH income
- $28,222
- Composite
- 21.6/100
- National rank
- #8299
- State rank
- #599 of 656 in OH
Livability — Warren
- Score
- 73/100
- State rank
- #312
- US rank
- #5068
Category grades
Schools grade is shown separately in the Schools card above.
Census & demographics
- Census place
- Warren, OH
- County
- Trumbull County · 61,158 people
- City population
- 25,805
- Metro
- Youngstown-Warren-Boardman, OH-PA
- Population (ZIP)
- 25,805
- Household income
- $49,017
- Rent vs Own
- Severe rent burden
- 989.0
Population outlook (Trumbull County) Hauer SSP2
- Today (2025)
- 191,696 people
- By 2030
- 184,015 · -4.0%
- By 2040
- 166,810 · -13.0%
- By 2050
- 149,857 · -21.8%
- By 2075
- 115,769 · -39.6%
- By 2100
- 83,617 · -56.4%
Race, ethnicity, and origin ACS 2023
- Neighborhood character
- Predominantly White (77%)
- Race & ethnicity
- White 77% Black 14% Two or more races 7% Hispanic / Latino 4%
- Common ancestry
- Romanian 3% Slovak 2% Italian 1%
- Foreign-born
- 2% · Canada
- Languages at home
- 96% English-only · Other Indo-European 2% Spanish 2%
Political lean MEDSL · Trumbull
- 2024 margin
- R (+16.8) · D 41.2% · R 58.0%
- 2008→2024 swing
- -39.2pp toward R · 2008: 22.4pp · 2024: -16.8pp
- All cycles
- 2024: R+16.8 2020: R+10.6 2016: R+6.4 2012: D+22.2 2008: D+22.4
Not yet ingested
- Civics
- —
Market trends
- HPI YoY
- ▼ -42.50%
- Current HPI
- 218.3455
- Rent YoY
- —
- Metro
- Youngstown-Warren-Boardman, OH-PA
- State GDP YoY
- ▲ 1.98%
- F500 in state
- 48
Industry mix (Fortune 500 HQ in OH)
| Industry | F500 HQs | Revenue |
|---|---|---|
| Insurance | 3 | $145B |
|
||
| Industrial Machinery | 3 | $49B |
|
||
| Financial Services | 3 | $24B |
|
||
| Consumer Goods | 2 | $93B |
|
||
| Aerospace / Defense | 2 | $47B |
|
||
| Utilities | 2 | $33B |
|
||
Price history
+160.0% since first listed8 events — show timeline
- 2026-05-26 Listed $65,000 MLSNOW
- 2025-08-19 Sold (MLS) $39,000 MLSNOW
- 2025-08-18 Pending — MLSNOW
- 2025-07-25 Contingent — MLSNOW
- 2025-06-26 Listed $58,900 MLSNOW
- 2020-10-29 Sold (Public Records) $18,000 Public Records
- 2013-07-31 Sold (Public Records) $18,000 Public Records
- 1988-07-20 Sold (Public Records) $25,000 Public Records
Property tax history
-2.7%/yrLatest (2025): $368 · +4.8% YoY. Source: county tax records.
Cash-flow waterfall
monthlySold comps — $/sqft
last 12 mo · ≤1 miLoading sold comps…