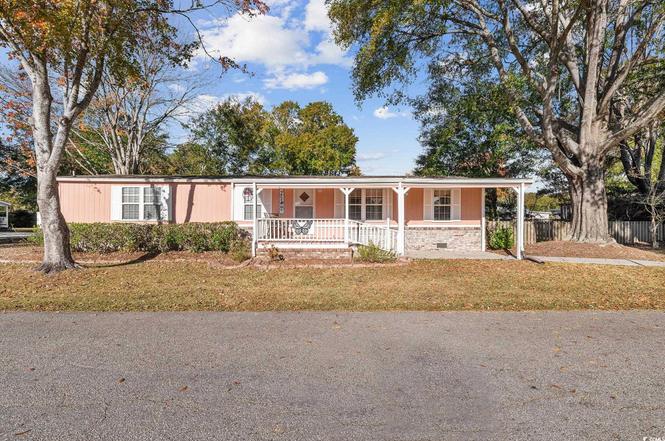
22 Crooked Island Cir · Murrells Inlet, SC
Flood risk 1/10 · Minimal
- FEMA flood zone
- X (unshaded)
- Chance of flooding over 30 yrs
- 0.0%
- Est. flood insurance / yr
- $507 – $1,088
Fire risk 4/10 · Minor
- Est. fire insurance / yr
- $783 – $1,453
Heat risk 9/10 · Severe
- Hot days now (above 106°F)
- 7 days/yr
- Hot days in 30 yrs
- 18 days/yr
Wind risk 9/10 · Severe
- Chance of severe wind over 30 yrs
- 99.0%
Air-quality risk 2/10 · Minimal
- Unhealthy air days now
- 0 days/yr
- Unhealthy air days in 30 yrs
- 1 days/yr
Risk factors via First Street. Map © Google.
Why this score? — see what drove the B+ grade
The composite is a weighted blend of 9 inputs, each scored 0–100. Each bar is that input's sub-score; the figure is the points it added to the 100-point composite (weight × sub-score).
- Cash flow +30.0/30.0
- ARV discount +15.0/15.0
- 1% rule +10.0/10.0
- DSCR +10.0/10.0
- Livability +3.8/5.0
- Rent growth +3.7/5.0
- Schools +2.7/10.0
- Condition / age +2.5/5.0
- Appreciation +0.0/10.0
$79,900
🖨 Deal sheet 📄 Offer letter ✓ Due diligence
Listing remarks
22 Crooked Island Circle is a rare find. This cared for 3 Bedroom 2 bath double wide with its beautiful elevated brick foundation, sits atop one of the largest lots within the community and a corner lot at that. The home has been updated thoughtfully with quality vinyl flooring and wainscoting throughout. Each bedroom is bright and open. The Master houses two closet's and an ensuite Bathroom. The second features a large walk in closet. The third bedroom, conveniently located near the guest bath. The Living room, kitchen and dining room truly makes this home special with its large open concept, perfect for entertaining and enjoying family. The sunroom that also sits off of the living room do
Key facts
- Large open concept
- Large corner lot
- Sunroom
Tags
Property features AI
Finance
- Other: Community outdoor pool
- Financial info: Has land lease: $900 monthly; Property is offered for sale; Pets allowed (owner only)
- HOA & community: Monthly association fees; Community clubhouse; Owner allowed golf carts; Owner allowed motorcycles; Pet restrictions; Tennis courts; Community recreation area; Community pool; Senior community
Exterior
- Parking: Carport; Parking for 2 vehicles (total)
- Security: Smoke detectors
- Utilities: Public water; Sewer available; Electricity available; Cable available
- Home design: Double wide mobile home; Resale condition; Crawlspace foundation
- Construction: Wood frame construction; Brick/mortar and crawlspace foundation
- Exterior features: Deck; Fence; Patio; Front porch; Screened porch; Storage
Interior
- Kitchen: Cooktop; Dishwasher; Refrigerator; Range hood; Kitchen exhaust fan; Breakfast bar
- Bedrooms: Bedroom 1 (approx. 8'4" x 11'3"); Bedroom 2 (approx. 11' x 11'4"); Additional room(s): Carolina room, Screened porch, Utility room
- Flooring: Carpet; Vinyl
- Bathrooms: 2 full bathrooms
- Heating & cooling: Central heating; Central air
- Interior features: Ceiling fans; Separate shower; Window treatments; Breakfast bar; Unfurnished
- Laundry & utility: Washer hookup; Utility room
Neighborhood map
What this means for you Summary
Snapshot
- This is a 3-bed/2.0-bath manufactured listed at $80k.
Deal economics
- At list price, monthly cash flow is $1k ($12k/yr) — positive.
- The deal already cash-flows at list — no discount required.
- Meets the 1% rule at list price ($2k rent vs $80k).
- Recommended offer: $70k (12.0% below list) — sets the bar for market timing.
- Cap rate 21.6% vs local median 2.2% in Murrells Inlet — top-decile yield for the area; either an underpriced asset or a hidden risk that comps aren't pricing in. Stress-test before assuming the spread holds.
Location & tenants
- Location reads 76/100 on livability (#25 in SC, #3,720 nationally) — a middle-class / working-renter tenant base. Strengths: crime A+, housing A+, health & safety A+; Watch: amenities F, commute F.
- Georgetown 01 (town): math 26% / reading 38% proficiency, ranked #51 of 80 in SC (top 64%) — families likely to look elsewhere, expect single-tenant / working-renter base with shorter leases.
- Market conditions: Rents rising fast (+4.7%/yr); 287 active listings in the ZIP; 8 comparable units currently listed for rent nearby; rentals at typical pace (median 24d on market — plan ~3-4 weeks tenant-placement turnaround); 323 units permitted in Georgetown County in 2024 (0 in 5+ unit buildings).
- This rent runs 34% of the median local income ($71k/yr) — at the standard rent-burdened threshold; future hikes will face affordability resistance.
Forward outlook
- Local home prices are declining (-3.0%/yr); year-one equity from $552 of loan paydown is wiped out by about $2k of value loss. Plan a longer hold.
- At projected returns (-3.0% appreciation + 4.7% rent growth), your $22k cash investment doubles in ~3 years — after that, you're playing with house money.
Negotiation context
- It's been on market 194 days — a 12% lower offer ($70k) is reasonable based on typical stale-listing flexibility.
- 2 sale attempts; this cycle's ask has dropped $45k (36%) from the opening price — seller is motivated, your offer sets the floor, not the list.
Risks & watch-outs
- Climate carrying-cost: severe wind risk, 99% chance of damaging wind over 30y; extreme-heat days projected 7→18/yr by 2055 (HVAC capex compounding) — expect insurance premiums to compound above CPI over the hold.
Questions for the listing agent
- It's been on market 194 days. Have you received any prior offers? Is the seller open to a 12% concession, seller financing, or rate buy-down credit?
- Why hasn't it sold? Are there any deal-killer items the seller is aware of (foundation, flood, title, zoning, code violations)?
- Is there a deadline driving the sale (1031 exchange, divorce, estate, relocation)? That informs how much negotiation room exists.
- Schools are A-rated — typically a magnet for longer-tenancy family renters. What's the average tenant stay here, and is there a school-zone premium baked into asking?
- What's the average days-on-market for RENTAL listings here right now (not sales)? A rising rental-DOM trend means longer vacancies and softer asking-rent achievability than the comps imply.
- What's the recent tenant-quality profile in this submarket — average credit score on applications, eviction rate, late-payment / NSF rate, and stable-employment percentage? A property-management company in the area should have these aggregated.
- How much new for-sale + rental construction is in the pipeline within 1–3 miles? Heavy new supply typically softens prices + rents 12–24 months out; constrained supply supports both.
Investment metrics
- 1% rule
- 2.49% ✓
- Cap rate
- 21.58%
- Cash-on-cash
- 54.59%
- DSCR
- 3.43
- GRM
- 3.4
CMA / ARV
- ARV (on-the-fly)
- $100,170
- Comps found
- 12
Show comp detail 12 sales within ~0.75 mi
| Address | Dist | Beds/Ba | Sqft | Sold | Price | $/sf | Match |
|---|---|---|---|---|---|---|---|
| 22 Crooked Island Cir | 0.00mi | 3/2.0 | 1,431 (0%) | 0mo | $65,000 | $45 | 100 |
| 8 Buccaneer St | 0.08mi | 3/2.0 | 1,400 (-2%) | 1mo | $59,000 | $42 | 91 |
| 100 Crooked Island Cir | 0.04mi | 3/2.0 | 1,344 (-6%) | 1mo | $40,000 | $30 | 87 |
| 163 Crooked Island Cir | 0.23mi | 3/2.0 | 1,344 (-6%) | 3mo | $75,000 | $56 | 76 |
| 832 Rusty Anchor Ct | 0.08mi | 3/2.0 | 1,578 (+10%) | 3mo | $195,000 | $124 | 76 |
| 983 Live Oak South Marlin Cir | 0.22mi | 3/2.0 | 1,500 (+5%) | 8mo | $278,000 | $185 | 75 |
| 927 Trout Ct | 0.19mi | 3/2.0 | 1,568 (+10%) | 2mo | $225,000 | $143 | 73 |
| 59 Crooked Island Cir | 0.17mi | 3/2.0 | 1,300 (-9%) | 6mo | $85,000 | $65 | 72 |
| 106 Inlet Oaks Village Ct | 0.52mi | 3/2.0 | 1,357 (-5%) | 8mo | $95,000 | $70 | 60 |
| 835 South Marlin Cir | 0.28mi | 3/2.0 | 1,238 (-14%) | 6mo | $155,000 | $125 | 59 |
| 74 Boone Loop | 0.74mi | 3/2.0 | 1,350 (-6%) | 1mo | $130,000 | $96 | 56 |
| 43 Ravenel Ct | 0.64mi | 2/2.0 (-1) | 1,260 (-12%) | 6mo | $54,900 | $44 | 40 |
Match score weights: distance 35% · size 25% · config 20% · recency 20%. Top-matched comps best support the ARV.
Projected returns pro-forma
-3.0% appreciation · 4.66% rent growth · sell at horizon
- IRR
- 54.7%
- Equity multiple
- 3.47×
- Total profit
- $55,271
- Equity at exit
- $11,913
- IRR
- 60.4%
- Equity multiple
- 7.53×
- Total profit
- $146,032
- Equity at exit
- $6,908
Cash invested: $22,372 (down + closing). Projections, not guarantees.
Landlord ↔ Tenant lean methodology
- Overall (STATE)
- 90 Strongly Landlord-Friendly
- State South Carolina
- 90 Strongly Landlord-Friendly · R+6
- County
- — inherits STATE
- City
- — inherits STATE
ZIP-level market 29576
- Home prices YoY
- -18.8%
- Rents YoY
- 4.7%
- Active inventory
- 287
- Price-to-rent
- 3.4×
Monthly cashflow live
- Estimated rent
- $1,987 high interval (Pro) →
- Mortgage (P&I)
- −$419
- Tax est. 1.5%
- −$100 /mo · $1,198/yr
- Insurance
- −$33
- HOA
- −$0
- Vacancy / Maint / Mgmt
- −$417
- Net cashflow
- $1,018
Break-even live
UW: 25.0% down · 7.5% · 30yr · 1.5% tax · 5.0% vac · 8.0% maint · 8.0% mgmt
Financing live
Cash to close
- Down payment
- $19,975
- Closing costs
- $2,397
- Reserves months
- —
- Total cash needed
- —
Loan-product check · same deal, 3 products live
Conventional
25% down · 7.5% · 30yr
- Down + closing
- —
- Monthly P&I
- —
- Monthly cashflow
- —
- DSCR
- —
- Eligible?
- —
Personal DTI + credit; lowest rate.
DSCR
20% down · 8.5% · 30yr
- Down + closing
- —
- Monthly P&I
- —
- Monthly cashflow
- —
- DSCR
- —
- Eligible?
- —
No personal income docs; deal must DSCR.
Hard money
10% down · 12.0% · 12mo
- Down + closing
- —
- Monthly P&I
- —
- Monthly cashflow
- —
- DSCR
- —
- Eligible?
- —
Short-term bridge; refi at stabilization.
Rent comps 8 comps
| Address | Beds | Baths | Sqft | Rent | $/sqft | DOM | Units | Dist |
|---|---|---|---|---|---|---|---|---|
| 4996 Highway 17 Business Murrells Inlet, SC | 2.0 | 2.0 | 925 | $1,500 | $1.62 | 14d | 1 | 0.42mi |
| 13 Muddy Bay Dr Murrells Inlet, SC | 2.0–3.0 | 2.0 | 1095 | $2,116 | $1.93 | 14d | 13 | 0.66mi |
| 50 Turning Stone Boulelvard Murrells Inlet, SC | 3.0 | 2.0 | 1350 | $1,750 | $1.30 | 23d | 1 | 0.75mi |
| 66 Turning Stone Boulelvard Unit 1 Murrells Inlet, SC | 3.0 | 2.0 | 1350 | $1,595 | $1.18 | 23d | 1 | 0.76mi |
| 66 Turning Stone Blvd Murrells Inlet, SC | 3.0 | 2.0 | 1450 | $1,700 | $1.17 | 23d | 1 | 0.78mi |
| 4323 Lotus Ct Unit F Murrells Inlet, SC | 3.0 | 2.0 | 1319 | $1,750 | $1.33 | 23d | 1 | 1.19mi |
| 4384 Daphne Ln Murrells Inlet, SC | 3.0 | 2.0 | 1450 | $1,950 | $1.34 | 21d | 1 | 1.39mi |
| 4376 Crepe Myrtle Ct Murrells Inlet, SC | 3.0 | 2.0 | 1500 | $1,850 | $1.23 | 23d | 1 | 1.48mi |
Listing history 12 events
-
2026-06-07statusdays on market $79,900 Pending 194 DOM
-
2026-06-03days on market $79,900 Active Under Contract 192 DOM
-
2026-06-02days on market $79,900 Active Under Contract 191 DOM
-
2026-06-01days on market $79,900 Active Under Contract 190 DOM
-
2026-05-31days on market $79,900 Active Under Contract 189 DOM
-
2026-05-30days on market $79,900 Active Under Contract 188 DOM
-
2026-05-24historical Active Under Contract
-
2026-05-10price $79,900
-
2026-02-02status Active
-
2026-02-02price $85,000
-
2026-01-22historical Active Under Contract
-
2025-11-23$125,000 Active
ⓘ Source: listings_history table (triggers on properties + properties_extension) + one-shot
backfill from property_details.listing_events for pre-trigger history.
Climate risk First Street
- Flood 1/10 Low FEMA zone X (unshaded) · 0% chance over 30 yrs
- Wildfire 4/10 Moderate
- Heat 9/10 Extreme 7 d/yr ≥106°F today · 18 d/yr by 30 yrs out
- Wind 9/10 Extreme 99% chance of damaging wind over 30 yrs
- Air quality 2/10 Low 0 unhealthy d/yr today · 1 by 30 yrs out
Nearby sold comps map
Loading sold comps map…
Walkable amenities ~0.75 mi
Loading nearby amenities…
Taxation est. · year 1
- Rental income
- $23,845
- − Mortgage interest
- −$4,476
- − Property taxes
- −$1,198
- − Insurance
- −$400
- − Repairs & maintenance
- −$1,908
- − Management
- −$1,908
- − Depreciation
- −$2,324
- Taxable income
- $11,632
- Est. tax owed @ 24.0%
- −$2,792
- After-tax cash flow
- $9,420/yr
For passive investors: Depreciation is non-cash, so a rental often shows a tax loss while cash-flowing — sheltering income. Rental losses are passive: they offset passive income freely, and up to $25,000/yr can offset ordinary (W-2) income if you actively participate and your MAGI is under $100k (phasing out to $0 by $150k); unused losses carry forward. On sale, claimed depreciation is recaptured at up to 25%, and gains may owe capital-gains tax (a 1031 exchange can defer both). Figures are a year-1 estimate at your 24.0% rate — not tax advice; consult a CPA.
Schools (NCES district)
- District
- Georgetown 01
- NCES district ID
- 4502280
- Math proficiency
- 26% ▼ -11.00%
- Reading proficiency
- 38% ▼ -5.00%
- Median HH income
- $43,045
- Composite
- 27.15/100
- National rank
- #7030
- State rank
- #51 of 80 in SC
Livability — Murrells Inlet
- Score
- 76/100
- State rank
- #25
- US rank
- #3720
Category grades
Schools grade is shown separately in the Schools card above.
Census & demographics
- Census place
- Murrells Inlet, SC
- County
- Horry County · 356,152 people
- City population
- 34,695
- Metro
- Myrtle Beach-Conway-North Myrtle Beach, SC-NC
- Population (ZIP)
- 34,695
- Household income
- $70,691
- Rent vs Own
- Severe rent burden
- 309.0
Population outlook (Georgetown County) Hauer SSP2
- Today (2025)
- 63,275 people
- By 2030
- 63,630 · +0.6%
- By 2040
- 63,130 · -0.2%
- By 2050
- 61,904 · -2.2%
- By 2075
- 59,305 · -6.3%
- By 2100
- 53,852 · -14.9%
Race, ethnicity, and origin ACS 2023
- Neighborhood character
- Predominantly White (89%)
- Race & ethnicity
- White 89% Hispanic / Latino 4% Black 3% Two or more races 3% Asian 2%
- Common ancestry
- Romanian 4% Slovak 3% Serbian 2%
- Foreign-born
- 5% · Canada, China, Vietnam
- Languages at home
- 96% English-only · Spanish 2% Chinese 1%
Political lean MEDSL · Georgetown
- 2024 margin
- R (+19.5) · D 39.6% · R 59.1% · Other 1.2%
- 2008→2024 swing
- -14.2pp toward R · 2008: -5.2pp · 2024: -19.5pp
- All cycles
- 2024: R+19.5 2020: R+12.7 2016: R+13.0 2012: R+7.6 2008: R+5.2
Not yet ingested
- Civics
- —
Market trends
- HPI YoY
- ▼ -57.53%
- Current HPI
- 248.5102
- Rent YoY
- ▲ 4.66%
- Metro
- Myrtle Beach-Conway-North Myrtle Beach, SC-NC
- State GDP YoY
- ▲ 4.51%
- F500 in state
- 2
Industry mix (Fortune 500 HQ in SC)
| Industry | F500 HQs | Revenue |
|---|---|---|
| Packaging | 1 | $7B |
|
||
Price history
-36.1% since first listed6 events — show timeline
- 2026-05-24 Contingent — CCAR
- 2026-05-10 Price Changed $79,900 CCAR
- 2026-02-02 Relisted — CCAR
- 2026-02-02 Price Changed $85,000 CCAR
- 2026-01-22 Contingent — CCAR
- 2025-11-23 Listed $125,000 CCAR
Cash-flow waterfall
monthlySold comps — $/sqft
last 12 mo · ≤1 miLoading sold comps…