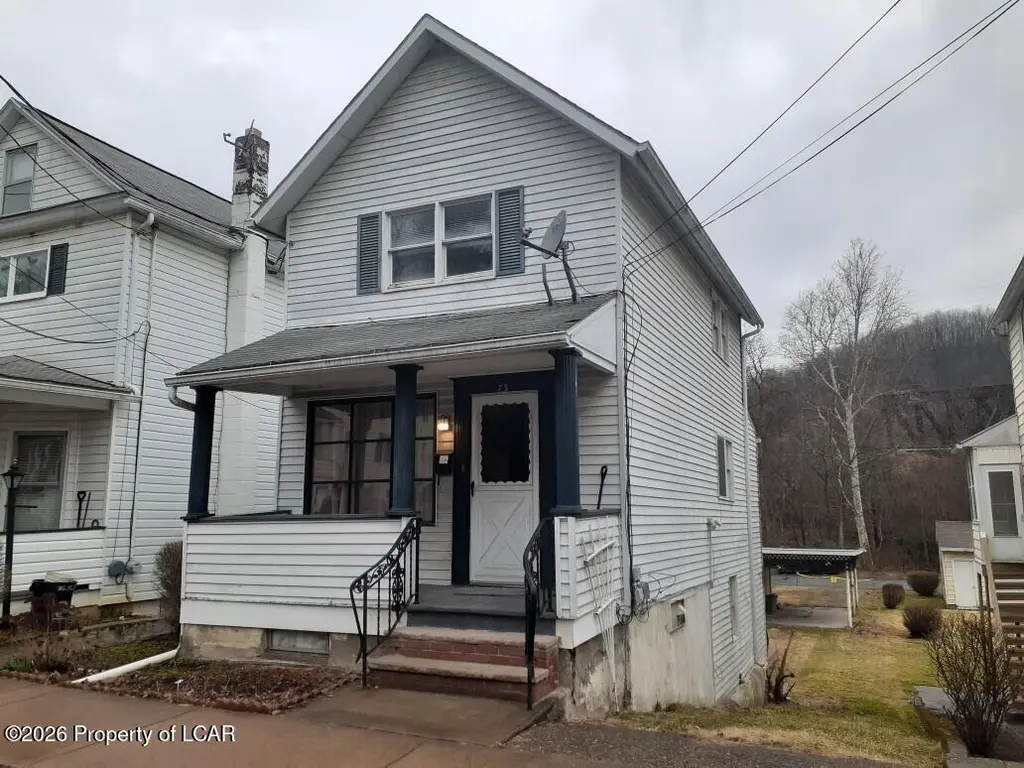
73 Chestnut St · Wilkes-Barre, PA
Flood risk 9/10 · Severe
- FEMA flood zone
- X (shaded)
- Chance of flooding over 30 yrs
- 0.99%
- Est. flood insurance / yr
- $507 – $1,088
Fire risk 1/10 · Minimal
- Est. fire insurance / yr
- $511 – $949
Heat risk 4/10 · Minor
- Hot days now (above 95°F)
- 7 days/yr
- Hot days in 30 yrs
- 16 days/yr
Wind risk 3/10 · Minor
- Chance of severe wind over 30 yrs
- 5.0%
Air-quality risk 3/10 · Minor
- Unhealthy air days now
- 2 days/yr
- Unhealthy air days in 30 yrs
- 4 days/yr
Risk factors via First Street. Map © Google.
Why this score? — see what drove the C- grade
The composite is a weighted blend of 9 inputs, each scored 0–100. Each bar is that input's sub-score; the figure is the points it added to the 100-point composite (weight × sub-score).
- Cash flow +17.0/30.0
- ARV discount +15.0/15.0
- DSCR +5.3/10.0
- 1% rule +4.6/10.0
- Rent growth +2.5/5.0
- Livability +2.5/5.0
- Condition / age +2.5/5.0
- Schools +2.1/10.0
- Appreciation +0.0/10.0
$129,900
🖨 Deal sheet (PDF) 📄 Offer letter ✓ Due diligence
Listing remarks
Nicely maintained 3-level w/ all new carpets & all newly painted. Upgraded eat-in kitchen w/ new backsplash, countertops and tile flooring. 1-1/2 baths. Rear deck w/ spacious back yard, 2 driveways plus carport.
Key facts
- New tile flooring
- Spacious back yard
- New countertops
Tags
Neighborhood map
What this means for you Summary
Snapshot
- This is a 2-bed/1.5-bath single-family listed at $130k.
Deal economics
- At list price, monthly cash flow is $21 ($255/yr) — positive.
- The deal already cash-flows at list — no discount required.
- To meet the 1% rule (rent ≥ 1% of price), the offer needs to be $125k (4.0% below list).
- Recommended offer: $125k (4.0% below list) — sets the bar for 1% rule.
- Cap rate 7.1% vs local median 5.9% in Wilkes-Barre — meaningfully above typical; check what's discounted (condition, days-on-market, listing class) to confirm the premium yield is real.
Location & tenants
- Location reads: area grade C — affects rentability + tenant quality, not the cash-flow math above.
- Wilkes-Barre Area SD (urban): math 19% / reading 32% proficiency, ranked #469 of 539 in PA (top 87%) — low school quality limits family demand, transient renter base, plan for 1-2y turnover; 61% free/reduced lunch — lower-income household profile, screen leases tightly.
- Zoned schools: Daniel J Flood El Sch (math 12% / reading 27%, grade F, #1,276 of 1,518 statewide, top 85%, 592 students, 100% FRL); Solomon/Plains Ms (math 2% / reading 27%, grade F, #475 of 512 statewide, top 93%, 736 students, 100% FRL) — zoned schools average 100% FRL vs 61% district-wide (39 pts higher); higher-poverty schools than district average — tighter screening recommended.
- Market conditions: 76 active listings in the ZIP; 33 comparable units currently listed for rent nearby; rentals at typical pace (median 23d on market — plan ~3-4 weeks tenant-placement turnaround); 45% of comp listings sitting > 30 days — soft ceiling on asking rent; 349 units permitted in Luzerne County in 2024 (16 in 5+ unit buildings).
Forward outlook
- Local home prices are declining (-3.0%/yr); year-one equity from $898 of loan paydown is wiped out by about $4k of value loss. Plan a longer hold.
- Luzerne County population projected at +4% by 2050 — modest demand growth; plan on rents tracking national, not racing it.
Negotiation context
- It's been on market 36 days — a 3% lower offer ($126k) is reasonable based on typical stale-listing flexibility.
- 2 sale attempts with the ask held roughly flat each time — persistent listings suggest the price (not the market) is what's stuck; bring a comps-based counter.
Risks & watch-outs
- Watch-outs: flood insurance adds $66/mo; built in 1920 — expect roof / HVAC / electrical / plumbing capex.
- Climate carrying-cost: severe flood risk — expect insurance premiums to compound above CPI over the hold.
Questions for the listing agent
- It's been on market 36 days. Have you received any prior offers? Is the seller open to a 4% concession, seller financing, or rate buy-down credit?
- Built in 1920 — when were the roof, HVAC, electrical panel, plumbing, and water heater last replaced?
- What's the actual annual flood-insurance premium (NFIP or private), and is the property in a SFHA with mandatory coverage?
- Is there a deadline driving the sale (1031 exchange, divorce, estate, relocation)? That informs how much negotiation room exists.
- What's the average days-on-market for RENTAL listings here right now (not sales)? A rising rental-DOM trend means longer vacancies and softer asking-rent achievability than the comps imply.
- What's the recent tenant-quality profile in this submarket — average credit score on applications, eviction rate, late-payment / NSF rate, and stable-employment percentage? A property-management company in the area should have these aggregated.
- How much new for-sale + rental construction is in the pipeline within 1–3 miles? Heavy new supply typically softens prices + rents 12–24 months out; constrained supply supports both.
Investment metrics
- 1% rule
- 0.96% ✗
- Cap rate
- 7.10%
- Cash-on-cash
- 2.89%
- DSCR
- 1.13
- GRM
- 8.7
CMA / ARV
- ARV (on-the-fly)
- $170,772
- Comps found
- 2
Show comp detail 2 sales within ~0.75 mi
| Address | Dist | Beds/Ba | Sqft | Sold | Price | $/sf | Match |
|---|---|---|---|---|---|---|---|
| 16 Brookside St | 0.39mi | 2/1.0 | 887 (+11%) | 1mo | $140,000 | $158 | 60 |
| 369 N Pennsylvania Ave | 0.74mi | 3/1.0 (+1) | 819 (+3%) | 9mo | $175,000 | $214 | 47 |
Match score weights: distance 35% · size 25% · config 20% · recency 20%. Top-matched comps best support the ARV.
Projected returns pro-forma
-3.0% appreciation · 3.0% rent growth · sell at horizon
- IRR
- -15.1%
- Equity multiple
- 0.46×
- Total profit
- $-19,637
- Equity at exit
- $19,369
- IRR
- -6.5%
- Equity multiple
- 0.58×
- Total profit
- $-15,115
- Equity at exit
- $11,231
Cash invested: $36,372 (down + closing). Projections, not guarantees.
Landlord ↔ Tenant lean methodology
- Overall (STATE)
- 62 Landlord-Friendly
- State Pennsylvania
- 62 Landlord-Friendly · EVEN
- County
- — inherits STATE
- City
- — inherits STATE
ZIP-level market 18705
- Home prices YoY
- -22.7%
- Active inventory
- 76
- Price-to-rent
- 8.7×
Monthly cashflow live
- Estimated rent
- $1,247 high interval (Pro) →
- Mortgage (P&I)
- −$681
- Tax est. 1.5%
- −$162 /mo · $1,948/yr
- Insurance
- −$54
- Flood insurance flood zone
- −$66 /mo · $798/yr
- HOA
- −$0
- Vacancy / Maint / Mgmt
- −$262
- Net cashflow
- $21
Break-even live
Sensitivity live
| Price | -10% $111 | -5% $66 | +0% $21 | +5% $-24 | +10% $-69 |
|---|---|---|---|---|---|
| Rent | -10% $-77 | -5% $-28 | +0% $21 | +5% $71 | +10% $120 |
| Rate | -1.0pp $87 | -0.5pp $54 | base $21 | +0.5pp $-12 | +1.0pp $-47 |
UW: 25.0% down · 7.5% · 30yr · 1.5% tax · 5.0% vac · 8.0% maint · 8.0% mgmt
Financing live
Cash to close
- Down payment
- $32,475
- Closing costs
- $3,897
- Reserves months
- —
- Total cash needed
- —
Loan-product check · same deal, 3 products live
Conventional
25% down · 7.5% · 30yr
- Down + closing
- —
- Monthly P&I
- —
- Monthly cashflow
- —
- DSCR
- —
- Eligible?
- —
Personal DTI + credit; lowest rate.
DSCR
20% down · 8.5% · 30yr
- Down + closing
- —
- Monthly P&I
- —
- Monthly cashflow
- —
- DSCR
- —
- Eligible?
- —
No personal income docs; deal must DSCR.
Hard money
10% down · 12.0% · 12mo
- Down + closing
- —
- Monthly P&I
- —
- Monthly cashflow
- —
- DSCR
- —
- Eligible?
- —
Short-term bridge; refi at stabilization.
Rent comps 33 comps
| Address | Beds | Baths | Sqft | Rent | $/sqft | DOM | Units | Dist |
|---|---|---|---|---|---|---|---|---|
| 13 E Chestnut St Unit 1 Wilkes-Barre, PA | 3.0 | 1.0 | 900 | $1,195 | $1.33 | 45d | 1 | 0.19mi |
| 572 N Franklin St Wilkes Barre, PA | 2.0 | 1.0 | 1042 | $1,100 | $1.06 | 45d | 1 | 0.24mi |
| 572 N Franklin St Wilkes Barre, PA | 2.0 | 1.0 | 1042 | $1,050 | $1.01 | 23d | 1 | 0.24mi |
| 779 N Washington St Wilkes-Barre, PA | 1.0 | 1.0 | 600 | $1,000 | $1.67 | 15d | 1 | 0.29mi |
| 301 N Main St Unit 2 Wilkes-Barre, PA | 3.0 | 1.0 | 1050 | $1,300 | $1.24 | 23d | 1 | 0.71mi |
| 168 Kidder St City of Wilkes Barre, PA | 2.0 | 1.0 | 750 | $1,250 | $1.67 | 23d | 1 | 0.82mi |
| 168-170 Kidder St Wilkes-Barre, PA | 2.0 | 1.0 | 750 | $1,250 | $1.67 | 23d | 1 | 0.82mi |
| 261 N Washington St Wilkes Barre, PA | 3.0 | 1.0 | 1050 | $1,400 | $1.33 | 45d | 1 | 0.87mi |
| 402 Scott St Fl 3 Wilkes-Barre, PA | 2.0 | 1.0 | 761 | $950 | $1.25 | 45d | 1 | 0.87mi |
| 11 Holiday Dr Kingston, PA | 1.0–3.0 | 1.0–2.5 | 1083 | $2,044 | $1.89 | 15d | 14 | 0.87mi |
| 423 Scott St Apt 1 Wilkes-Barre, PA | 3.0 | 1.0 | 1100 | $1,450 | $1.32 | 45d | 1 | 0.89mi |
| 268 N Pennsylvania Ave Unit 2 Wilkes-Barre, PA | 3.0 | 1.0 | 758 | $1,300 | $1.72 | 23d | 1 | 0.89mi |
| 102 Maffett St Wilkes-Barre, PA | 1.0 | 1.0 | 800 | $1,200 | $1.50 | 45d | 1 | 0.95mi |
| 30 Chapel St Wilkes Barre, PA | 1.0 | 1.0 | 700 | $1,150 | $1.64 | 23d | 1 | 0.98mi |
| 100 Parkway Blvd Kingston, PA | 2.0 | 1.0 | 650 | $1,400 | $2.15 | 15d | 1 | 1.00mi |
| 273 New Hancock St Unit 2 Wilkes-Barre, PA | 2.0 | 1.0 | 725 | $1,300 | $1.79 | 23d | 1 | 1.08mi |
| 157 E Walnut St Kingston, PA | 2.0 | 1.0 | 900 | $1,000 | $1.11 | 15d | 1 | 1.08mi |
| 273 New Hancock St Apt 3 Wilkes-Barre, PA | 1.0 | 1.0 | 625 | $1,125 | $1.80 | 45d | 1 | 1.08mi |
| 151 E Walnut St Kingston, PA | 2.0 | 1.0 | 900 | $1,000 | $1.11 | 15d | 1 | 1.09mi |
| 19 N River St Unit 403 Wilkes-Barre, PA | 2.0 | 1.0 | 723 | $1,600 | $2.21 | 15d | 1 | 1.25mi |
| 19 N River St Unit 308 Wilkes-Barre, PA | 2.0 | 1.5 | 910 | $1,600 | $1.76 | 15d | 1 | 1.25mi |
| 2 N Diamond St Wilkes-Barre, PA | 3.0 | 1.0 | 1000 | $1,500 | $1.50 | 23d | 1 | 1.26mi |
| 17 E Carey St Unit 3 Wilkes-Barre, PA | 2.0 | 1.0 | 1000 | $1,200 | $1.20 | 45d | 1 | 1.31mi |
| 17 E Carey St Unit 1 Wilkes-Barre, PA | 1.0 | 1.0 | 560 | $1,000 | $1.79 | 45d | 1 | 1.31mi |
| 67-69 Public Sq Wilkes-Barre, PA | 2.0 | 1.0 | 910 | $1,875 | $2.06 | 45d | 1 | 1.34mi |
| 26 E Carey St Apt 4 Wilkes-Barre, PA | 3.0 | 1.0 | 1050 | $1,300 | $1.24 | 15d | 1 | 1.34mi |
| 67-69 Public Sq #1203 Wilkes Barre, PA | 2.0 | 1.0 | 875 | $1,825 | $2.09 | 45d | 1 | 1.35mi |
| 42 N Thomas Ave Kingston, PA | 1.0 | 1.0 | 950 | $1,150 | $1.21 | 46d | 1 | 1.37mi |
| 300 Market St Ste 104 Kingston, PA | 2.0 | 2.0 | 873 | $1,950 | $2.23 | 15d | 1 | 1.40mi |
| 942 Wyoming Ave Unit A Forty Fort, PA | 2.0 | 1.5 | 1054 | $1,600 | $1.52 | 45d | 1 | 1.46mi |
| 313 Rutter Ave Kingston, PA | 2.0 | 1.0 | 727 | $1,450 | $1.99 | 45d | 1 | 1.48mi |
| 313 Rutter Ave Kingston, PA | 2.0 | 1.0 | 678 | $1,450 | $2.14 | 23d | 1 | 1.48mi |
| 214 Mayock St Unit 3 Wilkes-Barre, PA | 2.0 | 1.0 | 1000 | $1,150 | $1.15 | 45d | 1 | 1.49mi |
Listing history 4 events
-
2026-04-22status Pending
-
2026-03-24status Active
-
2026-03-21status Pending
-
2026-03-13$129,900 Active
ⓘ Source: listings_history table (triggers on properties + properties_extension) + one-shot
backfill from property_details.listing_events for pre-trigger history.
Climate risk First Street
- Flood 9/10 Extreme FEMA zone X (shaded) · 99% chance over 30 yrs
- Wildfire 1/10 Low
- Heat 4/10 Moderate 7 d/yr ≥95°F today · 16 d/yr by 30 yrs out
- Wind 3/10 Moderate 5% chance of damaging wind over 30 yrs
- Air quality 3/10 Moderate 2 unhealthy d/yr today · 4 by 30 yrs out
Nearby sold comps map
Loading sold comps map…
Walkable amenities ~0.75 mi
Loading nearby amenities…
Taxation est. · year 1
- Rental income
- $14,968
- − Mortgage interest
- −$7,276
- − Property taxes
- −$1,948
- − Insurance
- −$1,447
- − Repairs & maintenance
- −$1,197
- − Management
- −$1,197
- − Depreciation
- −$3,779
- Taxable loss
- −$1,878
- Est. tax savings @ 24.0%
- +$451
- After-tax cash flow
- $705/yr
For passive investors: Depreciation is non-cash, so a rental often shows a tax loss while cash-flowing — sheltering income. Rental losses are passive: they offset passive income freely, and up to $25,000/yr can offset ordinary (W-2) income if you actively participate and your MAGI is under $100k (phasing out to $0 by $150k); unused losses carry forward. On sale, claimed depreciation is recaptured at up to 25%, and gains may owe capital-gains tax (a 1031 exchange can defer both). Figures are a year-1 estimate at your 24.0% rate — not tax advice; consult a CPA.
Schools (NCES district)
- District
- Wilkes-Barre Area SD
- NCES district ID
- 4226300
- Math proficiency
- 19% ▼ -2.00%
- Reading proficiency
- 32% ▼ -9.00%
- Median HH income
- $37,420
- Composite
- 21.22/100
- National rank
- #8409
- State rank
- #469 of 539 in PA
Livability — Wilkes-Barre
No livability data for this city. (Only ~50 U.S. cities are tracked.)
Census & demographics
- Census place
- Wilkes-Barre, PA
- County
- Luzerne County · 118,885 people
- City population
- 73,981
- Metro
- Scranton--Wilkes-Barre, PA
- Population (ZIP)
- 15,624
- Household income
- $59,344
- Rent vs Own
- Severe rent burden
- 549.0
Population outlook (Luzerne County) Hauer SSP2
- Today (2025)
- 319,505 people
- By 2030
- 319,943 · +0.1%
- By 2040
- 322,643 · +1.0%
- By 2050
- 330,817 · +3.5%
- By 2075
- 379,145 · +18.7%
- By 2100
- 431,908 · +35.2%
Race, ethnicity, and origin ACS 2023
- Neighborhood character
- Predominantly White (68%)
- Race & ethnicity
- White 68% Hispanic / Latino 22% Two or more races 11% Black 4%
- Hispanic origin (detail)
- Mexican 7% Puerto Rican 5% Dominican 9%
- Common ancestry
- Romanian 19% Scotch-Irish 3% Polish 2%
- Foreign-born
- 11% · Canada
- Languages at home
- 79% English-only · Spanish 17% Other Indo-European 2% Russian/Polish/Slavic 1%
Political lean MEDSL · Luzerne
- 2024 margin
- R (+19.2) · D 40.0% · R 59.2%
- 2008→2024 swing
- -27.6pp toward R · 2008: 8.4pp · 2024: -19.2pp
- All cycles
- 2024: R+19.2 2020: R+14.4 2016: R+19.6 2012: D+4.8 2008: D+8.4
Not yet ingested
- Civics
- —
Market trends
- HPI YoY
- ▼ -71.77%
- Current HPI
- 243.9176
- Rent YoY
- —
- Metro
- Scranton--Wilkes-Barre, PA
- State GDP YoY
- ▲ 1.68%
- F500 in state
- 34
Industry mix (Fortune 500 HQ in PA)
| Industry | F500 HQs | Revenue |
|---|---|---|
| Healthcare | 2 | $309B |
|
||
| Insurance | 2 | $27B |
|
||
| Telecommunications / Media | 1 | $124B |
|
||
| Industrial Distribution | 1 | $22B |
|
||
| Financial Services | 1 | $20B |
|
||
| Chemicals / Materials | 1 | $18B |
|
||
Price history
4 events — show timeline
- 2026-04-22 Pending — LCAR
- 2026-03-24 Relisted — LCAR
- 2026-03-21 Pending — LCAR
- 2026-03-13 Listed $129,900 LCAR
Property tax history
+20.4%/yrLatest (2026): $7,580 · +0.1% YoY. Source: county tax records.
Cash-flow waterfall
monthlySold comps — $/sqft
last 12 mo · ≤1 miLoading sold comps…