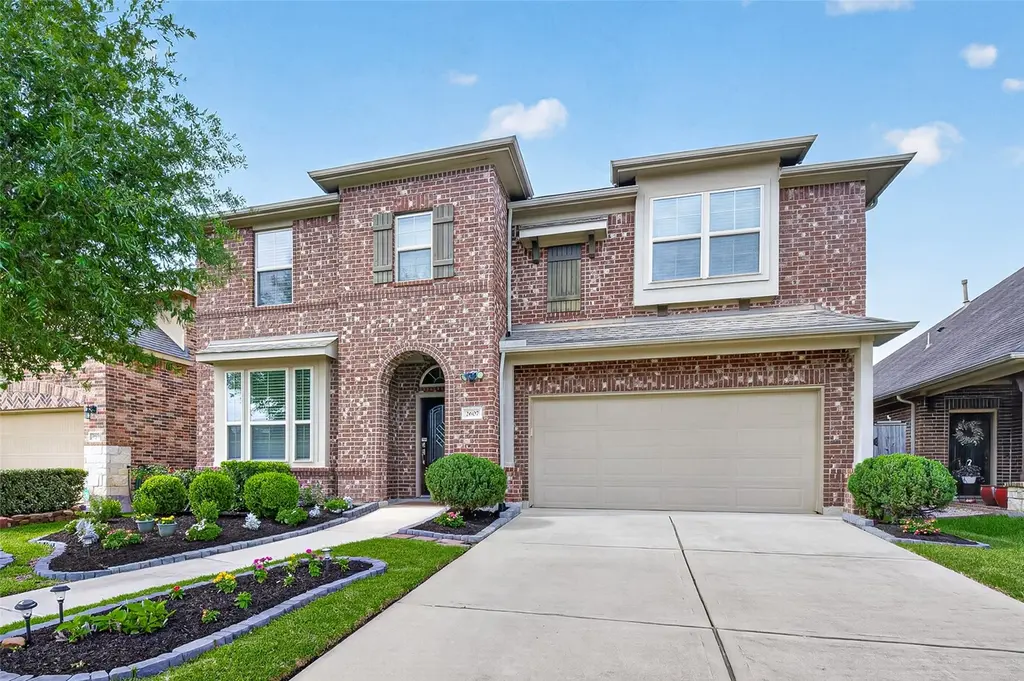
2607 River Run Rd · Sienna, TX
Flood risk 1/10 · Minimal
- FEMA flood zone
- X
- Chance of flooding over 30 yrs
- 0.0%
- Est. flood insurance / yr
- $507 – $1,088
Fire risk 4/10 · Minor
- Est. fire insurance / yr
- $1,222 – $2,270
Heat risk 9/10 · Severe
- Hot days now (above 111°F)
- 7 days/yr
- Hot days in 30 yrs
- 25 days/yr
Wind risk 9/10 · Severe
- Chance of severe wind over 30 yrs
- 99.0%
Air-quality risk 2/10 · Minimal
- Unhealthy air days now
- 2 days/yr
- Unhealthy air days in 30 yrs
- 2 days/yr
Risk factors via First Street. Map © Google.
Why this score? — see what drove the D grade
The composite is a weighted blend of 9 inputs, each scored 0–100. Each bar is that input's sub-score; the figure is the points it added to the 100-point composite (weight × sub-score).
- Cash flow +9.6/30.0
- ARV discount +9.0/15.0
- 1% rule +4.8/10.0
- Schools +4.5/10.0
- Appreciation +4.2/10.0
- DSCR +2.7/10.0
- Rent growth +2.5/5.0
- Livability +2.5/5.0
- Condition / age +2.5/5.0
$449,900
🖨 Deal sheet (PDF) 📄 Offer letter ✓ Due diligence
Listing remarks
Step into this stunning, move-in-ready residence featuring soaring high ceilings, 4 spacious bedrooms, and 3.5 designer baths. The gourmet kitchen is a chef’s dream, complete with a stone center island, custom backsplash tiling, and premium pull-out cabinetry. The entire first floor features upgraded wood-look tile that seamlessly integrates with an ambient built-in speaker system. Outside, a full-property sprinkler system ensures effortless curb appeal for this fully upgraded gem. Extended backyard, no back neighbours!!
Key facts
- Stone center island
- Gourmet kitchen
- 6,351 sq ft lot
Tags
Property features AI
Finance
- HOA & community: Community: Sienna; Community amenities include tennis courts and trails; Annual association fee
Exterior
- Parking: Attached garage; 2 garage spaces
- Utilities: Public water; Public sewer
- Home design: Residential property; Full ownership; Built in 2015; Slab foundation
- Construction: Brick, stone, and vinyl siding exterior; Composition roof
- Exterior features: Subdivision lot; Concrete road access
Interior
- Bedrooms: Primary bedroom on the first floor (approx. 14 x 17); Secondary bedrooms on the second floor (approx. 10 x 11; 14 x 11; 10 x 13)
- Bathrooms: 3 full bathrooms; 1 half bathroom
- Heating & cooling: Central heating (gas); Central electric air conditioning
- Interior features: Family room; Living room; 6 total rooms
Neighborhood map
What this means for you Summary
Snapshot
- This is a 4-bed/4.0-bath single-family listed at $450k.
Deal economics
- At list price, monthly cash flow is $-307 ($-4k/yr) — negative.
- To cash-flow at today's rent, offer at most $396k (12.0% below list).
- To meet the 1% rule (rent ≥ 1% of price), the offer needs to be $442k (1.8% below list).
- Recommended offer: $396k (12.0% below list) — sets the bar for cash-flow.
- Cap rate 5.5% vs local median 3.3% in Sienna — top-decile yield for the area; either an underpriced asset or a hidden risk that comps aren't pricing in. Stress-test before assuming the spread holds.
Location & tenants
- Location reads: area grade D — affects rentability + tenant quality, not the cash-flow math above.
- Fort Bend ISD (suburban): math 44% / reading 53% proficiency, ranked #140 of 826 in TX (top 17%) — families likely to look elsewhere, expect single-tenant / working-renter base with shorter leases.
- Zoned schools: Heritage Rose El (math 29% / reading 28%, grade F, #2,706 of 4,322 statewide, top 63%, 1,209 students, 83% FRL); Billy Baines Middle (math 47% / reading 53%, grade C, #347 of 1,662 statewide, top 21%, 1,296 students, 37% FRL); Ridge Point H S (math 61% / reading 69%, grade B, #198 of 1,632 statewide, top 12%, 3,170 students, 31% FRL) — zoned schools average 50% FRL vs 35% district-wide (15 pts higher); higher-poverty schools than district average — tighter screening recommended.
- Market conditions: Rents soft (-0.1%/yr); 1229 active listings in the ZIP; 5 comparable units currently listed for rent nearby; rentals leasing fast (median 12d on market — plan ~1-2 weeks tenant-placement turnaround); high-income renter base; 12,093 units permitted in Fort Bend County in 2024 (815 in 5+ unit buildings).
- This rent runs 41% of the median local income ($129k/yr) — at the standard rent-burdened threshold; future hikes will face affordability resistance.
Forward outlook
- Local home prices are declining (-1.7%/yr); year-one equity from $3k of loan paydown is wiped out by about $8k of value loss. Plan a longer hold.
- Fort Bend County population projected at +75% by 2050 — long-run rental-demand tailwind backs the buy-and-hold thesis.
Negotiation context
- It's been on market 37 days — a 3% lower offer ($436k) is reasonable based on typical stale-listing flexibility.
Risks & watch-outs
- Watch-outs: property tax is 3.0% of price.
- Climate carrying-cost: severe wind risk, 99% chance of damaging wind over 30y; extreme-heat days projected 7→25/yr by 2055 (HVAC capex compounding) — expect insurance premiums to compound above CPI over the hold.
Questions for the listing agent
- What do current leases actually rent for vs. the listed asking? Can we see a recent rent roll and the last 12 months of T-12 income?
- It's been on market 37 days. Have you received any prior offers? Is the seller open to a 12% concession, seller financing, or rate buy-down credit?
- Property tax is high relative to price — has the assessment been appealed recently, and will the sale trigger a re-assessment?
- What does the HOA fee cover, when was the last increase, and are there any pending special assessments or reserve-fund shortfalls?
- Is there a deadline driving the sale (1031 exchange, divorce, estate, relocation)? That informs how much negotiation room exists.
- The area grade is low — what's the realistic commute time and amenity access for the typical tenant pool here? Any planned neighborhood developments (good or bad) we should know about?
- What's the average days-on-market for RENTAL listings here right now (not sales)? A rising rental-DOM trend means longer vacancies and softer asking-rent achievability than the comps imply.
- What's the recent tenant-quality profile in this submarket — average credit score on applications, eviction rate, late-payment / NSF rate, and stable-employment percentage? A property-management company in the area should have these aggregated.
- How much new for-sale + rental construction is in the pipeline within 1–3 miles? Heavy new supply typically softens prices + rents 12–24 months out; constrained supply supports both.
Investment metrics
- 1% rule
- 0.98% ✗
- Cap rate
- 5.47%
- Cash-on-cash
- -2.92%
- DSCR
- 0.87
- GRM
- 8.5
CMA / ARV
- ARV (median comp)
- $465,896
- List price
- $449,900
- Delta
- -3.43%
- Verdict
- FAIR
- Comps
- 20 within 1.0 mi
Show comp detail 12 sales within ~0.75 mi
| Address | Dist | Beds/Ba | Sqft | Sold | Price | $/sf | Match |
|---|---|---|---|---|---|---|---|
| 10018 Foggy Riv | 0.12mi | 3/3.5 (-1) | 2,944 (+3%) | 1mo | $449,999 | $153 | 81 |
| 2610 Lazy Vine Ln | 0.45mi | 4/4.5 | 2,907 (+2%) | 1mo | $715,000 | $246 | 73 |
| 10143 Deerpark Dr | 0.49mi | 4/3.5 | 2,874 (+1%) | 2mo | $475,000 | $165 | 72 |
| 10023 Starhill Ct | 0.45mi | 4/3.0 | 2,930 (+3%) | 4mo | $450,000 | $154 | 67 |
| 9507 Shaded Tree Dr | 0.72mi | 4/3.5 | 2,935 (+3%) | 4mo | $445,000 | $152 | 56 |
| 10439 Caribou Ct | 0.71mi | 4/2.5 | 2,924 (+2%) | 3mo | $414,900 | $142 | 54 |
| 2827 Monarch Xing | 0.54mi | 5/4.0 (+1) | 3,119 (+9%) | 0mo | $550,000 | $176 | 54 |
| 3031 Reindeer Run | 0.70mi | 4/3.0 | 2,658 (-7%) | 1mo | $390,000 | $147 | 51 |
| 9418 San Marco Dr | 0.60mi | 4/4.5 | 3,266 (+14%) | 4mo | $745,000 | $228 | 43 |
| 2610 Parker Oak Pass | 0.75mi | 4/3.5 | 3,220 (+13%) | 1mo | $510,000 | $158 | 41 |
| 2018 Edgemont Pl | 0.67mi | 5/3.5 (+1) | 3,227 (+13%) | 2mo | $499,500 | $155 | 38 |
| 2303 Jasper Pt | 0.73mi | 4/3.5 | 3,279 (+15%) | 2mo | $519,000 | $158 | 37 |
Match score weights: distance 35% · size 25% · config 20% · recency 20%. Top-matched comps best support the ARV.
Projected returns pro-forma
-1.67% appreciation · 0.0% rent growth · sell at horizon
- IRR
- -16.1%
- Equity multiple
- 0.37×
- Total profit
- $-79,263
- Equity at exit
- $94,357
- IRR
- -13.7%
- Equity multiple
- 0.06×
- Total profit
- $-118,977
- Equity at exit
- $87,397
Cash invested: $125,972 (down + closing). Projections, not guarantees.
Landlord ↔ Tenant lean methodology
- Overall (STATE)
- 87 Strongly Landlord-Friendly
- State Texas
- 87 Strongly Landlord-Friendly · R+5
- County
- — inherits STATE
- City
- — inherits STATE
ZIP-level market 77459
- Home prices YoY
- -0.8%
- Rents YoY
- -0.1%
- Active inventory
- 1229
- Price-to-rent
- 8.5×
Monthly cashflow live
- Estimated rent
- $4,419 high interval (Pro) →
- Mortgage (P&I)
- −$2,359
- Tax from tax record
- −$1,130 /mo · $13,561/yr
- Insurance
- −$187
- HOA
- −$121
- Vacancy / Maint / Mgmt
- −$928
- Net cashflow
- $-307
Break-even live
Sensitivity live
| Price | -10% $-52 | -5% $-179 | +0% $-307 | +5% $-434 | +10% $-561 |
|---|---|---|---|---|---|
| Rent | -10% $-656 | -5% $-481 | +0% $-307 | +5% $-132 | +10% $42 |
| Rate | -1.0pp $-80 | -0.5pp $-192 | base $-307 | +0.5pp $-423 | +1.0pp $-542 |
UW: 25.0% down · 7.5% · 30yr · 1.5% tax · 5.0% vac · 8.0% maint · 8.0% mgmt
Financing live
Cash to close
- Down payment
- $112,475
- Closing costs
- $13,497
- Reserves months
- —
- Total cash needed
- —
Loan-product check · same deal, 3 products live
Conventional
25% down · 7.5% · 30yr
- Down + closing
- —
- Monthly P&I
- —
- Monthly cashflow
- —
- DSCR
- —
- Eligible?
- —
Personal DTI + credit; lowest rate.
DSCR
20% down · 8.5% · 30yr
- Down + closing
- —
- Monthly P&I
- —
- Monthly cashflow
- —
- DSCR
- —
- Eligible?
- —
No personal income docs; deal must DSCR.
Hard money
10% down · 12.0% · 12mo
- Down + closing
- —
- Monthly P&I
- —
- Monthly cashflow
- —
- DSCR
- —
- Eligible?
- —
Short-term bridge; refi at stabilization.
Rent comps 5 comps
| Address | Beds | Baths | Sqft | Rent | $/sqft | DOM | Units | Dist |
|---|---|---|---|---|---|---|---|---|
| 1714 Forest Mist Dr Missouri City, TX | 3.0 | 3.0 | 1979 | $3,000 | $1.52 | 45d | 1 | 0.88mi |
| 9006 Meadow Bridge Dr Missouri City, TX | 4.0 | 3.5 | 3958 | $6,580 | $1.66 | 4d | 1 | 0.95mi |
| 2142 Ironwood Pass Dr Missouri City, TX | 4.0 | 3.0 | 2140 | $6,000 | $2.80 | 0d | 1 | 1.05mi |
| 8719 Fox Trail Dr Missouri City, TX | 4.0 | 3.5 | 2143 | $6,000 | $2.80 | 24d | 1 | 1.15mi |
| 2718 Van Gogh Ln Missouri City, TX | 4.0 | 2.5 | 3036 | $3,595 | $1.18 | 12d | 1 | 1.23mi |
HOA detail
- Monthly dues
- $121 · $1,452/yr
Listing history 2 events
-
2026-05-31days on market $449,900 Active 37 DOM
-
2026-04-23$449,900 Active 486-char remark
ⓘ Source: listings_history table (triggers on properties + properties_extension) + one-shot
backfill from property_details.listing_events for pre-trigger history.
Tax reassessment forecast TX · Resets to sale price
- Current annual tax
- $13,561 · $1,130/mo
- Projected year-2 tax
- $13,561 · $1,130/mo
- Expected delta
- $0/yr ($0/mo · 0.0%)
ⓘ Screening estimate from a state-policy table — verify with the county assessor before closing.
Climate risk First Street
- Flood 1/10 Low FEMA zone X · 0% chance over 30 yrs
- Wildfire 4/10 Moderate
- Heat 9/10 Extreme 7 d/yr ≥111°F today · 25 d/yr by 30 yrs out
- Wind 9/10 Extreme 99% chance of damaging wind over 30 yrs
- Air quality 2/10 Low 2 unhealthy d/yr today · 2 by 30 yrs out
Nearby sold comps map
Loading sold comps map…
Walkable amenities ~0.75 mi
Loading nearby amenities…
Taxation est. · year 1
- Rental income
- $53,029
- − Mortgage interest
- −$25,201
- − Property taxes
- −$13,561
- − Insurance
- −$2,250
- − Repairs & maintenance
- −$4,242
- − Management
- −$4,242
- − HOA
- −$1,452
- − Depreciation
- −$13,088
- Taxable loss
- −$11,007
- Est. tax savings @ 24.0%
- +$2,642
- After-tax cash flow
- $-1,040/yr
For passive investors: Depreciation is non-cash, so a rental often shows a tax loss while cash-flowing — sheltering income. Rental losses are passive: they offset passive income freely, and up to $25,000/yr can offset ordinary (W-2) income if you actively participate and your MAGI is under $100k (phasing out to $0 by $150k); unused losses carry forward. On sale, claimed depreciation is recaptured at up to 25%, and gains may owe capital-gains tax (a 1031 exchange can defer both). Figures are a year-1 estimate at your 24.0% rate — not tax advice; consult a CPA.
Schools (NCES district)
- District
- Fort Bend ISD
- NCES district ID
- 4819650
- Math proficiency
- 44% ▼ -15.00%
- Reading proficiency
- 53% ▼ -4.00%
- Median HH income
- $82,360
- Composite
- 44.61/100
- National rank
- #2779
- State rank
- #140 of 826 in TX
Livability — Sienna
No livability data for this city. (Only ~50 U.S. cities are tracked.)
Census & demographics
- Census place
- Sienna, TX
- County
- Fort Bend County · 836,777 people
- Metro
- Houston-The Woodlands-Sugar Land, TX
- Population (ZIP)
- 84,221
- Household income
- $129,151
- Rent vs Own
- Severe rent burden
- 1004.0
Population outlook (Fort Bend County) Hauer SSP2
- Today (2025)
- 1,004,526 people
- By 2030
- 1,153,104 · +14.8%
- By 2040
- 1,453,718 · +44.7%
- By 2050
- 1,753,781 · +74.6%
- By 2075
- 2,455,772 · +144.5%
- By 2100
- 2,930,528 · +191.7%
Race, ethnicity, and origin ACS 2023
- Neighborhood character
- Highly diverse neighborhood (Simpson 0.75)
- Race & ethnicity
- White 34% Black 26% Asian 22% Hispanic / Latino 13% Two or more races 10%
- Hispanic origin (detail)
- Mexican 7%
- Common ancestry
- Lithuanian 2% Slovak 1% Italian 1%
- Foreign-born
- 21% · Canada, China, Vietnam
- Languages at home
- 73% English-only · Other Asian/Pacific 8% Spanish 7% Other Indo-European 5%
Political lean MEDSL · Fort Bend
- 2024 margin
- Toss-up / Even · D 49.5% · R 47.9% · Other 2.6%
- 2008→2024 swing
- +4.0pp toward D · 2008: -2.4pp · 2024: 1.6pp
- All cycles
- 2024: D+1.6 2020: D+10.6 2016: D+6.6 2012: R+6.8 2008: R+2.4
Not yet ingested
- Civics
- —
Market trends
- HPI YoY
- ▼ -1.67%
- Current HPI
- 212.3573
- Rent YoY
- ▼ -0.15%
- Metro
- Houston-The Woodlands-Sugar Land, TX
- State GDP YoY
- ▲ 3.95%
- F500 in state
- 110
Industry mix (Fortune 500 HQ in TX)
| Industry | F500 HQs | Revenue |
|---|---|---|
| Energy | 16 | $1,198B |
|
||
| Technology | 5 | $198B |
|
||
| Engineering / Construction | 4 | $72B |
|
||
| Energy Services | 3 | $60B |
|
||
| Utilities | 3 | $41B |
|
||
| Healthcare | 2 | $330B |
|
||
Price history
2 events — show timeline
- 2026-05-31 Listing Removed — HARMLS
- 2026-04-23 Listed $449,900 HARMLS
Property tax history
+59.0%/yrLatest (2025): $13,561 · +111.2% YoY. Source: county tax records.
Cash-flow waterfall
monthlySold comps — $/sqft
last 12 mo · ≤1 miLoading sold comps…