2250 W Darby #1 · Muscoy, CA
Flood risk 1/10 · Minimal
- FEMA flood zone
- X (unshaded)
- Chance of flooding over 30 yrs
- 0.0%
- Est. flood insurance / yr
- $507 – $1,088
Fire risk 7/10 · Major
- Est. fire insurance / yr
- $659 – $1,223
Heat risk 8/10 · Major
- Hot days now (above 102°F)
- 6 days/yr
- Hot days in 30 yrs
- 19 days/yr
Wind risk 1/10 · Minimal
- Chance of severe wind over 30 yrs
- —
Air-quality risk 10/10 · Severe
- Unhealthy air days now
- 25 days/yr
- Unhealthy air days in 30 yrs
- 31 days/yr
Risk factors via First Street. Map © Google.
Why this score? — see what drove the B- grade
The composite is a weighted blend of 9 inputs, each scored 0–100. Each bar is that input's sub-score; the figure is the points it added to the 100-point composite (weight × sub-score).
- Cash flow +30.0/30.0
- 1% rule +10.0/10.0
- DSCR +10.0/10.0
- ARV discount +7.5/15.0
- Rent growth +3.4/5.0
- Schools +3.1/10.0
- Livability +2.6/5.0
- Condition / age +2.5/5.0
- Appreciation +0.0/10.0
$59,999
🖨 Deal sheet 📄 Offer letter ✓ Due diligence
Listing remarks MLS
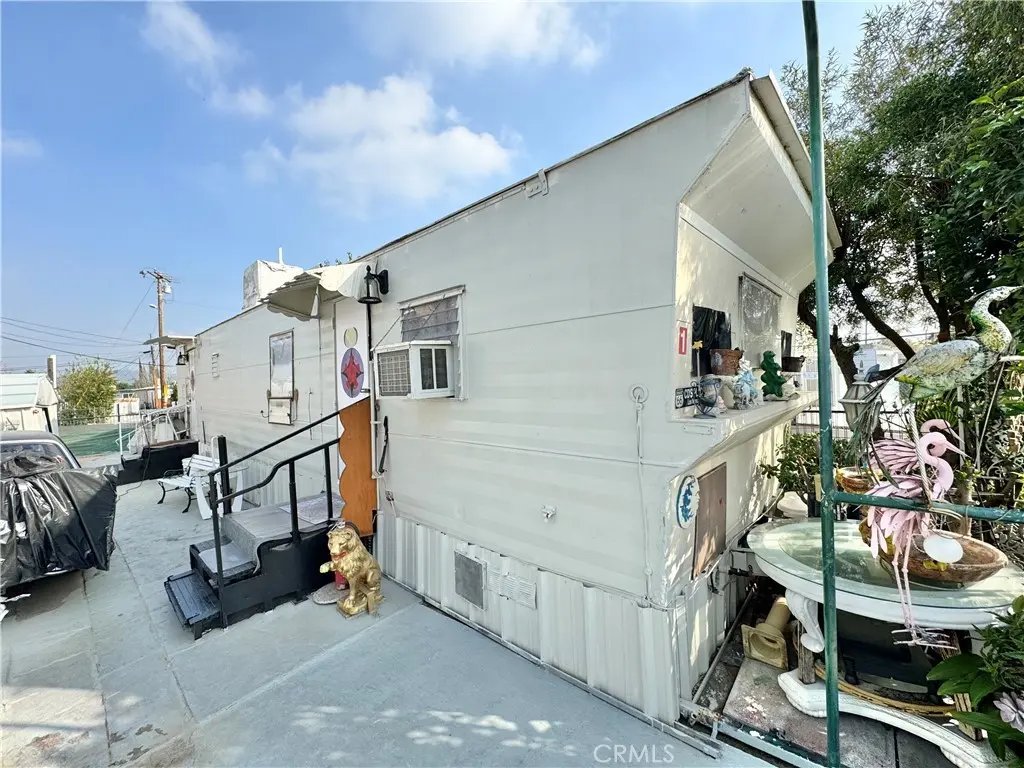
Opportunity of a Lifetime Family Park Priced at $59,999. This 1 bedroom, 1 bathroom single-wide mobile home offers approximately 500 sq. ft. of living space and is located in a family-friendly park with affordable space rent subject to rent control. $950 space rent includes permit parking fee, sewer, and trash. The value is in the homesite cost of living. The property features an extra-wide concrete driveway with ample parking, a large private patio area, storage shed, and a carport frame already in place for future covered parking. The home includes ramp and stair access, a window A/C unit, and is surrounded by mature landscaping that adds privacy and character. Situated in a prime location directly in front of the pool and next to the clubhouse, this is one of the most desirable spots in the community. The lot also offers the potential to remove and replace the existing mobile home with a newer mobile one, providing long-term upside and flexibility. Ideal for affordable living, downsizing, or a buyer looking for a rent-controlled park with future redevelopment potential. * * KEEP YOUR HOUSING COSTS LOW WITH THIS PROPERTY * *
Key facts
- Community pool
- Built 1965
- Listed 133 days
Neighborhood map
What this means for you Summary
Snapshot
- This is a 1-bed/1.0-bath manufactured listed at $60k.
Deal economics
- At list price, monthly cash flow is $931 ($11k/yr) — positive.
- The deal already cash-flows at list — no discount required.
- Meets the 1% rule at list price ($2k rent vs $60k).
- Recommended offer: $53k (12.0% below list) — sets the bar for market timing.
Location & tenants
- Location reads 52/100 on livability (#1,006 in CA) — a working-class tenant base; expect higher turnover. Strengths: commute A, housing A-; Watch: schools F, crime F, amenities F.
- San Bernardino City Unified (urban): math 27% / reading 40% proficiency, ranked #959 of 1,400 in CA (top 68%) — families likely to look elsewhere, expect single-tenant / working-renter base with shorter leases; 81% free/reduced lunch — lower-income household profile, screen leases tightly.
- Market conditions: Rents rising (+3.4%/yr); 125 active listings in the ZIP; 1 comparable units currently listed for rent nearby; solid renter incomes; 5,458 units permitted in San Bernardino County in 2024 (1,500 in 5+ unit buildings).
Forward outlook
- Local home prices are declining (-3.0%/yr); year-one equity from $415 of loan paydown is wiped out by about $2k of value loss. Plan a longer hold.
- San Bernardino County population projected at +15% by 2050 — modest demand growth; plan on rents tracking national, not racing it.
- At projected returns (-3.0% appreciation + 3.4% rent growth), your $17k cash investment doubles in ~2 years — after that, you're playing with house money.
Negotiation context
- It's been on market 133 days — a 12% lower offer ($53k) is reasonable based on typical stale-listing flexibility.
Risks & watch-outs
- Climate carrying-cost: major wildfire risk; extreme-heat days projected 6→19/yr by 2055 (HVAC capex compounding) — expect insurance premiums to compound above CPI over the hold.
Questions for the listing agent
- It's been on market 133 days. Have you received any prior offers? Is the seller open to a 12% concession, seller financing, or rate buy-down credit?
- Built in 1965 — when were the roof, HVAC, electrical panel, plumbing, and water heater last replaced?
- Why hasn't it sold? Are there any deal-killer items the seller is aware of (foundation, flood, title, zoning, code violations)?
- Is there a deadline driving the sale (1031 exchange, divorce, estate, relocation)? That informs how much negotiation room exists.
- Schools are F-rated, which usually means shorter tenancies and higher turnover. Who's the typical renter profile here, and what's been the actual vacancy rate?
- Crime grade is F in this area — have there been break-ins, vandalism, or insurance claims at this property in the last 3 years? What carrier currently insures it and at what premium?
- What's the average days-on-market for RENTAL listings here right now (not sales)? A rising rental-DOM trend means longer vacancies and softer asking-rent achievability than the comps imply.
- What's the recent tenant-quality profile in this submarket — average credit score on applications, eviction rate, late-payment / NSF rate, and stable-employment percentage? A property-management company in the area should have these aggregated.
- How much new for-sale + rental construction is in the pipeline within 1–3 miles? Heavy new supply typically softens prices + rents 12–24 months out; constrained supply supports both.
Investment metrics
- 1% rule
- 2.84% ✓
- Cap rate
- 24.92%
- Cash-on-cash
- 66.51%
- DSCR
- 3.96
- GRM
- 2.9
CMA / ARV
No comps found within radius.
Projected returns pro-forma
-3.0% appreciation · 3.41% rent growth · sell at horizon
- IRR
- 66.3%
- Equity multiple
- 3.99×
- Total profit
- $50,311
- Equity at exit
- $8,946
- IRR
- 70.6%
- Equity multiple
- 8.33×
- Total profit
- $123,194
- Equity at exit
- $5,188
Cash invested: $16,800 (down + closing). Projections, not guarantees.
Landlord ↔ Tenant lean methodology
- Overall (STATE)
- 18 Strongly Tenant-Friendly
- State California
- 18 Strongly Tenant-Friendly · D+13
- County
- — inherits STATE
- City
- — inherits STATE
ZIP-level market 92407
- Rents YoY
- 3.4%
- Active inventory
- 125
- Price-to-rent
- 2.9×
Monthly cashflow live
- Estimated rent
- $1,703 medium interval (Pro) →
- Mortgage (P&I)
- −$315
- Tax est. 1.5%
- −$75 /mo · $900/yr
- Insurance
- −$25
- HOA
- −$0
- Vacancy / Maint / Mgmt
- −$358
- Net cashflow
- $931
Break-even live
UW: 25.0% down · 7.5% · 30yr · 1.5% tax · 5.0% vac · 8.0% maint · 8.0% mgmt
Financing live
Cash to close
- Down payment
- $15,000
- Closing costs
- $1,800
- Reserves months
- —
- Total cash needed
- —
Loan-product check · same deal, 3 products live
Conventional
25% down · 7.5% · 30yr
- Down + closing
- —
- Monthly P&I
- —
- Monthly cashflow
- —
- DSCR
- —
- Eligible?
- —
Personal DTI + credit; lowest rate.
DSCR
20% down · 8.5% · 30yr
- Down + closing
- —
- Monthly P&I
- —
- Monthly cashflow
- —
- DSCR
- —
- Eligible?
- —
No personal income docs; deal must DSCR.
Hard money
10% down · 12.0% · 12mo
- Down + closing
- —
- Monthly P&I
- —
- Monthly cashflow
- —
- DSCR
- —
- Eligible?
- —
Short-term bridge; refi at stabilization.
Rent comps 1 comps
| Address | Beds | Baths | Sqft | Rent | $/sqft | DOM | Units | Dist |
|---|---|---|---|---|---|---|---|---|
| 2436 W 3rd Ave San Bernardino, CA | 2.0 | 1.0 | 642 | $2,100 | $3.27 | 43d | 1 | 1.37mi |
Listing history 15 events
-
2026-06-18days on market $59,999 Active 133 DOM
-
2026-06-17days on market $59,999 Active 132 DOM
-
2026-06-16days on market $59,999 Active 131 DOM
-
2026-06-15days on market $59,999 Active 130 DOM
-
2026-06-13days on market $59,999 Active 128 DOM
-
2026-06-09days on market $59,999 Active 124 DOM
-
2026-06-08days on market $59,999 Active 123 DOM
-
2026-06-07days on market $59,999 Active 122 DOM
-
2026-06-04days on market $59,999 Active 119 DOM
-
2026-06-03days on market $59,999 Active 118 DOM
-
2026-06-02days on market $59,999 Active 117 DOM
-
2026-06-01days on market $59,999 Active 116 DOM
-
2026-05-31days on market $59,999 Active 115 DOM
-
2026-02-05$59,999 Active 1147-char remark
Show marketing remark (1147 chars)
Opportunity of a Lifetime Family Park Priced at $59,999. This 1 bedroom, 1 bathroom single-wide mobile home offers approximately 500 sq. ft. of living space and is located in a family-friendly park with affordable space rent subject to rent control. $950 space rent includes permit parking fee, sewer, and trash. The value is in the homesite cost of living. The property features an extra-wide concrete driveway with ample parking, a large private patio area, storage shed, and a carport frame already in place for future covered parking. The home includes ramp and stair access, a window A/C unit, and is surrounded by mature landscaping that adds privacy and character. Situated in a prime location directly in front of the pool and next to the clubhouse, this is one of the most desirable spots in the community. The lot also offers the potential to remove and replace the existing mobile home with a newer mobile one, providing long-term upside and flexibility. Ideal for affordable living, downsizing, or a buyer looking for a rent-controlled park with future redevelopment potential. * * KEEP YOUR HOUSING COSTS LOW WITH THIS PROPERTY * *
-
2026-02-05historical $59,999 1147-char remark
Show marketing remark (1147 chars)
Opportunity of a Lifetime Family Park Priced at $59,999. This 1 bedroom, 1 bathroom single-wide mobile home offers approximately 500 sq. ft. of living space and is located in a family-friendly park with affordable space rent subject to rent control. $950 space rent includes permit parking fee, sewer, and trash. The value is in the homesite cost of living. The property features an extra-wide concrete driveway with ample parking, a large private patio area, storage shed, and a carport frame already in place for future covered parking. The home includes ramp and stair access, a window A/C unit, and is surrounded by mature landscaping that adds privacy and character. Situated in a prime location directly in front of the pool and next to the clubhouse, this is one of the most desirable spots in the community. The lot also offers the potential to remove and replace the existing mobile home with a newer mobile one, providing long-term upside and flexibility. Ideal for affordable living, downsizing, or a buyer looking for a rent-controlled park with future redevelopment potential. * * KEEP YOUR HOUSING COSTS LOW WITH THIS PROPERTY * *
ⓘ Source: listings_history table (triggers on properties + properties_extension) + one-shot
backfill from property_details.listing_events for pre-trigger history.
Climate risk First Street
- Flood 1/10 Low FEMA zone X (unshaded) · 0% chance over 30 yrs
- Wildfire 7/10 Severe
- Heat 8/10 Severe 6 d/yr ≥102°F today · 19 d/yr by 30 yrs out
- Wind 1/10 Low
- Air quality 10/10 Extreme 25 unhealthy d/yr today · 31 by 30 yrs out
Nearby sold comps map
Loading sold comps map…
Walkable amenities ~0.75 mi
Loading nearby amenities…
Taxation est. · year 1
- Rental income
- $20,442
- − Mortgage interest
- −$3,361
- − Property taxes
- −$900
- − Insurance
- −$300
- − Repairs & maintenance
- −$1,635
- − Management
- −$1,635
- − Depreciation
- −$1,745
- Taxable income
- $10,865
- Est. tax owed @ 24.0%
- −$2,608
- After-tax cash flow
- $8,566/yr
For passive investors: Depreciation is non-cash, so a rental often shows a tax loss while cash-flowing — sheltering income. Rental losses are passive: they offset passive income freely, and up to $25,000/yr can offset ordinary (W-2) income if you actively participate and your MAGI is under $100k (phasing out to $0 by $150k); unused losses carry forward. On sale, claimed depreciation is recaptured at up to 25%, and gains may owe capital-gains tax (a 1031 exchange can defer both). Figures are a year-1 estimate at your 24.0% rate — not tax advice; consult a CPA.
Schools (NCES district)
- District
- San Bernardino City Unified
- NCES district ID
- 0634170
- Math proficiency
- 27% ▲ 1.00%
- Reading proficiency
- 40% ▬ 0.00%
- Median HH income
- $39,758
- Composite
- 30.8/100
- National rank
- #11385
- State rank
- #959 of 1400 in CA
Livability — Muscoy
- Score
- 52/100
- State rank
- #1006
- US rank
- #24870
Category grades
Schools grade is shown separately in the Schools card above.
Census & demographics
- Census place
- Muscoy, CA
- County
- San Bernardino County · 2,030,291 people
- Metro
- Riverside-San Bernardino-Ontario, CA
- Population (ZIP)
- 71,711
- Household income
- $94,032
- Rent vs Own
- Severe rent burden
- 2040.0
Population outlook (San Bernardino County) Hauer SSP2
- Today (2025)
- 2,300,329 people
- By 2030
- 2,378,907 · +3.4%
- By 2040
- 2,523,137 · +9.7%
- By 2050
- 2,642,388 · +14.9%
- By 2075
- 2,880,769 · +25.2%
- By 2100
- 2,909,436 · +26.5%
Race, ethnicity, and origin ACS 2023
- Neighborhood character
- Majority Hispanic (65%)
- Race & ethnicity
- Hispanic / Latino 65% Two or more races 17% White 17% Black 10% Asian 4%
- Hispanic origin (detail)
- Mexican 56%
- Common ancestry
- Lithuanian 1% Italian 1% Iranian 1%
- Foreign-born
- 21% · Canada
- Languages at home
- 51% English-only · Spanish 44% Other Asian/Pacific 1% Tagalog/Filipino 1%
Political lean MEDSL · San Bernardino
- 2024 margin
- Toss-up / Even · D 47.5% · R 49.7% · Other 2.8%
- 2008→2024 swing
- -8.5pp toward R · 2008: 6.3pp · 2024: -2.1pp
- All cycles
- 2024: R+2.1 2020: D+10.7 2016: D+9.8 2012: D+5.4 2008: D+6.3
Not yet ingested
- Civics
- —
Market trends
- HPI YoY
- ▼ -254.51%
- Current HPI
- 449.2624
- Rent YoY
- ▲ 3.41%
- Metro
- Riverside-San Bernardino-Ontario, CA
- State GDP YoY
- ▲ 3.21%
- F500 in state
- 116
Industry mix (Fortune 500 HQ in CA)
| Industry | F500 HQs | Revenue |
|---|---|---|
| Technology | 27 | $1,492B |
|
||
| Financial Services | 3 | $174B |
|
||
| Retail | 3 | $44B |
|
||
| Insurance | 3 | $26B |
|
||
| Media / Entertainment | 2 | $115B |
|
||
| Pharmaceuticals / Biotech | 2 | $62B |
|
||
Price history
+0.0% since first listed2 events — show timeline
- 2026-02-05 Listed $59,999 CRMLS
- 2026-02-05 Coming Soon $59,999 CRMLS
Cash-flow waterfall
monthlySold comps — $/sqft
last 12 mo · ≤1 miLoading sold comps…