2205 E Linden St #73 · Caldwell, ID
Flood risk 1/10 · Minimal
- FEMA flood zone
- X (unshaded)
- Chance of flooding over 30 yrs
- 0.0%
- Est. flood insurance / yr
- $507 – $1,088
Fire risk 1/10 · Minimal
- Est. fire insurance / yr
- $584 – $1,086
Heat risk 5/10 · Moderate
- Hot days now (above 98°F)
- 7 days/yr
- Hot days in 30 yrs
- 18 days/yr
Wind risk 1/10 · Minimal
- Chance of severe wind over 30 yrs
- —
Air-quality risk 7/10 · Major
- Unhealthy air days now
- 9 days/yr
- Unhealthy air days in 30 yrs
- 16 days/yr
Risk factors via First Street. Map © Google.
Why this score? — see what drove the B- grade
The composite is a weighted blend of 9 inputs, each scored 0–100. Each bar is that input's sub-score; the figure is the points it added to the 100-point composite (weight × sub-score).
- Cash flow +30.0/30.0
- 1% rule +10.0/10.0
- DSCR +10.0/10.0
- ARV discount +6.3/15.0
- Livability +3.4/5.0
- Rent growth +3.2/5.0
- Condition / age +2.5/5.0
- Schools +2.0/10.0
- Appreciation +0.0/10.0
$76,900
🖨 Deal sheet 📄 Offer letter ✓ Due diligence
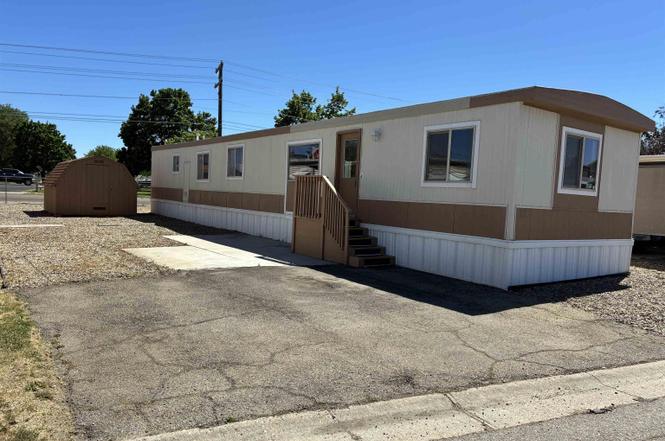
Listing remarks
Very nice 55 plus community surrounds this lovely home. Recently remodeled with textured walls, soft paint, vinyl flooring, this nice home looks brand new! The newer, modern floor plan provides light, airy and spacious rooms. The large storage shed is very usable. Indoor HVAC system new in the last couple of years. Concrete parking space. All data deemed reliable but not guaranteed, buyer to verify all information.
Key facts
- Remodeled
- Textured walls
- Vinyl flooring
Tags
Property features AI
Finance
- Other: Property classified as Mobile/Manu on a rented lot
- HOA & community: Situated in a mobile home park and over-55 community
Exterior
- Parking: Finished driveway
- Utilities: City water service; Sewer connected; Cable connected; Broadband internet
- Home design: Mobile/manufactured home in a rented-lot community; Located in an over-55 mobile home park
- Construction: Vinyl siding; Metal roof; Built in 1978
- Exterior features: Partial fencing; Garden; Storage shed
Interior
- Kitchen: Open kitchen with breakfast bar; Oven/Range (gas); Gas range; Gas oven; Microwave; Dishwasher; Refrigerator
- Bedrooms: 3 bedrooms on the main level (Master: ~10 x 10; Bedroom 2: ~9 x 11; Bedroom 3: ~8 x 8)
- Flooring: Laminate flooring
- Bathrooms: 2 bathrooms
- Heating & cooling: Electric forced-air heating; Central air conditioning
- Interior features: Main-level master bedroom; Split bedroom floorplan; Great room; Breakfast bar
- Laundry & utility: Washer; Dryer; Gas water heater; Heat pump water heater
Neighborhood map
What this means for you Summary
Snapshot
- This is a 2-bed/2.0-bath manufactured listed at $77k.
Deal economics
- At list price, monthly cash flow is $595 ($7k/yr) — positive.
- The deal already cash-flows at list — no discount required.
- Meets the 1% rule at list price ($1k rent vs $77k).
- Cap rate 15.6% vs local median 3.1% in Caldwell — top-decile yield for the area; either an underpriced asset or a hidden risk that comps aren't pricing in. Stress-test before assuming the spread holds.
Location & tenants
- Location reads 67/100 on livability (#88 in ID) — a middle-class / working-renter tenant base. Strengths: cost of living A+, housing A+; Watch: crime C-, employment D+, amenities F.
- Caldwell District (suburban): math 17% / reading 31% proficiency, ranked #90 of 92 in ID (top 98%) — low school quality limits family demand, transient renter base, plan for 1-2y turnover; 72% free/reduced lunch — lower-income household profile, screen leases tightly.
- Zoned schools: Lincoln Elementary School (math 17% / reading 17%, grade F, #349 of 357 statewide, top 98%, 322 students, 88% FRL); Caldwell Senior High School (math 16% / reading 38%, grade F, #131 of 169 statewide, top 77%, 1,474 students, 76% FRL).
- Market conditions: Rents rising (+2.7%/yr); 341 active listings in the ZIP; 27 comparable units currently listed for rent nearby; rentals leasing fast (median 12d on market — plan ~1-2 weeks tenant-placement turnaround); 3,620 units permitted in Canyon County in 2024 (196 in 5+ unit buildings).
Forward outlook
- Local home prices are declining (-3.0%/yr); year-one equity from $532 of loan paydown is wiped out by about $2k of value loss. Plan a longer hold.
- Canyon County population projected at +41% by 2050 — long-run rental-demand tailwind backs the buy-and-hold thesis.
- At projected returns (-3.0% appreciation + 2.7% rent growth), your $22k cash investment doubles in ~4 years — after that, you're playing with house money.
Negotiation context
- Only 1 days on market — expect competitive offers; lowballing is unlikely to land.
- 2 sale attempts since 11y ago with the ask held roughly flat each time — persistent listings suggest the price (not the market) is what's stuck; bring a comps-based counter.
Risks & watch-outs
- Climate carrying-cost: extreme-heat days projected 7→18/yr by 2055 (HVAC capex compounding) — expect insurance premiums to compound above CPI over the hold.
Questions for the listing agent
- Built in 1978 — when were the roof, HVAC, electrical panel, plumbing, and water heater last replaced?
- Is there a deadline driving the sale (1031 exchange, divorce, estate, relocation)? That informs how much negotiation room exists.
- Schools are D-rated, which usually means shorter tenancies and higher turnover. Who's the typical renter profile here, and what's been the actual vacancy rate?
- What's the average days-on-market for RENTAL listings here right now (not sales)? A rising rental-DOM trend means longer vacancies and softer asking-rent achievability than the comps imply.
- What's the recent tenant-quality profile in this submarket — average credit score on applications, eviction rate, late-payment / NSF rate, and stable-employment percentage? A property-management company in the area should have these aggregated.
- How much new for-sale + rental construction is in the pipeline within 1–3 miles? Heavy new supply typically softens prices + rents 12–24 months out; constrained supply supports both.
Investment metrics
- 1% rule
- 1.74% ✓
- Cap rate
- 15.58%
- Cash-on-cash
- 33.16%
- DSCR
- 2.48
- GRM
- 4.8
CMA / ARV
- ARV (on-the-fly)
- $74,844
- Comps found
- 9
Show comp detail 9 sales within ~0.75 mi
| Address | Dist | Beds/Ba | Sqft | Sold | Price | $/sf | Match |
|---|---|---|---|---|---|---|---|
| 2205 E Linden #4 | 0.00mi | 2/2.0 | 924 (0%) | 5mo | $74,900 | $81 | 96 |
| 2205 E Linden St #83 | 0.00mi | 2/1.0 | 924 (0%) | 3mo | $79,900 | $86 | 94 |
| 2205 E Linden St Trlr 91 Trlr 91 | 0.00mi | 2/1.0 | 938 (+2%) | 1mo | $79,900 | $85 | 92 |
| 2205 E Linden St Trlr 15 | 0.00mi | 2/2.0 | 924 (0%) | 12mo | $45,000 | $49 | 90 |
| 2205 E Linden St #70 | 0.00mi | 2/2.0 | 924 (0%) | 22mo | $79,900 | $86 | 81 |
| 2205 E Linden St Trlr 3 | 0.00mi | 2/1.0 | 930 (+1%) | 16mo | $84,900 | $91 | 81 |
| 2205 E Linden St #19 | 0.00mi | 3/2.0 (+1) | 924 (0%) | 17mo | $74,900 | $81 | 81 |
| 2819 S Georgia Ave #64 | 0.25mi | 2/2.0 | 924 (0%) | 13mo | $75,000 | $81 | 78 |
| 2205 E Linden St # 2 #2 | 0.00mi | 3/1.5 (+1) | 924 (0%) | 19mo | $50,000 | $54 | 77 |
Match score weights: distance 35% · size 25% · config 20% · recency 20%. Top-matched comps best support the ARV.
Projected returns pro-forma
-3.0% appreciation · 2.69% rent growth · sell at horizon
- IRR
- 28.0%
- Equity multiple
- 2.16×
- Total profit
- $25,001
- Equity at exit
- $11,466
- IRR
- 35.3%
- Equity multiple
- 4.19×
- Total profit
- $68,787
- Equity at exit
- $6,649
Cash invested: $21,532 (down + closing). Projections, not guarantees.
Landlord ↔ Tenant lean methodology
- Overall (STATE)
- 91 Strongly Landlord-Friendly
- State Idaho
- 91 Strongly Landlord-Friendly · R+18
- County
- — inherits STATE
- City
- — inherits STATE
ZIP-level market 83605
- Home prices YoY
- -27.0%
- Rents YoY
- 2.7%
- Active inventory
- 341
- Price-to-rent
- 4.8×
Monthly cashflow live
- Estimated rent
- $1,340 high interval (Pro) →
- Mortgage (P&I)
- −$403
- Tax from tax record
- −$28 /mo · $334/yr
- Insurance
- −$32
- HOA
- −$0
- Vacancy / Maint / Mgmt
- −$281
- Net cashflow
- $595
Break-even live
UW: 25.0% down · 7.5% · 30yr · 1.5% tax · 5.0% vac · 8.0% maint · 8.0% mgmt
Financing live
Cash to close
- Down payment
- $19,225
- Closing costs
- $2,307
- Reserves months
- —
- Total cash needed
- —
Loan-product check · same deal, 3 products live
Conventional
25% down · 7.5% · 30yr
- Down + closing
- —
- Monthly P&I
- —
- Monthly cashflow
- —
- DSCR
- —
- Eligible?
- —
Personal DTI + credit; lowest rate.
DSCR
20% down · 8.5% · 30yr
- Down + closing
- —
- Monthly P&I
- —
- Monthly cashflow
- —
- DSCR
- —
- Eligible?
- —
No personal income docs; deal must DSCR.
Hard money
10% down · 12.0% · 12mo
- Down + closing
- —
- Monthly P&I
- —
- Monthly cashflow
- —
- DSCR
- —
- Eligible?
- —
Short-term bridge; refi at stabilization.
Rent comps 27 comps
| Address | Beds | Baths | Sqft | Rent | $/sqft | DOM | Units | Dist |
|---|---|---|---|---|---|---|---|---|
| 2100 E Maple St Caldwell, ID | 1.0–3.0 | 1.0–1.5 | 930 | $1,150 | $1.24 | 3d | 1 | 0.15mi |
| 2003 E Linden St Unit 2 Caldwell, ID | 2.0 | 1.0 | 930 | $1,250 | $1.34 | 14d | 1 | 0.21mi |
| 2509 S Ohio Ave Caldwell, ID | 1.0 | 1.0 | 550 | $850 | $1.55 | 14d | 1 | 0.28mi |
| 2609 Red Robin Way Caldwell, ID | 3.0 | 2.0 | 936 | $1,650 | $1.76 | 12d | 1 | 0.38mi |
| 2106 Ison Ct Unit 1460907P Caldwell, ID | 2.0 | 2.0 | 957 | $3,066 | $3.20 | 12d | 1 | 0.51mi |
| 2000 College Ave Caldwell, ID | 2.0 | 1.0 | 675 | $1,168 | $1.73 | 3d | 1 | 0.60mi |
| 3304 S Florida Ave Caldwell, ID | 3.0 | 1.0 | 1000 | $1,395 | $1.40 | 23d | 1 | 0.65mi |
| 2121 S Montana Ave Unit C Caldwell, ID | 2.0 | 2.0 | 1000 | $1,595 | $1.59 | 10d | 1 | 0.66mi |
| 3114 Iowa Ave Unit 1 Caldwell, ID | 3.0 | 1.0 | 1020 | $1,500 | $1.47 | 14d | 1 | 0.68mi |
| 2420 Robert Ave Caldwell, ID | 3.0 | 1.0 | 1100 | $1,545 | $1.40 | 23d | 1 | 0.95mi |
| 2422 Robert Ave Caldwell, ID | 2.0 | 1.0 | 796 | $1,250 | $1.57 | 23d | 1 | 0.95mi |
| 3919 Thatcher Ln Caldwell, ID | 1.0–3.0 | 1.0–2.0 | 1074 | $1,645 | $1.53 | 3d | 41 | 1.02mi |
| 1305 E Belmont St Unit B Caldwell, ID | 2.0 | 1.0 | 712 | $1,100 | $1.54 | 23d | 1 | 1.17mi |
| 516 Rooster Ln Caldwell, ID | 2.0 | 2.0 | 940 | $1,450 | $1.54 | 3d | 1 | 1.19mi |
| 1513 Indian Springs St Unit N302 Caldwell, ID | 2.0 | 2.0 | 1023 | $1,550 | $1.52 | 3d | 1 | 1.19mi |
| 511 Rooster Ln Caldwell, ID | 2.0 | 2.0 | 940 | $1,450 | $1.54 | 3d | 1 | 1.21mi |
| 2720 Blackfoot Ln Caldwell, ID | 2.0 | 2.0 | 940 | $1,425 | $1.52 | 19d | 1 | 1.24mi |
| 3905 Idaho Ave Caldwell, ID | 2.0 | 1.5 | 650 | $1,350 | $2.08 | 3d | 1 | 1.24mi |
| 4005 Washington Ave Caldwell, ID | 2.0 | 1.5 | 900 | $1,535 | $1.71 | 21d | 1 | 1.26mi |
| 2809 Blackfoot Ln Caldwell, ID | 2.0 | 2.0 | 966 | $1,450 | $1.50 | 3d | 1 | 1.27mi |
| 1002 Everett St Caldwell, ID | 2.0 | 1.0 | 962 | $1,125 | $1.17 | 10d | 1 | 1.29mi |
| 2716 Syringa Ln Caldwell, ID | 1.0 | 1.0 | 672 | $1,295 | $1.93 | 23d | 1 | 1.32mi |
| 1503 Fairview Ave Unit 1460937P Caldwell, ID | 1.0 | 1.0 | 592 | $2,438 | $4.12 | 12d | 1 | 1.33mi |
| 4612 Lexington Sky Ln Caldwell, ID | 2.0 | 2.0 | 985 | $1,445 | $1.47 | 3d | 1 | 1.40mi |
| 808 Cleveland Blvd Caldwell, ID | 1.0 | 1.0 | 600 | $879 | $1.47 | 23d | 1 | 1.43mi |
| 3906 Brian Ave Unit 206 Caldwell, ID | 2.0 | 2.0 | 990 | $1,500 | $1.52 | 3d | 1 | 1.48mi |
| 1110 S Kimball Ave Caldwell, ID | 2.0 | 1.0 | 1066 | $1,350 | $1.27 | 3d | 5 | 1.49mi |
Listing history 2 events
-
2026-06-18remarks 418-char remark
-
2026-06-18$76,900 Active 1 DOM
ⓘ Source: listings_history table (triggers on properties + properties_extension) + one-shot
backfill from property_details.listing_events for pre-trigger history.
Tax reassessment forecast ID · Resets to sale price
- Current annual tax
- $334 · $28/mo
- Projected year-2 tax
- $531 · $44/mo
- Expected delta
- +$197/yr (+$16/mo · 58.9%)
ⓘ Screening estimate from a state-policy table — verify with the county assessor before closing.
Climate risk First Street
- Flood 1/10 Low FEMA zone X (unshaded) · 0% chance over 30 yrs
- Wildfire 1/10 Low
- Heat 5/10 Major 7 d/yr ≥98°F today · 18 d/yr by 30 yrs out
- Wind 1/10 Low
- Air quality 7/10 Severe 9 unhealthy d/yr today · 16 by 30 yrs out
Nearby sold comps map
Loading sold comps map…
Walkable amenities ~0.75 mi
Loading nearby amenities…
Taxation est. · year 1
- Rental income
- $16,074
- − Mortgage interest
- −$4,308
- − Property taxes
- −$334
- − Insurance
- −$384
- − Repairs & maintenance
- −$1,286
- − Management
- −$1,286
- − Depreciation
- −$2,237
- Taxable income
- $6,239
- Est. tax owed @ 24.0%
- −$1,497
- After-tax cash flow
- $5,644/yr
For passive investors: Depreciation is non-cash, so a rental often shows a tax loss while cash-flowing — sheltering income. Rental losses are passive: they offset passive income freely, and up to $25,000/yr can offset ordinary (W-2) income if you actively participate and your MAGI is under $100k (phasing out to $0 by $150k); unused losses carry forward. On sale, claimed depreciation is recaptured at up to 25%, and gains may owe capital-gains tax (a 1031 exchange can defer both). Figures are a year-1 estimate at your 24.0% rate — not tax advice; consult a CPA.
Schools (NCES district)
- District
- Caldwell District
- NCES district ID
- 1600510
- Math proficiency
- 17% ▼ -11.00%
- Reading proficiency
- 31% ▼ -4.00%
- Median HH income
- $36,116
- Composite
- 19.85/100
- National rank
- #8694
- State rank
- #90 of 92 in ID
Livability — Caldwell
- Score
- 67/100
- State rank
- #88
- US rank
- #10145
Category grades
Schools grade is shown separately in the Schools card above.
Census & demographics
- Census place
- Caldwell, ID
- County
- Canyon County · 235,358 people
- City population
- 76,816
- Metro
- Boise City, ID
- Population (ZIP)
- 41,325
- Household income
- $68,427
- Rent vs Own
- Severe rent burden
- 719.0
Population outlook (Canyon County) Hauer SSP2
- Today (2025)
- 248,853 people
- By 2030
- 269,596 · +8.3%
- By 2040
- 311,081 · +25.0%
- By 2050
- 350,809 · +41.0%
- By 2075
- 441,884 · +77.6%
- By 2100
- 505,641 · +103.2%
Race, ethnicity, and origin ACS 2023
- Neighborhood character
- Diverse neighborhood (Simpson 0.56)
- Race & ethnicity
- White 51% Hispanic / Latino 42% Two or more races 15% Native American 1%
- Hispanic origin (detail)
- Mexican 36%
- Common ancestry
- Lithuanian 3% Slovak 2% Italian 2%
- Foreign-born
- 13% · Canada
- Languages at home
- 71% English-only · Spanish 27% Russian/Polish/Slavic 1%
Political lean MEDSL · Canyon
- 2024 margin
- Solid R (+46.6) · D 25.4% · R 72.0% · Other 2.5%
- 2008→2024 swing
- -11.4pp toward R · 2008: -35.2pp · 2024: -46.6pp
- All cycles
- 2024: R+46.6 2020: R+39.7 2016: R+41.8 2012: R+37.1 2008: R+35.2
Not yet ingested
- Civics
- —
Market trends
- HPI YoY
- ▼ -135.47%
- Current HPI
- 366.7896
- Rent YoY
- ▲ 2.69%
- Metro
- Boise City, ID
- State GDP YoY
- ▲ 4.51%
- F500 in state
- 6
Industry mix (Fortune 500 HQ in ID)
| Industry | F500 HQs | Revenue |
|---|---|---|
| Retail | 1 | $79B |
|
||
| Technology | 1 | $25B |
|
||
| Food / Agriculture | 1 | $6B |
|
||
Price history
+157.2% since first listed2 events — show timeline
- 2026-06-17 Listed $76,900 IMLS
- 2015-08-03 Listed $29,900 IMLS
Property tax history
+9.6%/yrLatest (2025): $334 · +63.1% YoY. Source: county tax records.
Cash-flow waterfall
monthlySold comps — $/sqft
last 12 mo · ≤1 miLoading sold comps…