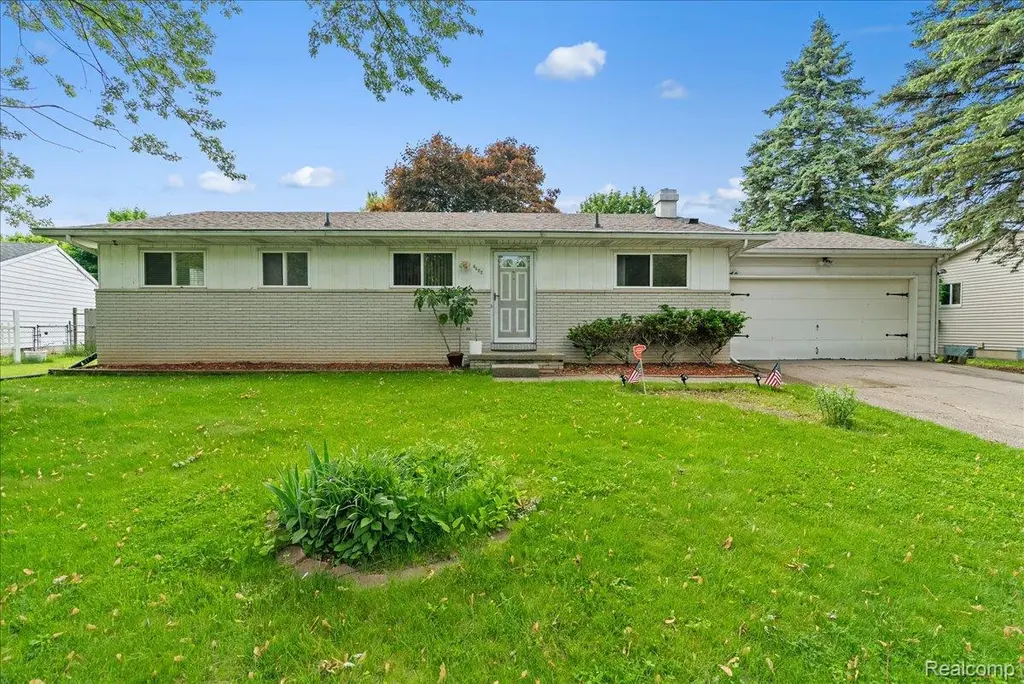
6422 Lerner Way · Lansing, MI
Flood risk 1/10 · Minimal
- FEMA flood zone
- X (unshaded)
- Chance of flooding over 30 yrs
- 0.0%
- Est. flood insurance / yr
- $473 – $860
Fire risk 1/10 · Minimal
- Est. fire insurance / yr
- $784 – $1,456
Heat risk 2/10 · Minimal
- Hot days now (above 97°F)
- 7 days/yr
- Hot days in 30 yrs
- 16 days/yr
Wind risk 2/10 · Minimal
- Chance of severe wind over 30 yrs
- —
Air-quality risk 2/10 · Minimal
- Unhealthy air days now
- 1 days/yr
- Unhealthy air days in 30 yrs
- 2 days/yr
Risk factors via First Street. Map © Google.
Why this score? — see what drove the F grade
The composite is a weighted blend of 9 inputs, each scored 0–100. Each bar is that input's sub-score; the figure is the points it added to the 100-point composite (weight × sub-score).
- ARV discount +13.3/15.0
- Cash flow +6.1/30.0
- Rent growth +5.0/5.0
- Livability +4.0/5.0
- Condition / age +2.5/5.0
- Schools +1.9/10.0
- 1% rule +1.5/10.0
- DSCR +0.4/10.0
- Appreciation +0.0/10.0
$237,900
🖨 Deal sheet 📄 Offer letter ✓ Due diligence
Listing remarks MLS
Welcome to 6422 Lerner Way in Lansing! This 4-bedroom, 1.5-bath home offers over 1,200 sq ft of comfortable living space with plenty of room to grow. The partially finished full basement provides additional space to entertain, host gatherings, or create the perfect rec room, home office, or workout area. Step outside to a beautiful backyard -- ideal for summer barbecues, relaxing evenings, and entertaining guests. This home has so much potential and is ready for its next owner to make it their own. Home is being sold as-is.
Key facts
- 8,712 sq ft lot
- 2 garage spots
- Built 1970
Neighborhood map
What this means for you Summary
Snapshot
- This is a 4-bed/1.5-bath single-family listed at $238k.
Deal economics
- At list price, monthly cash flow is $-448 ($-5k/yr) — negative.
- To cash-flow at today's rent, offer at most $159k (33.3% below list).
- To meet the 1% rule (rent ≥ 1% of price), the offer needs to be $154k (35.4% below list).
- Recommended offer: $154k (35.4% below list) — sets the bar for 1% rule.
- Cap rate 4.0% vs local median 6.0% in Lansing — below-typical yield; the buyer is paying a premium for something (appreciation thesis, condition, location) that the cap rate doesn't capture.
Location & tenants
- Location reads 79/100 on livability (#94 in MI, #2,182 nationally) — a middle-class / working-renter tenant base. Strengths: amenities A+, commute A+, cost of living A+; Watch: employment D, schools F, crime F.
- Lansing Public School District (urban): math 14% / reading 23% proficiency, ranked #650 of 760 in MI (top 86%) — low school quality limits family demand, transient renter base, plan for 1-2y turnover; 68% free/reduced lunch — lower-income household profile, screen leases tightly.
- Market conditions: Rents rising fast (+9.9%/yr); 143 active listings in the ZIP; 1 comparable units currently listed for rent nearby; 350 units permitted in Ingham County in 2024 (186 in 5+ unit buildings).
- This rent runs 33% of the median local income ($57k/yr) — at the standard rent-burdened threshold; future hikes will face affordability resistance.
Forward outlook
- Local home prices are declining (-3.0%/yr); year-one equity from $2k of loan paydown is wiped out by about $7k of value loss. Plan a longer hold.
- Ingham County population projected at +11% by 2050 — modest demand growth; plan on rents tracking national, not racing it.
Negotiation context
- It's been on market 79 days — a 6% lower offer ($224k) is reasonable based on typical stale-listing flexibility.
- 4 sale attempts with the ask held roughly flat each time — persistent listings suggest the price (not the market) is what's stuck; bring a comps-based counter.
- Current owner paid $123k; list at $238k implies a 94% gain — meaningful room to come down on a strong offer.
Questions for the listing agent
- What do current leases actually rent for vs. the listed asking? Can we see a recent rent roll and the last 12 months of T-12 income?
- It's been on market 79 days. Have you received any prior offers? Is the seller open to a 35% concession, seller financing, or rate buy-down credit?
- Built in 1970 — when were the roof, HVAC, electrical panel, plumbing, and water heater last replaced?
- Why hasn't it sold? Are there any deal-killer items the seller is aware of (foundation, flood, title, zoning, code violations)?
- Is there a deadline driving the sale (1031 exchange, divorce, estate, relocation)? That informs how much negotiation room exists.
- Schools are F-rated, which usually means shorter tenancies and higher turnover. Who's the typical renter profile here, and what's been the actual vacancy rate?
- Crime grade is F in this area — have there been break-ins, vandalism, or insurance claims at this property in the last 3 years? What carrier currently insures it and at what premium?
- The area grade is low — what's the realistic commute time and amenity access for the typical tenant pool here? Any planned neighborhood developments (good or bad) we should know about?
- What's the average days-on-market for RENTAL listings here right now (not sales)? A rising rental-DOM trend means longer vacancies and softer asking-rent achievability than the comps imply.
- What's the recent tenant-quality profile in this submarket — average credit score on applications, eviction rate, late-payment / NSF rate, and stable-employment percentage? A property-management company in the area should have these aggregated.
- How much new for-sale + rental construction is in the pipeline within 1–3 miles? Heavy new supply typically softens prices + rents 12–24 months out; constrained supply supports both.
Investment metrics
- 1% rule
- 0.65% ✗
- Cap rate
- 4.03%
- Cash-on-cash
- -8.08%
- DSCR
- 0.64
- GRM
- 12.9
CMA / ARV
- ARV (median comp)
- $273,370
- List price
- $237,900
- Delta
- -12.98%
- Verdict
- UNDERPRICED
- Comps
- 20 within 1.0 mi
Show comp detail 7 sales within ~0.75 mi
| Address | Dist | Beds/Ba | Sqft | Sold | Price | $/sf | Match |
|---|---|---|---|---|---|---|---|
| 6815 Aurelius Rd | 0.49mi | 3/2.0 (-1) | 1,127 (-8%) | 1mo | $200,000 | $177 | 56 |
| 2541 Selma St | 0.71mi | 3/2.0 (-1) | 1,248 (+2%) | 3mo | $156,900 | $126 | 54 |
| 6860 N Aurelius Rd | 0.53mi | 3/1.0 (-1) | 1,232 (+1%) | 22mo | $209,000 | $170 | 48 |
| 2537 Selma St | 0.72mi | 3/2.5 (-1) | 1,200 (-2%) | 16mo | $244,500 | $204 | 41 |
| 7011 Aurelius Rd | 0.63mi | 3/1.0 (-1) | 1,384 (+14%) | 4mo | $165,000 | $119 | 38 |
| 2606 Kate St | 0.60mi | 5/1.0 (+1) | 1,056 (-13%) | 9mo | $181,000 | $171 | 35 |
| 1737 E Willoughby Rd | 0.62mi | 3/1.0 (-1) | 1,040 (-15%) | 19mo | $140,000 | $135 | 24 |
Match score weights: distance 35% · size 25% · config 20% · recency 20%. Top-matched comps best support the ARV.
Projected returns pro-forma
-3.0% appreciation · 8.0% rent growth · sell at horizon
- IRR
- -25.1%
- Equity multiple
- 0.11×
- Total profit
- $-58,958
- Equity at exit
- $35,472
- IRR
- -10.4%
- Equity multiple
- 0.23×
- Total profit
- $-51,023
- Equity at exit
- $20,569
Cash invested: $66,612 (down + closing). Projections, not guarantees.
Landlord ↔ Tenant lean methodology
- Overall (STATE)
- 62 Landlord-Friendly
- State Michigan
- 62 Landlord-Friendly · EVEN
- County
- — inherits STATE
- City
- — inherits STATE
ZIP-level market 48911
- Rents YoY
- 9.9%
- Active inventory
- 143
- Price-to-rent
- 12.9×
Monthly cashflow live
- Estimated rent
- $1,536 medium interval (Pro) →
- Mortgage (P&I)
- −$1,248
- Tax from tax record
- −$315 /mo · $3,785/yr
- Insurance
- −$99
- HOA
- −$0
- Vacancy / Maint / Mgmt
- −$323
- Net cashflow
- $-448
Break-even live
UW: 25.0% down · 7.5% · 30yr · 1.5% tax · 5.0% vac · 8.0% maint · 8.0% mgmt
Financing live
Cash to close
- Down payment
- $59,475
- Closing costs
- $7,137
- Reserves months
- —
- Total cash needed
- —
Loan-product check · same deal, 3 products live
Conventional
25% down · 7.5% · 30yr
- Down + closing
- —
- Monthly P&I
- —
- Monthly cashflow
- —
- DSCR
- —
- Eligible?
- —
Personal DTI + credit; lowest rate.
DSCR
20% down · 8.5% · 30yr
- Down + closing
- —
- Monthly P&I
- —
- Monthly cashflow
- —
- DSCR
- —
- Eligible?
- —
No personal income docs; deal must DSCR.
Hard money
10% down · 12.0% · 12mo
- Down + closing
- —
- Monthly P&I
- —
- Monthly cashflow
- —
- DSCR
- —
- Eligible?
- —
Short-term bridge; refi at stabilization.
Rent comps 1 comps
| Address | Beds | Baths | Sqft | Rent | $/sqft | DOM | Units | Dist |
|---|---|---|---|---|---|---|---|---|
| 900 Long Blvd Lansing, MI | 1.0–3.0 | 1.0–1.5 | 1013 | $1,495 | $1.48 | 13d | 21 | 0.75mi |
Listing history 10 events
-
2026-04-23price $237,900 529-char remark
Show marketing remark (536 chars)
Welcome to 6422 Lerner Way in Lansing! This 4-bedroom, 1.5-bath home offers over 1,200 sq ft of comfortable living space with plenty of room to grow. The partially finished full basement provides additional space to entertain, host gatherings, or create the perfect rec room, home office, or workout area. Step outside to a beautiful backyard — ideal for summer barbecues, relaxing evenings, and entertaining guests. This home has so much potential and is ready for its next owner to make it their own. Home is being sold as-is.
-
2026-04-23price $237,900 536-char remark
Show marketing remark (536 chars)
Welcome to 6422 Lerner Way in Lansing! This 4-bedroom, 1.5-bath home offers over 1,200 sq ft of comfortable living space with plenty of room to grow. The partially finished full basement provides additional space to entertain, host gatherings, or create the perfect rec room, home office, or workout area. Step outside to a beautiful backyard — ideal for summer barbecues, relaxing evenings, and entertaining guests. This home has so much potential and is ready for its next owner to make it their own. Home is being sold as-is.
-
2026-04-18price $237,900
-
2026-04-18price $237,900
-
2026-03-06$244,500 Active
-
2026-03-06$244,500 Active
-
2026-03-05$244,500 Active 529-char remark
Show marketing remark (536 chars)
Welcome to 6422 Lerner Way in Lansing! This 4-bedroom, 1.5-bath home offers over 1,200 sq ft of comfortable living space with plenty of room to grow. The partially finished full basement provides additional space to entertain, host gatherings, or create the perfect rec room, home office, or workout area. Step outside to a beautiful backyard — ideal for summer barbecues, relaxing evenings, and entertaining guests. This home has so much potential and is ready for its next owner to make it their own. Home is being sold as-is.
-
2026-03-05$244,500 Active 536-char remark
Show marketing remark (536 chars)
Welcome to 6422 Lerner Way in Lansing! This 4-bedroom, 1.5-bath home offers over 1,200 sq ft of comfortable living space with plenty of room to grow. The partially finished full basement provides additional space to entertain, host gatherings, or create the perfect rec room, home office, or workout area. Step outside to a beautiful backyard — ideal for summer barbecues, relaxing evenings, and entertaining guests. This home has so much potential and is ready for its next owner to make it their own. Home is being sold as-is.
-
2026-03-04historical $244,500
-
2002-08-12soldstatus $122,900
ⓘ Source: listings_history table (triggers on properties + properties_extension) + one-shot
backfill from property_details.listing_events for pre-trigger history.
Tax reassessment forecast MI · Partial reset (capped growth)
- Current annual tax
- $3,785 · $315/mo
- Projected year-2 tax
- $3,785 · $315/mo
- Expected delta
- $0/yr ($0/mo · 0.0%)
ⓘ Screening estimate from a state-policy table — verify with the county assessor before closing.
Climate risk First Street
- Flood 1/10 Low FEMA zone X (unshaded) · 0% chance over 30 yrs
- Wildfire 1/10 Low
- Heat 2/10 Low 7 d/yr ≥97°F today · 16 d/yr by 30 yrs out
- Wind 2/10 Low
- Air quality 2/10 Low 1 unhealthy d/yr today · 2 by 30 yrs out
Nearby sold comps map
Loading sold comps map…
Walkable amenities ~0.75 mi
Loading nearby amenities…
Taxation est. · year 1
- Rental income
- $18,436
- − Mortgage interest
- −$13,326
- − Property taxes
- −$3,785
- − Insurance
- −$1,190
- − Repairs & maintenance
- −$1,475
- − Management
- −$1,475
- − Depreciation
- −$6,921
- Taxable loss
- −$9,735
- Est. tax savings @ 24.0%
- +$2,336
- After-tax cash flow
- $-3,045/yr
For passive investors: Depreciation is non-cash, so a rental often shows a tax loss while cash-flowing — sheltering income. Rental losses are passive: they offset passive income freely, and up to $25,000/yr can offset ordinary (W-2) income if you actively participate and your MAGI is under $100k (phasing out to $0 by $150k); unused losses carry forward. On sale, claimed depreciation is recaptured at up to 25%, and gains may owe capital-gains tax (a 1031 exchange can defer both). Figures are a year-1 estimate at your 24.0% rate — not tax advice; consult a CPA.
Schools (NCES district)
- District
- Lansing Public School District
- NCES district ID
- 2621150
- Math proficiency
- 14% ▲ 1.00%
- Reading proficiency
- 23% ▲ 3.00%
- Median HH income
- $37,453
- Composite
- 18.76/100
- National rank
- #14002
- State rank
- #650 of 760 in MI
Livability — Lansing
- Score
- 79/100
- State rank
- #94
- US rank
- #2182
Category grades
Schools grade is shown separately in the Schools card above.
Census & demographics
- Census place
- Lansing, MI
- County
- Ingham County · 237,052 people
- City population
- 161,269
- Metro
- Lansing-East Lansing, MI
- Population (ZIP)
- 39,876
- Household income
- $56,631
- Rent vs Own
- Severe rent burden
- 2255.0
Population outlook (Ingham County) Hauer SSP2
- Today (2025)
- 300,362 people
- By 2030
- 307,808 · +2.5%
- By 2040
- 320,492 · +6.7%
- By 2050
- 333,223 · +10.9%
- By 2075
- 373,693 · +24.4%
- By 2100
- 392,021 · +30.5%
Race, ethnicity, and origin ACS 2023
- Neighborhood character
- Diverse neighborhood (Simpson 0.70)
- Race & ethnicity
- White 46% Black 26% Hispanic / Latino 14% Two or more races 10% Asian 8%
- Hispanic origin (detail)
- Mexican 10% Puerto Rican 1%
- Common ancestry
- Romanian 3% Slovak 2% Iranian 2%
- Foreign-born
- 12% · Canada, Vietnam, Philippines
- Languages at home
- 83% English-only · Spanish 5% Other Indo-European 3% Other Asian/Pacific 2%
Political lean MEDSL · Ingham
- 2024 margin
- Strong D (+29.7) · D 63.9% · R 34.2% · Other 2.0%
- 2008→2024 swing
- -3.6pp toward R · 2008: 33.3pp · 2024: 29.7pp
- All cycles
- 2024: D+29.7 2020: D+32.2 2016: D+27.6 2012: D+27.9 2008: D+33.3
Not yet ingested
- Civics
- —
Market trends
- HPI YoY
- ▼ -179.62%
- Current HPI
- 176.0632
- Rent YoY
- ▲ 9.90%
- Metro
- Lansing-East Lansing, MI
- State GDP YoY
- ▲ 1.37%
- F500 in state
- 28
Industry mix (Fortune 500 HQ in MI)
| Industry | F500 HQs | Revenue |
|---|---|---|
| Automotive Parts | 3 | $48B |
|
||
| Automotive | 2 | $372B |
|
||
| Chemicals | 1 | $45B |
|
||
| Automotive Retail | 1 | $29B |
|
||
| Healthcare / Medical Devices | 1 | $23B |
|
||
| Automotive Technology | 1 | $20B |
|
||
Price history
+93.6% since first listed10 events — show timeline
- 2026-04-23 Price Changed $237,900 REALCOMP
- 2026-04-23 Price Changed $237,900 Greater Lansing AoR
- 2026-04-18 Price Changed $237,900 MiRealSource-MiMLS
- 2026-04-18 Price Changed $237,900 REALCOMP
- 2026-03-06 Listed $244,500 MiRealSource-MiMLS
- 2026-03-06 Listed $244,500 REALCOMP
- 2026-03-05 Listed $244,500 Greater Lansing AoR
- 2026-03-05 Listed $244,500 REALCOMP
- 2026-03-04 Coming Soon $244,500 MiRealSource-MiMLS
- 2002-08-12 Sold (Public Records) $122,900 Public Records
Property tax history
+5.0%/yrLatest (2025): $3,785 · +3.1% YoY. Source: county tax records.
Cash-flow waterfall
monthlySold comps — $/sqft
last 12 mo · ≤1 miLoading sold comps…