 Duplex
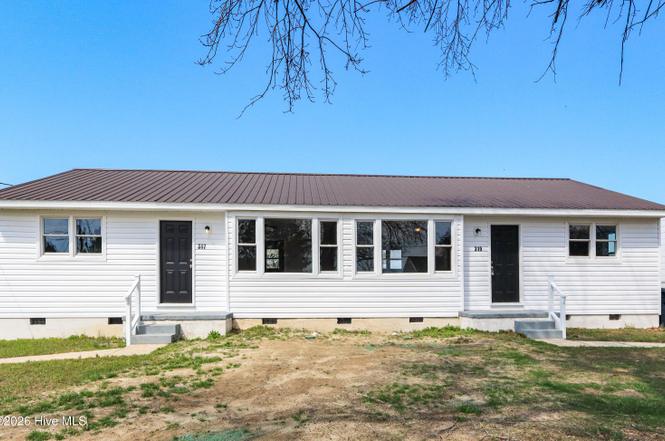
317-319 Starling St · Jacksonville, NC
Flood risk 1/10 · Minimal
- FEMA flood zone
- X (unshaded)
- Chance of flooding over 30 yrs
- 0.0%
- Est. flood insurance / yr
- $507 – $1,088
Fire risk 4/10 · Minor
- Est. fire insurance / yr
- $906 – $1,684
Heat risk 9/10 · Severe
- Hot days now (above 106°F)
- 7 days/yr
- Hot days in 30 yrs
- 19 days/yr
Wind risk 8/10 · Major
- Chance of severe wind over 30 yrs
- 99.0%
Air-quality risk 3/10 · Minor
- Unhealthy air days now
- 2 days/yr
- Unhealthy air days in 30 yrs
- 3 days/yr
Risk factors via First Street. Map © Google.
Why this score? — see what drove the D grade
The composite is a weighted blend of 9 inputs, each scored 0–100. Each bar is that input's sub-score; the figure is the points it added to the 100-point composite (weight × sub-score).
- Cash flow +13.8/30.0
- DSCR +4.2/10.0
- Condition / age +4.0/5.0
- 1% rule +3.9/10.0
- Schools +3.9/10.0
- Rent growth +3.6/5.0
- Livability +3.6/5.0
- ARV discount +3.4/15.0
- Appreciation +0.0/10.0
$275,000
🖨 Deal sheet (PDF) 📄 Offer letter ✓ Due diligence
Multi-family units
County records classify this as Multi-Family (2-4 Unit). Listing-text estimate: 2 units. confirmed
Listing remarks
Completely updated duplex offering incredible investment potential or the perfect opportunity to live in one side and rent the other! Each unit features 2 bedrooms and 1 bathroom with extensive renovations that make this property feel practically brand new. Recent updates include new kitchen cabinets and countertops, new appliances, all new doors, updated lighting throughout, fresh interior paint, and all new flooring. The improvements continue with new vinyl siding, updated electrical, all new plumbing, and new insulation in the crawlspace, providing peace of mind for years to come. Conveniently located close to Marine Corps Base Camp Lejeune, as well as shopping, dining, and everyday conv
Key facts
- Updated duplex
- New kitchen cabinets
- New appliances
Tags
Property features AI
Finance
- Other: Zoned RMF-HD
Exterior
- Parking: Off-street parking; On-site parking
- Utilities: Public utilities (standard municipal services)
- Home design: Duplex (residential income); One level
- Construction: Vinyl siding with frame construction
- Exterior features: Front porch; Chain link fencing (partial, includes back yard); Metal roof; Has view
Interior
- Kitchen: Refrigerator; Range; Dishwasher; Microwave
- Bedrooms: Multiple 2-bedroom units (unfurnished)
- Flooring: Laminate
- Heating & cooling: Electric heating; Heat pump; Central air conditioning
- Interior features: Ceiling fans
- Laundry & utility: Washer hookup; Laundry closet; Laundry located in kitchen
Neighborhood map
What this means for you Summary
Snapshot
- This is a 2 × 2-bed/1.0-bath units multifamily listed at $275k. Condition is rated good.
Deal economics
- At list price, monthly cash flow is $24 ($288/yr) — positive. Per door: $12/mo.
- The deal already cash-flows at list — no discount required.
- To meet the 1% rule (rent ≥ 1% of price), the offer needs to be $244k (11.4% below list).
- Recommended offer: $244k (11.4% below list) — sets the bar for 1% rule.
- Cap rate 6.4% vs local median 4.4% in Jacksonville — top-decile yield for the area; either an underpriced asset or a hidden risk that comps aren't pricing in. Stress-test before assuming the spread holds.
Location & tenants
- Location reads 71/100 on livability (#111 in NC) — a middle-class / working-renter tenant base. Strengths: cost of living A+, housing A+, health & safety A+; Watch: employment D, crime F, amenities F.
- Onslow County Schools (other): math 42% / reading 49% proficiency, ranked #84 of 178 in NC (top 47%) — families likely to look elsewhere, expect single-tenant / working-renter base with shorter leases.
- Zoned schools: Clyde Erwin Elementary (math 32% / reading 47%, grade F, #694 of 1,410 statewide, top 53%, 343 students, 67% FRL); New Bridge Middle (math 57% / reading 64%, grade B+, #43 of 475 statewide, top 9%, 490 students, 40% FRL); Jacksonville High (math 52% / reading 66%, grade C+, #233 of 535 statewide, top 44%, 1,423 students, 44% FRL).
- Market conditions: Rents rising fast (+4.5%/yr); 386 active listings in the ZIP; 4 comparable units currently listed for rent nearby; rentals at typical pace (median 23d on market — plan ~3-4 weeks tenant-placement turnaround); 1,246 units permitted in Onslow County in 2024 (0 in 5+ unit buildings).
- This rent runs 45% of the median local income ($66k/yr) — at the standard rent-burdened threshold; future hikes will face affordability resistance.
Forward outlook
- Local home prices are declining (-3.0%/yr); year-one equity from $2k of loan paydown is wiped out by about $8k of value loss. Plan a longer hold.
Negotiation context
- It's been on market 18 days — a 2% lower offer ($271k) is reasonable based on typical stale-listing flexibility.
- 2 sale attempts with the ask held roughly flat each time — persistent listings suggest the price (not the market) is what's stuck; bring a comps-based counter.
Risks & watch-outs
- Watch-outs: built in 1953 — expect roof / HVAC / electrical / plumbing capex.
- Climate carrying-cost: severe wind risk, 99% chance of damaging wind over 30y; extreme-heat days projected 7→19/yr by 2055 (HVAC capex compounding) — expect insurance premiums to compound above CPI over the hold.
Questions for the listing agent
- Can we see the unit-by-unit rent roll, current vacancy, and any below-market leases? What's the average tenancy length?
- What capital expenditures (roof, boiler, parking lot, exteriors) have been made in the last 5 years, and what's planned in the next 2?
- Built in 1953 — when were the roof, HVAC, electrical panel, plumbing, and water heater last replaced?
- Is there a deadline driving the sale (1031 exchange, divorce, estate, relocation)? That informs how much negotiation room exists.
- Crime grade is F in this area — have there been break-ins, vandalism, or insurance claims at this property in the last 3 years? What carrier currently insures it and at what premium?
- The area grade is low — what's the realistic commute time and amenity access for the typical tenant pool here? Any planned neighborhood developments (good or bad) we should know about?
- What's the average days-on-market for RENTAL listings here right now (not sales)? A rising rental-DOM trend means longer vacancies and softer asking-rent achievability than the comps imply.
- What's the recent tenant-quality profile in this submarket — average credit score on applications, eviction rate, late-payment / NSF rate, and stable-employment percentage? A property-management company in the area should have these aggregated.
- How much new apartment / multifamily construction is in the pipeline within 1–3 miles? Heavy new supply (>2% of stock underway) typically softens rents 12–24 months out; light construction supports rent growth.
Investment metrics
- 1% rule
- 0.89% ✗
- Cap rate
- 6.40%
- Cash-on-cash
- 0.37%
- DSCR
- 1.02
- GRM
- 9.4
CMA / ARV
- ARV (on-the-fly)
- $252,098
- Comps found
- 9
Show comp detail 9 sales within ~0.75 mi
| Address | Dist | Beds/Ba | Sqft | Sold | Price | $/sf | Match |
|---|---|---|---|---|---|---|---|
| 317-319 Starling St | 0.00mi | 4/2.0 | 1,637 (0%) | 1mo | $275,000 | $168 | 99 |
| 325-327 Starling St | 0.01mi | 4/2.0 | 1,653 (+1%) | 2mo | $254,000 | $154 | 97 |
| 328-330 Starling St | 0.03mi | 4/2.0 | 1,611 (-2%) | 3mo | $250,000 | $155 | 94 |
| 332-334 Starling St | 0.04mi | 4/2.0 | 1,659 (+1%) | 11mo | $250,000 | $151 | 87 |
| 308-310 Starling St | 0.09mi | 4/2.0 | 1,667 (+2%) | 8mo | $250,000 | $150 | 86 |
| 2270-2272 Onslow Dr | 0.15mi | 4/2.0 | 1,640 (+0%) | 9mo | $232,000 | $141 | 85 |
| 300-302 Starling St | 0.12mi | 4/2.0 | 1,456 (-11%) | 3mo | $250,000 | $172 | 73 |
| 214 York St | 0.29mi | 4/2.0 | 1,578 (-4%) | 16mo | $260,000 | $165 | 67 |
| 301 & 303 Louise Ave | 0.49mi | 4/2.0 | 1,728 (+6%) | 2mo | $222,000 | $128 | 66 |
Match score weights: distance 35% · size 25% · config 20% · recency 20%. Top-matched comps best support the ARV.
Projected returns pro-forma
-3.0% appreciation · 4.47% rent growth · sell at horizon
- IRR
- -14.1%
- Equity multiple
- 0.49×
- Total profit
- $-39,342
- Equity at exit
- $41,003
- IRR
- -3.0%
- Equity multiple
- 0.78×
- Total profit
- $-16,685
- Equity at exit
- $23,777
Cash invested: $77,000 (down + closing). Projections, not guarantees.
Landlord ↔ Tenant lean methodology
- Overall (STATE)
- 85 Strongly Landlord-Friendly
- State North Carolina
- 85 Strongly Landlord-Friendly · R+3
- County
- — inherits STATE
- City
- — inherits STATE
ZIP-level market 28540
- Home prices YoY
- -21.5%
- Rents YoY
- 4.5%
- Active inventory
- 386
- Price-to-rent
- 18.8×
Monthly cashflow live
- Estimated rent
- $2,436 high interval (Pro) →
- Mortgage (P&I)
- −$1,442
- Tax est. 1.5%
- −$344 /mo · $4,125/yr
- Insurance
- −$115
- HOA
- −$0
- Vacancy / Maint / Mgmt
- −$512
- Net cashflow
- $24
Break-even live
Sensitivity live
| Price | -10% $214 | -5% $119 | +0% $24 | +5% $-71 | +10% $-166 |
|---|---|---|---|---|---|
| Rent | -10% $-168 | -5% $-72 | +0% $24 | +5% $120 | +10% $216 |
| Rate | -1.0pp $162 | -0.5pp $94 | base $24 | +0.5pp $-47 | +1.0pp $-120 |
2-unit breakdown (identical units grouped — click to expand)
| Units | Beds | Baths | Est. rent |
|---|---|---|---|
| 2× units | 2 | 1 | $2,436 |
| #1 | 2 | 1 | $1,218 |
| #2 | 2 | 1 | $1,218 |
| Total (2 units) | $2,436 | ||
UW: 25.0% down · 7.5% · 30yr · 1.5% tax · 5.0% vac · 8.0% maint · 8.0% mgmt
Financing live
Cash to close
- Down payment
- $68,750
- Closing costs
- $8,250
- Reserves months
- —
- Total cash needed
- —
Loan-product check · same deal, 3 products live
Conventional
25% down · 7.5% · 30yr
- Down + closing
- —
- Monthly P&I
- —
- Monthly cashflow
- —
- DSCR
- —
- Eligible?
- —
Personal DTI + credit; lowest rate.
DSCR
20% down · 8.5% · 30yr
- Down + closing
- —
- Monthly P&I
- —
- Monthly cashflow
- —
- DSCR
- —
- Eligible?
- —
No personal income docs; deal must DSCR.
Hard money
10% down · 12.0% · 12mo
- Down + closing
- —
- Monthly P&I
- —
- Monthly cashflow
- —
- DSCR
- —
- Eligible?
- —
Short-term bridge; refi at stabilization.
Rent comps 4 comps
| Address | Beds | Baths | Sqft | Rent | $/sqft | DOM | Units | Dist |
|---|---|---|---|---|---|---|---|---|
| 129 Sanders St Jacksonville, NC | 3.0 | 2.0 | 1198 | $1,450 | $1.21 | 23d | 1 | 0.72mi |
| 113 N Shore Dr Jacksonville, NC | 3.0 | 1.0 | 1126 | $1,395 | $1.24 | 23d | 1 | 0.72mi |
| 16 White Oak St Jacksonville, NC | 3.0 | 2.0 | 1150 | $1,650 | $1.43 | 23d | 1 | 0.75mi |
| 508 Henderson Dr Jacksonville, NC | 3.0 | 1.0 | 1050 | $1,400 | $1.33 | 23d | 1 | 0.98mi |
Listing history 4 events
-
2026-04-24status Pending
-
2026-04-09status Active
-
2026-03-16status Pending
-
2026-03-13$275,000 Active
ⓘ Source: listings_history table (triggers on properties + properties_extension) + one-shot
backfill from property_details.listing_events for pre-trigger history.
Climate risk First Street
- Flood 1/10 Low FEMA zone X (unshaded) · 0% chance over 30 yrs
- Wildfire 4/10 Moderate
- Heat 9/10 Extreme 7 d/yr ≥106°F today · 19 d/yr by 30 yrs out
- Wind 8/10 Severe 99% chance of damaging wind over 30 yrs
- Air quality 3/10 Moderate 2 unhealthy d/yr today · 3 by 30 yrs out
Nearby sold comps map
Loading sold comps map…
Walkable amenities ~0.75 mi
Loading nearby amenities…
Taxation est. · year 1
- Rental income
- $29,232
- − Mortgage interest
- −$15,404
- − Property taxes
- −$4,125
- − Insurance
- −$1,375
- − Repairs & maintenance
- −$2,339
- − Management
- −$2,339
- − Depreciation
- −$8,000
- Taxable loss
- −$4,349
- Est. tax savings @ 24.0%
- +$1,044
- After-tax cash flow
- $1,332/yr
For passive investors: Depreciation is non-cash, so a rental often shows a tax loss while cash-flowing — sheltering income. Rental losses are passive: they offset passive income freely, and up to $25,000/yr can offset ordinary (W-2) income if you actively participate and your MAGI is under $100k (phasing out to $0 by $150k); unused losses carry forward. On sale, claimed depreciation is recaptured at up to 25%, and gains may owe capital-gains tax (a 1031 exchange can defer both). Figures are a year-1 estimate at your 24.0% rate — not tax advice; consult a CPA.
Condition & rehab AI · 12 photos
This updated duplex is in excellent condition with recent renovations, making it a great investment opportunity.
Value-add opportunities
- Both Landscaping and curb appeal improvements — Enhances curb appeal and can attract more buyers or renters.
- Both Add a small front porch or planter boxes — Can increase the home's charm and functionality, making it more attractive to potential buyers or renters.
Renovation cost estimate screening
Value-add ROI direction
- Both Landscaping and curb appeal improvements — Enhances curb appeal and can attract more buyers or renters. ↑
- Both Add a small front porch or planter boxes — Can increase the home's charm and functionality, making it more attractive to potential buyers or renters. ↑
ⓘ Cost ranges are severity-bucket heuristics (US national rule-of-thumb). Get contractor quotes + a written scope before underwriting a rehab budget.
Schools (NCES district)
- District
- Onslow County Schools
- NCES district ID
- 3703450
- Math proficiency
- 42% ▲ 6.00%
- Reading proficiency
- 49% ▲ 5.00%
- Median HH income
- $46,076
- Composite
- 38.66/100
- National rank
- #4148
- State rank
- #84 of 178 in NC
Livability — Jacksonville
- Score
- 71/100
- State rank
- #111
- US rank
- #6991
Category grades
Schools grade is shown separately in the Schools card above.
Census & demographics
- Census place
- Jacksonville, NC
- County
- Onslow County · 164,453 people
- City population
- 96,397
- Metro
- Jacksonville, NC
- Population (ZIP)
- 49,141
- Household income
- $65,625
- Rent vs Own
- Severe rent burden
- 1304.0
Population outlook (Onslow County) Hauer SSP2
- Today (2025)
- 189,789 people
- By 2030
- 194,463 · +2.5%
- By 2040
- 193,629 · +2.0%
- By 2050
- 193,248 · +1.8%
- By 2075
- 196,995 · +3.8%
- By 2100
- 201,513 · +6.2%
Race, ethnicity, and origin ACS 2023
- Neighborhood character
- Diverse neighborhood (Simpson 0.58)
- Race & ethnicity
- White 62% Black 14% Hispanic / Latino 14% Two or more races 13% Asian 2%
- Hispanic origin (detail)
- Mexican 5% Puerto Rican 6%
- Common ancestry
- Italian 3% Serbian 2% Romanian 2%
- Foreign-born
- 4% · Canada, China
- Languages at home
- 90% English-only · Spanish 7% Chinese 1% Other Asian/Pacific 1%
Political lean MEDSL · Onslow
- 2024 margin
- Solid R (+35.9) · D 31.5% · R 67.5% · Other 1.0%
- 2008→2024 swing
- -14.5pp toward R · 2008: -21.5pp · 2024: -35.9pp
- All cycles
- 2024: R+35.9 2020: R+30.2 2016: R+34.6 2012: R+27.0 2008: R+21.5
Not yet ingested
- Civics
- —
Market trends
- HPI YoY
- ▼ -60.11%
- Current HPI
- 219.5571
- Rent YoY
- ▲ 4.47%
- Metro
- Jacksonville, NC
- State GDP YoY
- ▲ 3.28%
- F500 in state
- 26
Industry mix (Fortune 500 HQ in NC)
| Industry | F500 HQs | Revenue |
|---|---|---|
| Financial Services | 2 | $213B |
|
||
| Retail | 2 | $95B |
|
||
| Industrial Conglomerate | 1 | $38B |
|
||
| Metals / Steel | 1 | $35B |
|
||
| Utilities | 1 | $30B |
|
||
| Industrial Machinery | 1 | $19B |
|
||
Price history
4 events — show timeline
- 2026-04-24 Pending — Hive MLS
- 2026-04-09 Relisted — Hive MLS
- 2026-03-16 Pending — Hive MLS
- 2026-03-13 Listed $275,000 Hive MLS
Cash-flow waterfall
monthlySold comps — $/sqft
last 12 mo · ≤1 miLoading sold comps…