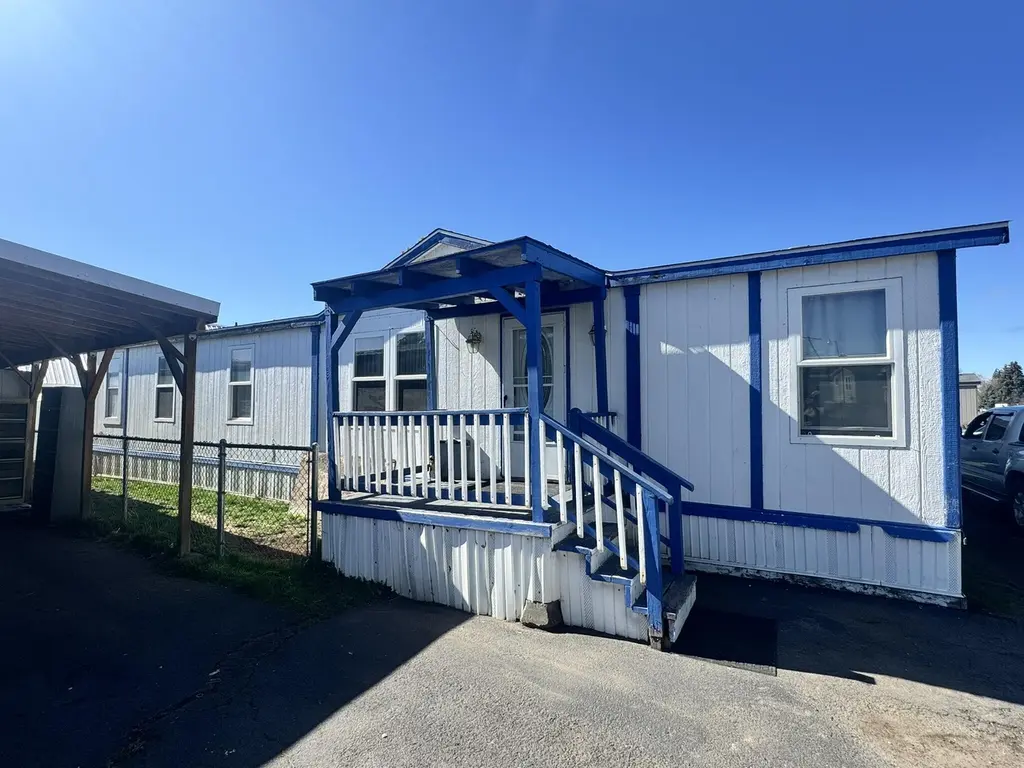
3950 Homedale Rd Unit 8 · Altamont, OR
Flood risk 1/10 · Minimal
- FEMA flood zone
- X
- Chance of flooding over 30 yrs
- 0.0%
- Est. flood insurance / yr
- $507 – $1,088
Fire risk 2/10 · Minimal
- Est. fire insurance / yr
- $498 – $926
Heat risk 3/10 · Minor
- Hot days now (above 90°F)
- 7 days/yr
- Hot days in 30 yrs
- 17 days/yr
Wind risk 1/10 · Minimal
- Chance of severe wind over 30 yrs
- —
Air-quality risk 10/10 · Severe
- Unhealthy air days now
- 38 days/yr
- Unhealthy air days in 30 yrs
- 39 days/yr
Risk factors via First Street. Map © Google.
Why this score? — see what drove the B+ grade
The composite is a weighted blend of 9 inputs, each scored 0–100. Each bar is that input's sub-score; the figure is the points it added to the 100-point composite (weight × sub-score).
- Cash flow +30.0/30.0
- ARV discount +15.0/15.0
- 1% rule +10.0/10.0
- DSCR +10.0/10.0
- Rent growth +3.5/5.0
- Livability +3.2/5.0
- Schools +2.5/10.0
- Condition / age +2.5/5.0
- Appreciation +0.0/10.0
$80,000
🖨 Deal sheet 📄 Offer letter ✓ Due diligence
Listing remarks MLS
Well maintained home in a clean park, easy maintenance, move in ready! Primary suite has large claw foot tub for soaking, bedrooms is large with room for an offer. Storage shed in covered parking and garden shed in back for lots of storage. Newer paver back patio great for entertaining and relaxing.
Key facts
- Storage shed
- Paver back patio
- Garden shed
Tags
Neighborhood map
What this means for you Summary
Snapshot
- This is a 3-bed/2.0-bath manufactured listed at $80k.
Deal economics
- At list price, monthly cash flow is $837 ($10k/yr) — positive.
- The deal already cash-flows at list — no discount required.
- Meets the 1% rule at list price ($2k rent vs $80k).
- Recommended offer: $75k (6.0% below list) — sets the bar for market timing.
- Cap rate 18.9% vs local median 3.7% in Altamont — top-decile yield for the area; either an underpriced asset or a hidden risk that comps aren't pricing in. Stress-test before assuming the spread holds.
Location & tenants
- Location reads 65/100 on livability (#195 in OR) — a middle-class / working-renter tenant base. Strengths: cost of living A+, housing A+; Watch: health & safety C-, employment D, crime F.
- Klamath County SD (rural): math 21% / reading 37% proficiency, ranked #46 of 58 in OR (top 79%) — low school quality limits family demand, transient renter base, plan for 1-2y turnover.
- Market conditions: Rents rising (+3.8%/yr); 263 active listings in the ZIP; 7 comparable units currently listed for rent nearby; rentals lingering (median 44d on market — plan ~5-8 weeks vacancy on turnover, expect pricing pressure); 100% of comp listings sitting > 30 days — soft ceiling on asking rent; 232 units permitted in Klamath County in 2024 (72 in 5+ unit buildings).
- This rent runs 30% of the median local income ($67k/yr) — at the standard rent-burdened threshold; future hikes will face affordability resistance.
Forward outlook
- Local home prices are declining (-3.0%/yr); year-one equity from $553 of loan paydown is wiped out by about $2k of value loss. Plan a longer hold.
- Klamath County population projected at -12% by 2050 — secular population decline; favor cash flow + early exit over multi-decade hold.
- At projected returns (-3.0% appreciation + 3.8% rent growth), your $22k cash investment doubles in ~3 years — after that, you're playing with house money.
Negotiation context
- It's been on market 73 days — a 6% lower offer ($75k) is reasonable based on typical stale-listing flexibility.
Questions for the listing agent
- It's been on market 73 days. Have you received any prior offers? Is the seller open to a 6% concession, seller financing, or rate buy-down credit?
- Why hasn't it sold? Are there any deal-killer items the seller is aware of (foundation, flood, title, zoning, code violations)?
- Is there a deadline driving the sale (1031 exchange, divorce, estate, relocation)? That informs how much negotiation room exists.
- Crime grade is F in this area — have there been break-ins, vandalism, or insurance claims at this property in the last 3 years? What carrier currently insures it and at what premium?
- What's the average days-on-market for RENTAL listings here right now (not sales)? A rising rental-DOM trend means longer vacancies and softer asking-rent achievability than the comps imply.
- What's the recent tenant-quality profile in this submarket — average credit score on applications, eviction rate, late-payment / NSF rate, and stable-employment percentage? A property-management company in the area should have these aggregated.
- How much new for-sale + rental construction is in the pipeline within 1–3 miles? Heavy new supply typically softens prices + rents 12–24 months out; constrained supply supports both.
Investment metrics
- 1% rule
- 2.11% ✓
- Cap rate
- 18.85%
- Cash-on-cash
- 44.86%
- DSCR
- 3.00
- GRM
- 3.9
CMA / ARV
- ARV (median comp)
- $108,741
- List price
- $80,000
- Delta
- -26.43%
- Verdict
- UNDERPRICED
- Comps
- 14 within 1.0 mi
Show comp detail 9 sales within ~0.75 mi
| Address | Dist | Beds/Ba | Sqft | Sold | Price | $/sf | Match |
|---|---|---|---|---|---|---|---|
| 5131 Bristol Ave | 0.08mi | 2/2.0 (-1) | 1,296 (-8%) | 2mo | $168,000 | $130 | 77 |
| 3950 Homedale Rd Unit 44 | 0.00mi | 3/2.0 | 1,248 (-11%) | 15mo | $90,000 | $72 | 69 |
| 5602 Denver Ave #1 | 0.31mi | 2/2.0 (-1) | 1,440 (+3%) | 18mo | $64,500 | $45 | 61 |
| 4647 Winter Ave Spc 55 | 0.32mi | 3/2.0 | 1,260 (-10%) | 9mo | $79,000 | $63 | 61 |
| 4647 Winter Ave #54 | 0.32mi | 3/2.0 | 1,296 (-8%) | 15mo | $82,500 | $64 | 60 |
| 5445 Winterfield Way | 0.66mi | 3/2.0 | 1,404 (0%) | 14mo | $263,000 | $187 | 57 |
| 5546 Winterfield Way | 0.72mi | 3/2.0 | 1,512 (+8%) | 11mo | $265,000 | $175 | 44 |
| 2839 Kane St | 0.68mi | 3/2.0 | 1,568 (+12%) | 9mo | $315,000 | $201 | 41 |
| 5461 Winterfield Way | 0.67mi | 3/2.0 | 1,296 (-8%) | 21mo | $250,000 | $193 | 38 |
Match score weights: distance 35% · size 25% · config 20% · recency 20%. Top-matched comps best support the ARV.
Projected returns pro-forma
-3.0% appreciation · 3.8% rent growth · sell at horizon
- IRR
- 42.8%
- Equity multiple
- 2.86×
- Total profit
- $41,736
- Equity at exit
- $11,928
- IRR
- 49.2%
- Equity multiple
- 5.94×
- Total profit
- $110,700
- Equity at exit
- $6,917
Cash invested: $22,400 (down + closing). Projections, not guarantees.
Landlord ↔ Tenant lean methodology
- Overall (STATE)
- 28 Tenant-Leaning
- State Oregon
- 28 Tenant-Leaning · D+6
- County
- — inherits STATE
- City
- — inherits STATE
ZIP-level market 97603
- Rents YoY
- 3.8%
- Active inventory
- 263
- Price-to-rent
- 3.9×
Monthly cashflow live
- Estimated rent
- $1,688 high interval (Pro) →
- Mortgage (P&I)
- −$420
- Tax from tax record
- −$43 /mo · $521/yr
- Insurance
- −$33
- HOA
- −$0
- Vacancy / Maint / Mgmt
- −$355
- Net cashflow
- $837
Break-even live
UW: 25.0% down · 7.5% · 30yr · 1.5% tax · 5.0% vac · 8.0% maint · 8.0% mgmt
Financing live
Cash to close
- Down payment
- $20,000
- Closing costs
- $2,400
- Reserves months
- —
- Total cash needed
- —
Loan-product check · same deal, 3 products live
Conventional
25% down · 7.5% · 30yr
- Down + closing
- —
- Monthly P&I
- —
- Monthly cashflow
- —
- DSCR
- —
- Eligible?
- —
Personal DTI + credit; lowest rate.
DSCR
20% down · 8.5% · 30yr
- Down + closing
- —
- Monthly P&I
- —
- Monthly cashflow
- —
- DSCR
- —
- Eligible?
- —
No personal income docs; deal must DSCR.
Hard money
10% down · 12.0% · 12mo
- Down + closing
- —
- Monthly P&I
- —
- Monthly cashflow
- —
- DSCR
- —
- Eligible?
- —
Short-term bridge; refi at stabilization.
Rent comps 7 comps
| Address | Beds | Baths | Sqft | Rent | $/sqft | DOM | Units | Dist |
|---|---|---|---|---|---|---|---|---|
| 4195 Bristol Ct Klamath Falls, OR | 2.0 | 1.0 | 1080 | $1,350 | $1.25 | 43d | 1 | 0.40mi |
| 3039 Kane St Klamath Falls, OR | 3.0 | 2.0 | 988 | $1,395 | $1.41 | 43d | 1 | 0.50mi |
| 4306 Fargo St Klamath Falls, OR | 3.0 | 2.0 | 1288 | $1,850 | $1.44 | 43d | 1 | 0.65mi |
| 4831 Darwin Pl Klamath Falls, OR | 3.0 | 1.0 | 1092 | $1,475 | $1.35 | 43d | 1 | 0.93mi |
| 3823 Kelley Dr Klamath Falls, OR | 3.0 | 3.0 | 1600 | $2,000 | $1.25 | 43d | 1 | 0.96mi |
| 2439 Homedale Rd Klamath Falls, OR | 3.0 | 1.0 | 1320 | $1,400 | $1.06 | 43d | 1 | 0.96mi |
| 4305 Altamont Dr Klamath Falls, OR | 4.0 | 2.0 | 1712 | $2,300 | $1.34 | 43d | 1 | 1.16mi |
Listing history 2 events
-
2026-04-30price $80,000 301-char remark
Show marketing remark (301 chars)
Well maintained home in a clean park, easy maintenance, move in ready! Primary suite has large claw foot tub for soaking, bedrooms is large with room for an offer. Storage shed in covered parking and garden shed in back for lots of storage. Newer paver back patio great for entertaining and relaxing.
-
2026-03-06$85,000 Active 301-char remark
Show marketing remark (301 chars)
Well maintained home in a clean park, easy maintenance, move in ready! Primary suite has large claw foot tub for soaking, bedrooms is large with room for an offer. Storage shed in covered parking and garden shed in back for lots of storage. Newer paver back patio great for entertaining and relaxing.
ⓘ Source: listings_history table (triggers on properties + properties_extension) + one-shot
backfill from property_details.listing_events for pre-trigger history.
Tax reassessment forecast OR · Resets to sale price
- Current annual tax
- $521 · $43/mo
- Projected year-2 tax
- $776 · $65/mo
- Expected delta
- +$255/yr (+$21/mo · 49.0%)
ⓘ Screening estimate from a state-policy table — verify with the county assessor before closing.
Climate risk First Street
- Flood 1/10 Low FEMA zone X · 0% chance over 30 yrs
- Wildfire 2/10 Low
- Heat 3/10 Moderate 7 d/yr ≥90°F today · 17 d/yr by 30 yrs out
- Wind 1/10 Low
- Air quality 10/10 Extreme 38 unhealthy d/yr today · 39 by 30 yrs out
Nearby sold comps map
Loading sold comps map…
Walkable amenities ~0.75 mi
Loading nearby amenities…
Taxation est. · year 1
- Rental income
- $20,259
- − Mortgage interest
- −$4,481
- − Property taxes
- −$521
- − Insurance
- −$400
- − Repairs & maintenance
- −$1,621
- − Management
- −$1,621
- − Depreciation
- −$2,327
- Taxable income
- $9,288
- Est. tax owed @ 24.0%
- −$2,229
- After-tax cash flow
- $7,820/yr
For passive investors: Depreciation is non-cash, so a rental often shows a tax loss while cash-flowing — sheltering income. Rental losses are passive: they offset passive income freely, and up to $25,000/yr can offset ordinary (W-2) income if you actively participate and your MAGI is under $100k (phasing out to $0 by $150k); unused losses carry forward. On sale, claimed depreciation is recaptured at up to 25%, and gains may owe capital-gains tax (a 1031 exchange can defer both). Figures are a year-1 estimate at your 24.0% rate — not tax advice; consult a CPA.
Schools (NCES district)
- District
- Klamath County SD
- NCES district ID
- 4107020
- Math proficiency
- 21% ▼ -17.00%
- Reading proficiency
- 37% ▼ -16.00%
- Median HH income
- $44,906
- Composite
- 24.83/100
- National rank
- #7593
- State rank
- #46 of 58 in OR
Livability — Altamont
- Score
- 65/100
- State rank
- #195
- US rank
- #12638
Category grades
Schools grade is shown separately in the Schools card above.
Census & demographics
- Census place
- Altamont, OR
- County
- Klamath County · 56,186 people
- Metro
- Klamath Falls, OR
- Population (ZIP)
- 33,222
- Household income
- $66,937
- Rent vs Own
- Severe rent burden
- 1147.0
Population outlook (Klamath County) Hauer SSP2
- Today (2025)
- 63,870 people
- By 2030
- 62,279 · -2.5%
- By 2040
- 58,891 · -7.8%
- By 2050
- 56,207 · -12.0%
- By 2075
- 51,239 · -19.8%
- By 2100
- 46,526 · -27.2%
Race, ethnicity, and origin ACS 2023
- Neighborhood character
- Predominantly White (73%)
- Race & ethnicity
- White 73% Hispanic / Latino 15% Two or more races 13% Native American 2%
- Hispanic origin (detail)
- Mexican 13%
- Common ancestry
- Portuguese 5% Italian 4% Lithuanian 3%
- Foreign-born
- 4% · Canada, China
- Languages at home
- 91% English-only · Spanish 7%
Political lean MEDSL · Klamath
- 2024 margin
- Solid R (+41.9) · D 27.9% · R 69.8% · Other 2.4%
- 2008→2024 swing
- -8.8pp toward R · 2008: -33.1pp · 2024: -41.9pp
- All cycles
- 2024: R+41.9 2020: R+40.6 2016: R+44.8 2012: R+38.2 2008: R+33.1
Not yet ingested
- Civics
- —
Market trends
- HPI YoY
- ▼ -122.75%
- Current HPI
- 198.1814
- Rent YoY
- ▲ 3.80%
- Metro
- Klamath Falls, OR
- State GDP YoY
- ▲ 2.05%
- F500 in state
- 2
Industry mix (Fortune 500 HQ in OR)
| Industry | F500 HQs | Revenue |
|---|---|---|
| Consumer Goods | 1 | $51B |
|
||
Price history
-5.9% since first listed2 events — show timeline
- 2026-04-30 Price Changed $80,000 MLSCO
- 2026-03-06 Listed $85,000 MLSCO
Property tax history
+5.0%/yrLatest (2025): $521 · +2.7% YoY. Source: county tax records.
Cash-flow waterfall
monthlySold comps — $/sqft
last 12 mo · ≤1 miLoading sold comps…