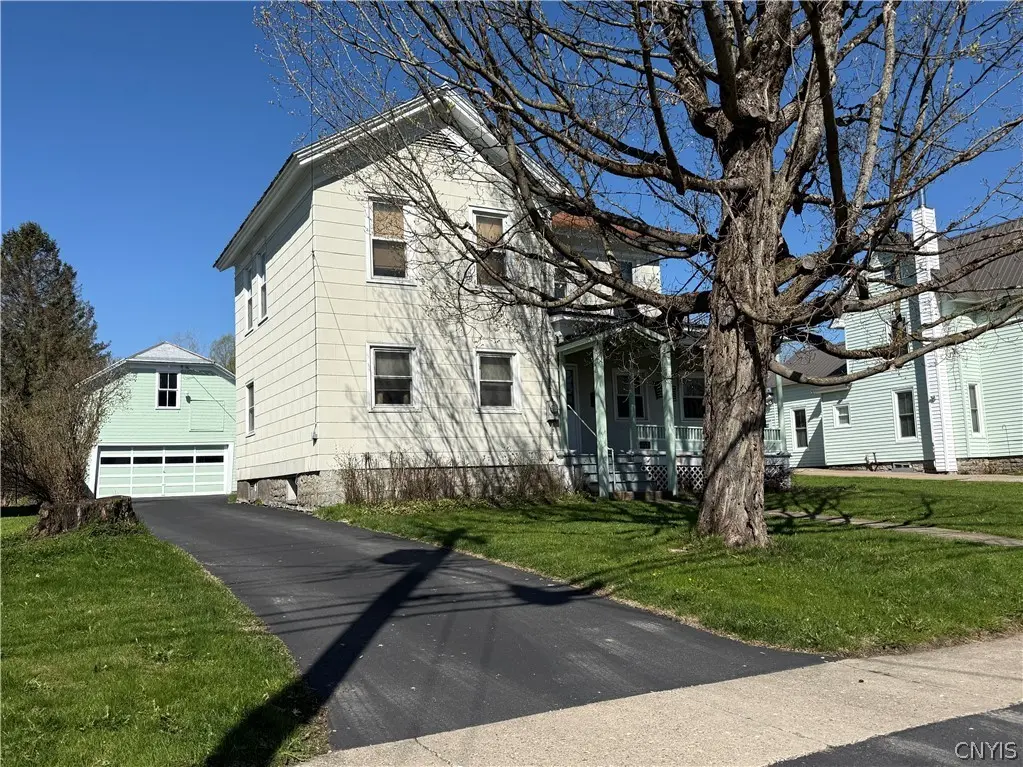
607 Post St · Boonville, NY
Flood risk 1/10 · Minimal
- FEMA flood zone
- X (unshaded)
- Chance of flooding over 30 yrs
- 0.0%
- Est. flood insurance / yr
- $473 – $860
Fire risk 3/10 · Minor
- Est. fire insurance / yr
- $691 – $1,283
Heat risk 1/10 · Minimal
- Hot days now (above 89°F)
- 7 days/yr
- Hot days in 30 yrs
- 16 days/yr
Wind risk 1/10 · Minimal
- Chance of severe wind over 30 yrs
- 0.0%
Air-quality risk 2/10 · Minimal
- Unhealthy air days now
- 0 days/yr
- Unhealthy air days in 30 yrs
- 1 days/yr
Risk factors via First Street. Map © Google.
Why this score? — see what drove the C- grade
The composite is a weighted blend of 9 inputs, each scored 0–100. Each bar is that input's sub-score; the figure is the points it added to the 100-point composite (weight × sub-score).
- Cash flow +12.6/30.0
- Appreciation +10.0/10.0
- ARV discount +9.8/15.0
- Schools +4.1/10.0
- Livability +4.0/5.0
- DSCR +3.8/10.0
- 1% rule +3.1/10.0
- Rent growth +2.5/5.0
- Condition / age +2.5/5.0
$169,900
🖨 Deal sheet 📄 Offer letter ✓ Due diligence
Listing remarks
Step back in time without sacrificing modern convenience in this expansive home, perfectly situated on a rare, oversized lot in the historic village of Boonville. This property blends character and functionality, beginning with a clean blacktop driveway that leads to a detached garage—originally a historic carriage house—offering incredible potential for a workshop, studio, or vehicle storage. Along side is a concrete patio with sunshade to enjoy the outdoor space, featuring a large village lot that includes an additional storage shed and a dedicated dog run, providing plenty of room for both pets and gardening enthusiasts. The interior first-floor layout includes a spacious e
Key facts
- Dedicated dog run
- Concrete patio
- Oversized lot
Tags
Property features AI
Exterior
- Parking: Detached garage; One garage space
- Utilities: Electricity connected; Public water connected; Sewer connected
- Home design: Two-story house; Existing (established) property
- Construction: Frame construction; Metal roof; Stone foundation; Partial basement
- Exterior features: Blacktop driveway; Rectangular residential lot; Road frontage on a city street and main thoroughfare
Interior
- Kitchen: Electric range; Electric oven; Dishwasher; Refrigerator; Walk-in pantry; Eat-in kitchen
- Bedrooms: One main-level bedroom
- Flooring: Hardwood; Carpet; Vinyl; Varied flooring
- Bathrooms: Two full bathrooms; One main-level bathroom
- Heating & cooling: Oil forced-air heating
- Interior features: Den; Eat-in kitchen; Walk-in pantry; Convertible bedroom
- Laundry & utility: Main-level laundry; Washer; Dryer; Electric water heater
Neighborhood map
What this means for you Summary
Snapshot
- This is a 4-bed/1.5-bath single-family listed at $170k.
Deal economics
- At list price, monthly cash flow is $-22 ($-261/yr) — negative.
- To cash-flow at today's rent, offer at most $166k (2.3% below list).
- To meet the 1% rule (rent ≥ 1% of price), the offer needs to be $138k (18.6% below list).
- Recommended offer: $138k (18.6% below list) — sets the bar for 1% rule.
- Cap rate 6.1% vs local median 3.6% in Boonville — top-decile yield for the area; either an underpriced asset or a hidden risk that comps aren't pricing in. Stress-test before assuming the spread holds.
Location & tenants
- Location reads 79/100 on livability (#146 in NY, #2,225 nationally) — a middle-class / working-renter tenant base. Strengths: cost of living A+, housing A+, health & safety A+; Watch: employment D, commute F.
- Adirondack Central School District (rural): math 41% / reading 54% proficiency, ranked #426 of 590 in NY (top 72%) — families likely to look elsewhere, expect single-tenant / working-renter base with shorter leases.
- Market conditions: 37 active listings in the ZIP; 204 units permitted in Oneida County in 2024 (68 in 5+ unit buildings).
Forward outlook
- In year one you build about $18k of equity ($1k loan paydown + $17k appreciation (10.0% local appreciation)).
- Oneida County population projected at -12% by 2050 — secular population decline; favor cash flow + early exit over multi-decade hold.
- At projected returns (10.0% appreciation + 3.0% rent growth), your $48k cash investment doubles in ~3 years — after that, you're playing with house money.
- By year 3, paydown + projected appreciation supports a ~$46k cash-out refi (75% LTV) — recoverable capital for the next deal without selling this one.
Negotiation context
- It's been on market 34 days — a 3% lower offer ($165k) is reasonable based on typical stale-listing flexibility.
- Current owner paid $56k; list at $170k implies a 204% gain — meaningful room to come down on a strong offer.
Risks & watch-outs
- Watch-outs: built in 1900 — expect roof / HVAC / electrical / plumbing capex.
Questions for the listing agent
- What do current leases actually rent for vs. the listed asking? Can we see a recent rent roll and the last 12 months of T-12 income?
- It's been on market 34 days. Have you received any prior offers? Is the seller open to a 19% concession, seller financing, or rate buy-down credit?
- Built in 1900 — when were the roof, HVAC, electrical panel, plumbing, and water heater last replaced?
- Is there a deadline driving the sale (1031 exchange, divorce, estate, relocation)? That informs how much negotiation room exists.
- What's the average days-on-market for RENTAL listings here right now (not sales)? A rising rental-DOM trend means longer vacancies and softer asking-rent achievability than the comps imply.
- What's the recent tenant-quality profile in this submarket — average credit score on applications, eviction rate, late-payment / NSF rate, and stable-employment percentage? A property-management company in the area should have these aggregated.
- How much new for-sale + rental construction is in the pipeline within 1–3 miles? Heavy new supply typically softens prices + rents 12–24 months out; constrained supply supports both.
Investment metrics
- 1% rule
- 0.81% ✗
- Cap rate
- 6.14%
- Cash-on-cash
- -0.55%
- DSCR
- 0.98
- GRM
- 10.2
CMA / ARV
- ARV (median comp)
- $178,960
- List price
- $169,900
- Delta
- -5.06%
- Verdict
- FAIR
- Comps
- 20 within 1.0 mi
Show comp detail 8 sales within ~0.75 mi
| Address | Dist | Beds/Ba | Sqft | Sold | Price | $/sf | Match |
|---|---|---|---|---|---|---|---|
| 130 Erwin St | 0.36mi | 4/2.0 | 2,126 (+2%) | 7mo | $45,000 | $21 | 72 |
| 501 Main St | 0.37mi | 5/1.5 (+1) | 2,152 (+3%) | 6mo | $65,000 | $30 | 67 |
| 8280 Ford St | 0.37mi | 4/2.0 | 2,300 (+10%) | 12mo | $245,000 | $107 | 54 |
| 133 Erwin St | 0.39mi | 4/1.5 | 1,902 (-9%) | 20mo | $155,000 | $81 | 50 |
| 123 Erwin St | 0.38mi | 3/2.5 (-1) | 2,004 (-4%) | 20mo | $159,650 | $80 | 50 |
| 105 Grove St | 0.34mi | 3/1.5 (-1) | 1,800 (-14%) | 9mo | $47,000 | $26 | 49 |
| 310 Main St | 0.32mi | 3/2.0 (-1) | 1,866 (-10%) | 23mo | $66,950 | $36 | 42 |
| 102 Harvey Pl | 0.57mi | 5/2.5 (+1) | 2,176 (+4%) | 22mo | $282,500 | $130 | 38 |
Match score weights: distance 35% · size 25% · config 20% · recency 20%. Top-matched comps best support the ARV.
Projected returns pro-forma
10.0% appreciation · 3.0% rent growth · sell at horizon
- IRR
- 23.9%
- Equity multiple
- 2.92×
- Total profit
- $91,133
- Equity at exit
- $153,059
- IRR
- 21.2%
- Equity multiple
- 6.66×
- Total profit
- $269,427
- Equity at exit
- $330,078
Cash invested: $47,572 (down + closing). Projections, not guarantees.
Landlord ↔ Tenant lean methodology
- Overall (STATE)
- 15 Strongly Tenant-Friendly
- State New York
- 15 Strongly Tenant-Friendly · D+10
- County
- — inherits STATE
- City
- — inherits STATE
ZIP-level market 13309
- Home prices YoY
- 24.5%
- Active inventory
- 37
- Price-to-rent
- 10.2×
Monthly cashflow live
- Estimated rent
- $1,382 medium interval (Pro) →
- Mortgage (P&I)
- −$891
- Tax from tax record
- −$152 /mo · $1,825/yr
- Insurance
- −$71
- HOA
- −$0
- Vacancy / Maint / Mgmt
- −$290
- Net cashflow
- $-22
Break-even live
UW: 25.0% down · 7.5% · 30yr · 1.5% tax · 5.0% vac · 8.0% maint · 8.0% mgmt
Financing live
Cash to close
- Down payment
- $42,475
- Closing costs
- $5,097
- Reserves months
- —
- Total cash needed
- —
Loan-product check · same deal, 3 products live
Conventional
25% down · 7.5% · 30yr
- Down + closing
- —
- Monthly P&I
- —
- Monthly cashflow
- —
- DSCR
- —
- Eligible?
- —
Personal DTI + credit; lowest rate.
DSCR
20% down · 8.5% · 30yr
- Down + closing
- —
- Monthly P&I
- —
- Monthly cashflow
- —
- DSCR
- —
- Eligible?
- —
No personal income docs; deal must DSCR.
Hard money
10% down · 12.0% · 12mo
- Down + closing
- —
- Monthly P&I
- —
- Monthly cashflow
- —
- DSCR
- —
- Eligible?
- —
Short-term bridge; refi at stabilization.
Listing history 16 events
-
2026-06-18days on market $169,900 Active 34 DOM
-
2026-06-17days on market $169,900 Active 33 DOM
-
2026-06-16days on market $169,900 Active 32 DOM
-
2026-06-15days on market $169,900 Active 31 DOM
-
2026-06-13days on market $169,900 Active 29 DOM
-
2026-06-12days on market $169,900 Active 28 DOM
-
2026-06-09days on market $169,900 Active 25 DOM
-
2026-06-08days on market $169,900 Active 24 DOM
-
2026-06-07days on market $169,900 Active 23 DOM
-
2026-06-07days on market $169,900 Active 22 DOM
-
2026-06-04days on market $169,900 Active 19 DOM
-
2026-06-02days on market $169,900 Active 18 DOM
-
2026-06-01days on market $169,900 Active 17 DOM
-
2026-05-31days on market $169,900 Active 16 DOM
-
2026-05-12$169,900 Active 1489-char remark
-
1997-07-01soldstatus $55,800
ⓘ Source: listings_history table (triggers on properties + properties_extension) + one-shot
backfill from property_details.listing_events for pre-trigger history.
Tax reassessment forecast NY · Partial reset (capped growth)
- Current annual tax
- $1,825 · $152/mo
- Projected year-2 tax
- $2,348 · $196/mo
- Expected delta
- +$523/yr (+$44/mo · 28.7%)
ⓘ Screening estimate from a state-policy table — verify with the county assessor before closing.
Climate risk First Street
- Flood 1/10 Low FEMA zone X (unshaded) · 0% chance over 30 yrs
- Wildfire 3/10 Moderate
- Heat 1/10 Low 7 d/yr ≥89°F today · 16 d/yr by 30 yrs out
- Wind 1/10 Low 0% chance of damaging wind over 30 yrs
- Air quality 2/10 Low 0 unhealthy d/yr today · 1 by 30 yrs out
Nearby sold comps map
Loading sold comps map…
Walkable amenities ~0.75 mi
Loading nearby amenities…
Taxation est. · year 1
- Rental income
- $16,589
- − Mortgage interest
- −$9,517
- − Property taxes
- −$1,825
- − Insurance
- −$850
- − Repairs & maintenance
- −$1,327
- − Management
- −$1,327
- − Depreciation
- −$4,943
- Taxable loss
- −$3,199
- Est. tax savings @ 24.0%
- +$768
- After-tax cash flow
- $507/yr
For passive investors: Depreciation is non-cash, so a rental often shows a tax loss while cash-flowing — sheltering income. Rental losses are passive: they offset passive income freely, and up to $25,000/yr can offset ordinary (W-2) income if you actively participate and your MAGI is under $100k (phasing out to $0 by $150k); unused losses carry forward. On sale, claimed depreciation is recaptured at up to 25%, and gains may owe capital-gains tax (a 1031 exchange can defer both). Figures are a year-1 estimate at your 24.0% rate — not tax advice; consult a CPA.
Schools (NCES district)
- District
- Adirondack Central School District
- NCES district ID
- 3605040
- Math proficiency
- 41% ▼ -5.00%
- Reading proficiency
- 54% ▲ 5.00%
- Median HH income
- $50,343
- Composite
- 40.7/100
- National rank
- #3669
- State rank
- #426 of 590 in NY
Livability — Boonville
- Score
- 79/100
- State rank
- #146
- US rank
- #2225
Category grades
Schools grade is shown separately in the Schools card above.
Census & demographics
- Census place
- Boonville, NY
- City population
- 5,828
- Population (ZIP)
- 5,828
Population outlook (Oneida County) Hauer SSP2
- Today (2025)
- 225,223 people
- By 2030
- 220,384 · -2.1%
- By 2040
- 209,071 · -7.2%
- By 2050
- 197,920 · -12.1%
- By 2075
- 175,541 · -22.1%
- By 2100
- 148,491 · -34.1%
Race, ethnicity, and origin ACS 2023
- Neighborhood character
- Predominantly White (95%)
- Race & ethnicity
- White 95% Two or more races 4%
- Common ancestry
- Romanian 10% Lithuanian 5% Slovak 3%
- Foreign-born
- 0%
Political lean MEDSL · Oneida
- 2024 margin
- Strong R (+21.3) · D 39.4% · R 60.6%
- 2008→2024 swing
- -15.2pp toward R · 2008: -6.1pp · 2024: -21.3pp
- All cycles
- 2024: R+21.3 2020: R+15.5 2016: R+21.1 2012: R+5.3 2008: R+6.1
Not yet ingested
- Civics
- —
Market trends
- HPI YoY
- ▲ 83.52%
- Current HPI
- 425.0098
- Rent YoY
- —
- Metro
- —
- State GDP YoY
- ▲ 2.60%
- F500 in state
- 92
Industry mix (Fortune 500 HQ in NY)
| Industry | F500 HQs | Revenue |
|---|---|---|
| Financial Services | 10 | $950B |
|
||
| Consumer Goods | 9 | $162B |
|
||
| Insurance | 4 | $225B |
|
||
| Telecommunications | 2 | $144B |
|
||
| Pharmaceuticals | 2 | $112B |
|
||
| Media / Entertainment | 2 | $69B |
|
||
Price history
+204.5% since first listed2 events — show timeline
- 2026-05-12 Listed $169,900 CNYIS
- 1997-07-01 Sold (Public Records) $55,800 Public Records
Property tax history
-1.2%/yrLatest (2025): $1,825 · -26.3% YoY. Source: county tax records.
Cash-flow waterfall
monthlySold comps — $/sqft
last 12 mo · ≤1 miLoading sold comps…